ALCN - Weekly review Alexandria Containers and goods CASE:ALCN
Egypt / Industrials / Transportation Infrastructure
The review is based on Ichimoku Kinko Hyo, and Haikin Ashi.
The narration is in Arabic language & channeled toward Arabic Speaking EGX traders.
Thank you.

ATQA is preparing to beat Resistance1-hour chart, the stock has a high probability to cross the Resistance upwards, forming a triangle pattern, and to target 5.97
The next target will be 7.35 (pennant pattern)
Below Support, targets S2, and stop loss below 4.25

EIUD should target 0.425 after beating Resistance (R)Weekly chart, trading in a falling expanding wedge, high probability to target the Resistance line (R), then cross upwards.
Above Resistance (around 0.308), the target will be 0.425
Above R2 targets R3 (around 0.520)
Raise the profit protection level as the price goes up.. Below 0.230 stop loss
** Be careful with this stock - as it has up and down sudden sprints!

AIFI should target 0.585 after crossing Resistance30-min chart, the stock is trading in a falling wedge.
After crossing up, the target is hitting the resistance line (R) upwards.
After crossing at around 0.520, the target will be 0.585 passing through some resistance levels as shown.
Below 0.503 (support line S) stop loss

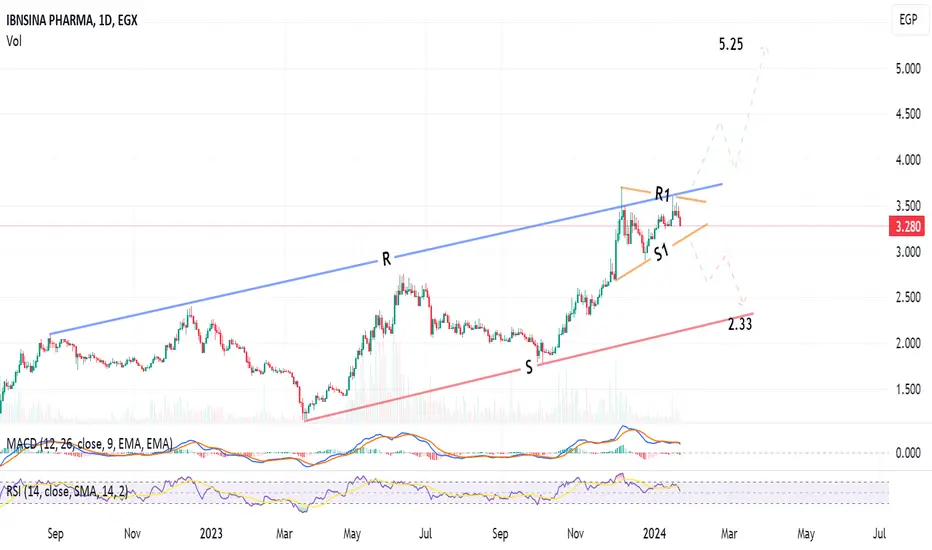
ISPH is on critical price zone !Daily chart, the stock may test support S1 then rebound to R1 (a triangle pattern).
MACD is signalling some correction (downwards direction)
After crossing the resistance line R (around 3.67), the target will be 5.25 - Rising Channel pattern
Below S1, the stop loss.
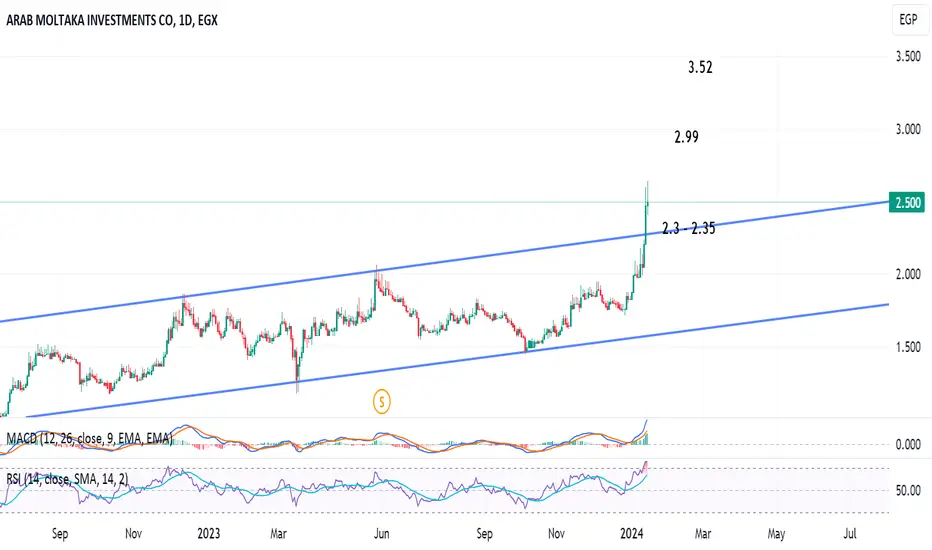
AMIA should target 2.99 then 3.52Daily chart, the stock made a nice breakout to the rising channel, the target is 2.99, then 3.52
However, as the technical indicator RSI is in the over-bought zone, there may be a correction before continuing upwards.
Profit protection level should be dynamically considered as the stock price goes up.
Faisal Islamic Bank (FAITA) should target 1.26Weekly chart, the stock is trading in a rising expanding wedge (semi channel). It should rebound from the Support line (red) towards the Resistance line (blue) to around 1.26 passing through some resistance levels as shown.
Stop loss below Support line.

MACRO should target 4.35 then 4.77 after crossing resistanceDaily chart, I am expecting the stock for form the chart pattern Cup & handle.
After crossing the R esistance line, and closing 2 days above 3.45, the target will be 4.77 passing through resistance levels 4.00 and 4.35.

Beltone (BTFH) should target 5.5 after confirming breakoutDaily chart, the pattern triangle was formed. Closing above 4.05 will confirm the target 5.50
Technical indicator MACD is positive. RSI is getting near over-bought; pushing for correction!
So, be careful and ready with a dynamic (quick) stop loss

ACAMD to target 1.12 then 1.40 after crossing Resistance1-hour chart, the stock is trading in a rising triangle pattern, going to hit the Resistance line (blue) at around 1.118 - 1.120.
After crossing up, the target will be 1.30 then 1.40
Stop loss below the support line.


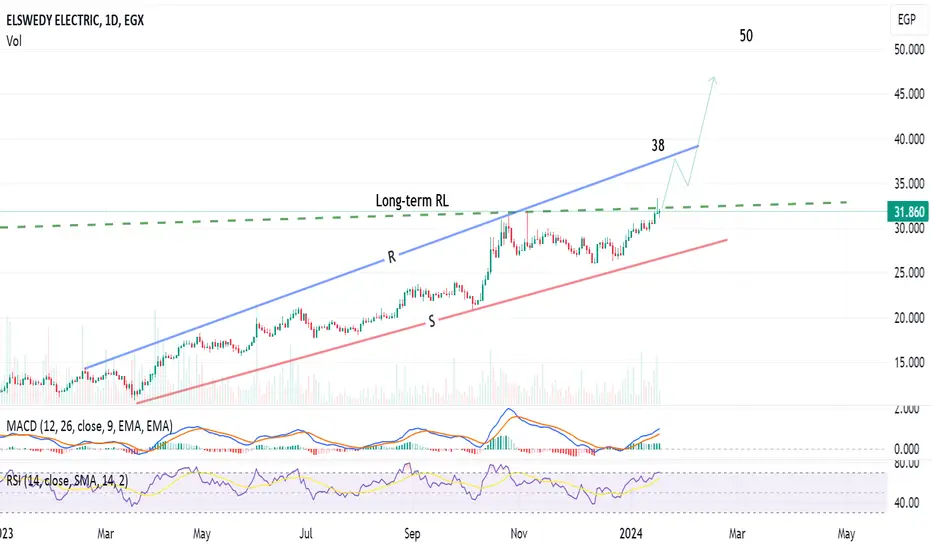
ElSwedy Electric (SWDY) should target 38 then 50 and 55Daily chart, the stock is trading in a rising widening wedge, and has a tendency to cross the long term Resistance line (RL) at around 32.7, then the target will be 38.
Above the resistance line R1, the target will be 50 - (then 55 on the weekly time-frame)
EGAL, Egypt, should go to 103Daily chart, the stock formed a descending triangle, and pennant chart patterns, and the target is 103
Technical indicators RSI and MACD are positive, confirming this uptrend view.

ACAMD has a potential to reach 1.82 after crossing 1.38Weekly chart, the stock is trading near a resistance zone, and is trying to cross 1.12-1.13
Above this level, the targets will be 1.28 and 1.38, then 1.68 extending to 1.82

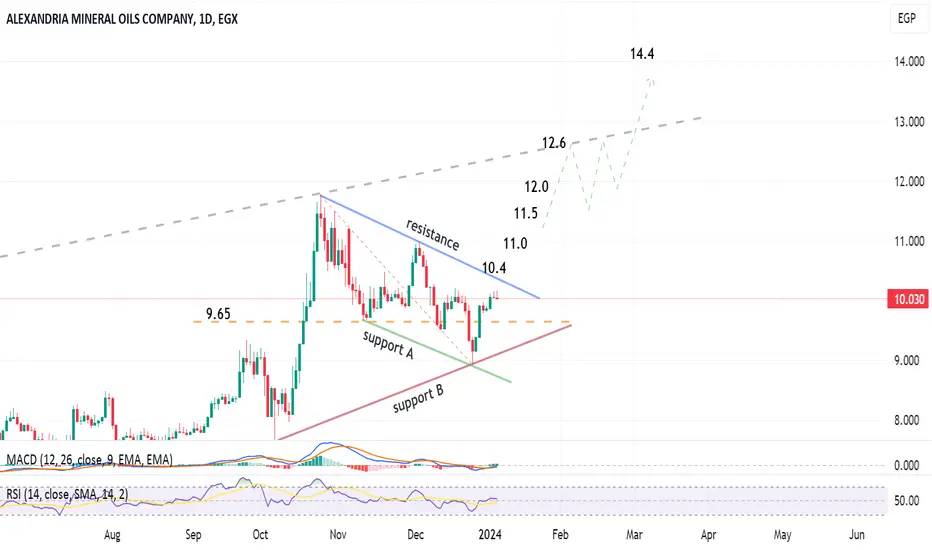
AMOC to target 14.4 after crossing resistanceDaily chart, AMOC is trading in a descending channel, and it seems a chart pattern will be formed - a flag / inside a triangle.
After crossing the resistance (at 10.35 - 10.4), the target will be 12 and 12.6 , then some correction may happen at 12.6 before reaching the target 14.4
Stop loss below 9.6 to be considered.
EHDR should target 0.450, then 0.625Weekly chart, the stock is trading in a falling expanding triangle, with a tendency to cross the resistance line.
After crossing at around 0.430, the target will be 0.530, then zigzag upwards up to 0.903 passing through the shown resistance levels.
Technical indicators RSI and MACD are positive.

Cairo Oils & Soap, Egypt, should target 0.549, then 0.579Weekly chart, the stock (COSG) is trading in a rising channel, and is inclined to cross the resistance.
Above resistance line, the target will be 0.549, extending to 0.579 then 0.621
Technical indicators MACD and RSI are supporting this view.

Bulls are back for EGAL?- good chance that there may be a continuation for EGAL to the upside.
- Volume has decreased during consolidation, which is my only con for this trade. but it may pick up during the move.
-Make your decision, size accordingly, and manage risk.

MM Group is about to cross the resistance; then 11.4Daily chart, the stock has formed an expanding triangle chart pattern, and is preparing to cross the Resistance line (blue).
After crossing, the target will be 11.4
Stop loss should be considered below 6.85

FAWRY, Egypt, is on a critical price level !Daily chart, the stock is trading in a rising channel, and is inclined to test the support line (Red), then rebound to the resistance line (blue)
Below support, the target is 4.62.
Above the support, the target is 7.76 (Crossing at around 6.66 - 6.70)

ISMQ, Egypt, is on a critical price level !30-min chart,
I chose this "little" time-frame to see intra-day sentiments. This is not for opening new positions. Be careful!
Higher probability for testing the support (red) line, then rebound upwards; as the technical indicator Stochastic RSI is 0, and the volume is decreasing with price decrease.
After crossing the resistance (blue) line, the target will be 4.33
But below support, it is 2.37

Egyptian Poultry should target 7.05, (then 8.90 after crossing)Daily chart, the stock (EPCO) is trading in a rising wedge, and the technical indicators RSI and MACD are reflecting a tendency to complete upwards to the resistance line (blue) - around 7.05
After crossing the resistance line up, the target will be 8.90 extending to 9.05

SPMD should rebound and target 0.655 after beating resistance1-hour chart, the stock (Speed Medical, Egypt) is trading in a falling expanding wedge pattern, and is getting into technical indicator RSI buy area.
The Ichimoku chart signals a change to up-movement.
So, the higher probability is a rebound to the resistance line. After crossing up, the target will be 0.655
