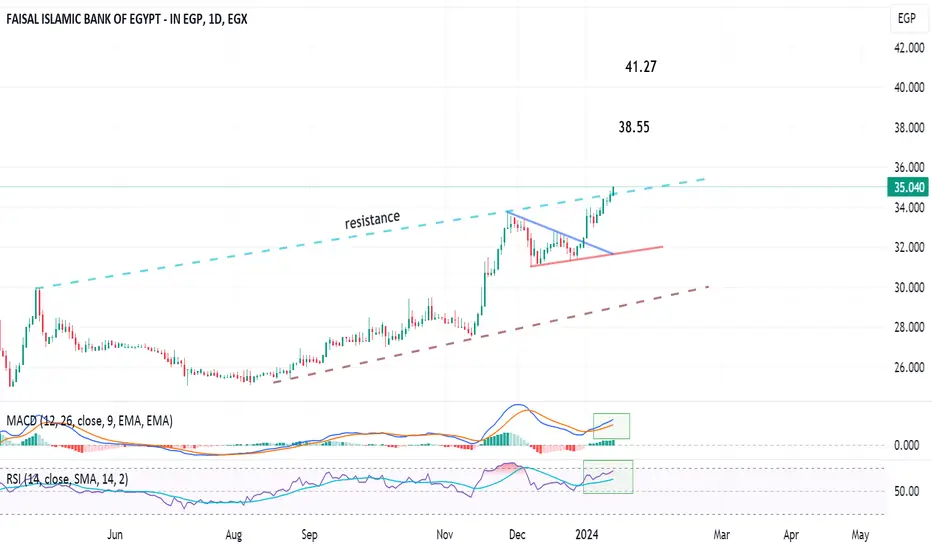
Faisal Islamic Bank (FAIT) should go to 41.27Daily chart, the stock formed a chart pattern pennant, and crossed the resistance line, then the targets should be 38.55 and 41.27
Technical indicators RSI and MACD are positive.
Delta Sugar is targeting 95 then 113Daily chart, Delta Sugar, Egypt, has formed a triangle chart pattern and the target is 95.
The next target is 113 after the clear crossing of 96
Below the support line (red), stop loss should be considered.
RSI and MACD are positive.

Can Fanar Contracting (FNAR) make the unexpected rally to 2.45?1-hour chart,
Note: Using Heikin Ashi candlesticks because of the low volume - and this is not suitable for daily trading.
Fanar Contracting (FNAR) seems trying to rebound to test resistance. The target is 2.10
After crossing the resistance, the longer-term target will be 2.45
Tech. indicators RSI and MACD are positive. However, the low trading volume decreases the accuracy.

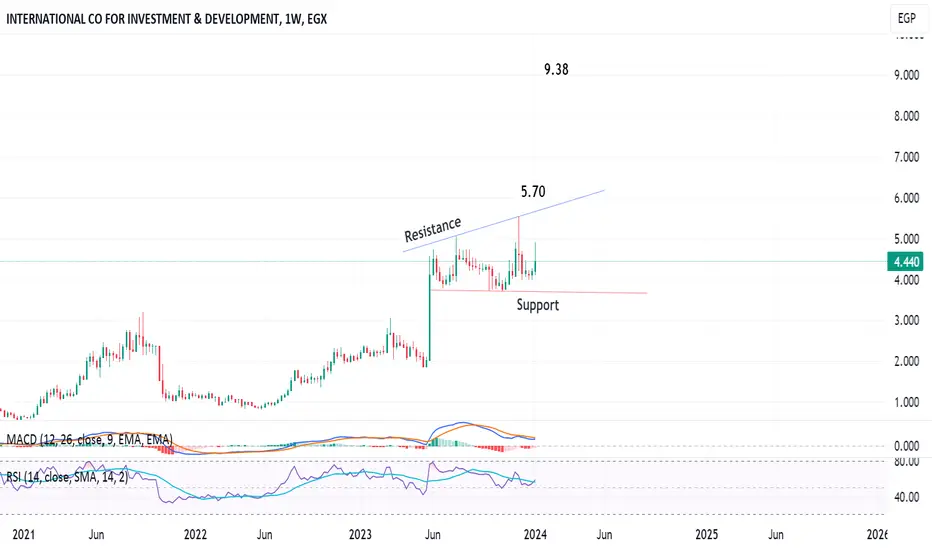
A good potential for ICID, EgyptWeekly chart, the stock is trading in an expanding triangle, with positive technical indicators RSI and MACD.
After crossing the resistance line (BLUE) - at around 5.7, the target will be 9.38
Below the support line, the stop loss should be considered.
Is EIUD preparing for a nice bullish wave?Daily chart, the stock is trading in a falling channel, and last candlestick completed a chart pattern triangle. the target is 0.71
The next target will be activated after crossing the channel to 0.89, then 1.15

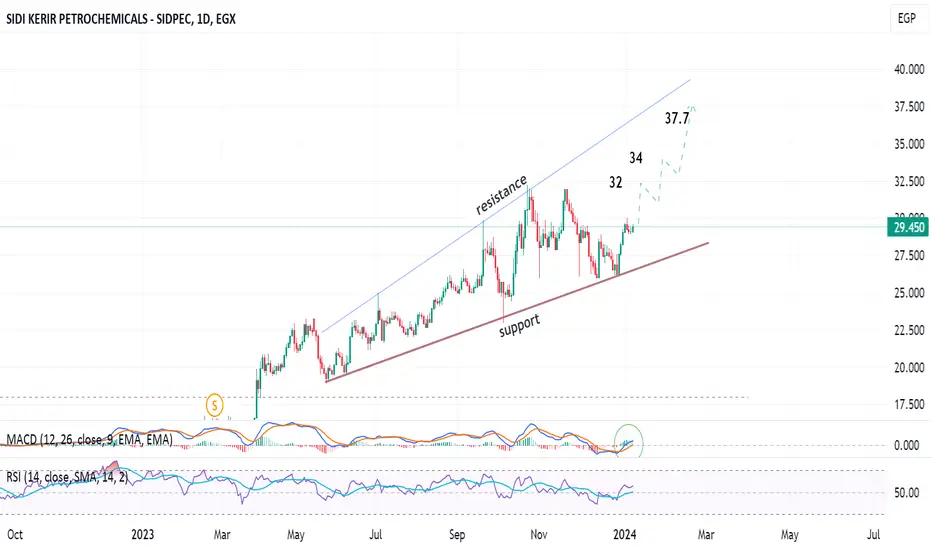
Sidi Kerir Petrochemicals (SKPC) should target 37.7Daily chart, the stock SKPC has been trading in an expanding triangle since May 2023, and it is trending upwards - as supported by the positive MACD and RSI indicators.
Targets are 32, 34, then 37.7
For daily trader, the stop loss below 28.5 should be considered.
OIH needs some bullish power to rebound and beat resistance1-hour chart, OIH needs a quick rebound - otherwise a correction will happen to 0.374 extendable to 0.362
New buy entry above 0.405
Above resistance (BLUE line), the target will be 0.512 extendable to 0.521
RSI is positive, in the buy area.
MACD is negative: downwards is highly possible.

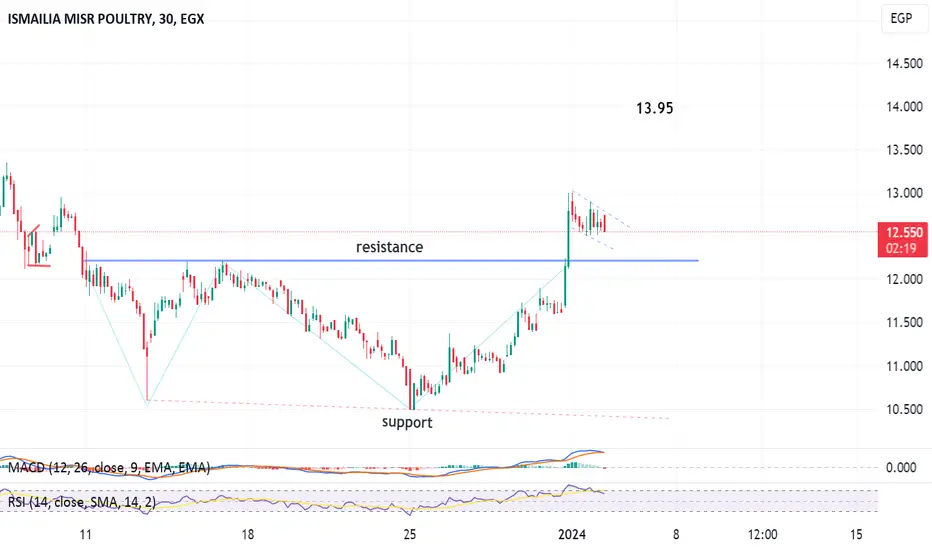
ISMA formed W chart pattern - Target 13.9530-min, the stock formed W chart pattern, which targets 13.95
Note, the blue (resistance) line, turned into a support level after crossing up. So, consider a stop loss below it.
Potential trade on ISMQstuck in a range for couple of months.
already its in a good area to start adding shares imo.

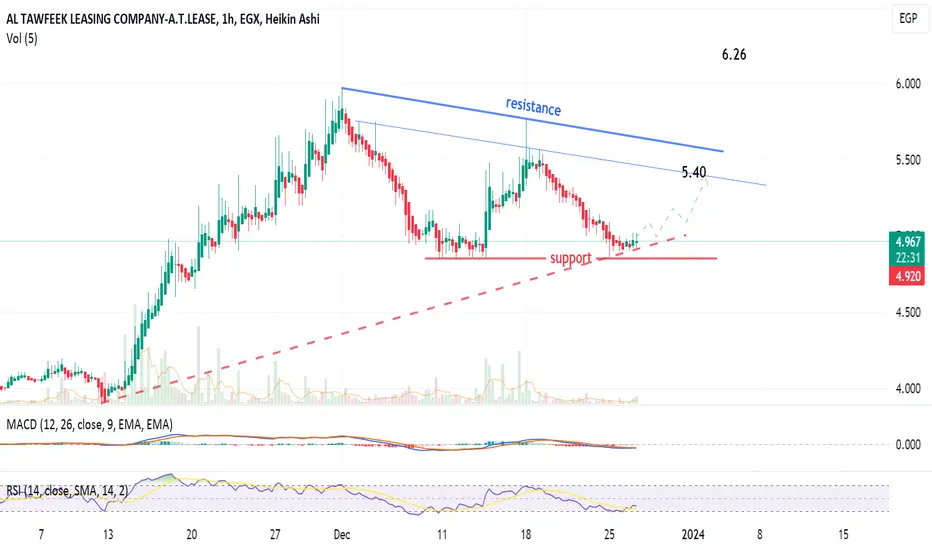
Will AT Lease (ATLC) stock beat resistance and cross 5.4 soon ?1-hour chart,
AT Lease (ATLC) is showing positive signs that the rebound will continue to first resistance (around 5.38). After crossing 5.40, the target will be 6.26
Technical indicators: RSI is positive, MACD is preparing to cross up..
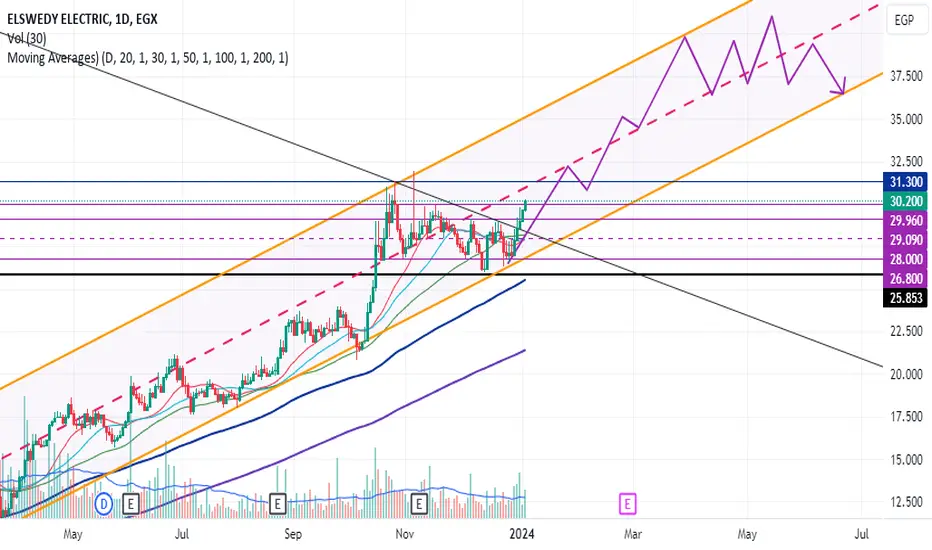
swdy until jun2024This my idea for swdy journey in first half of 2024.
This is for long term invisting.
For short term venture this could be inaccurate.
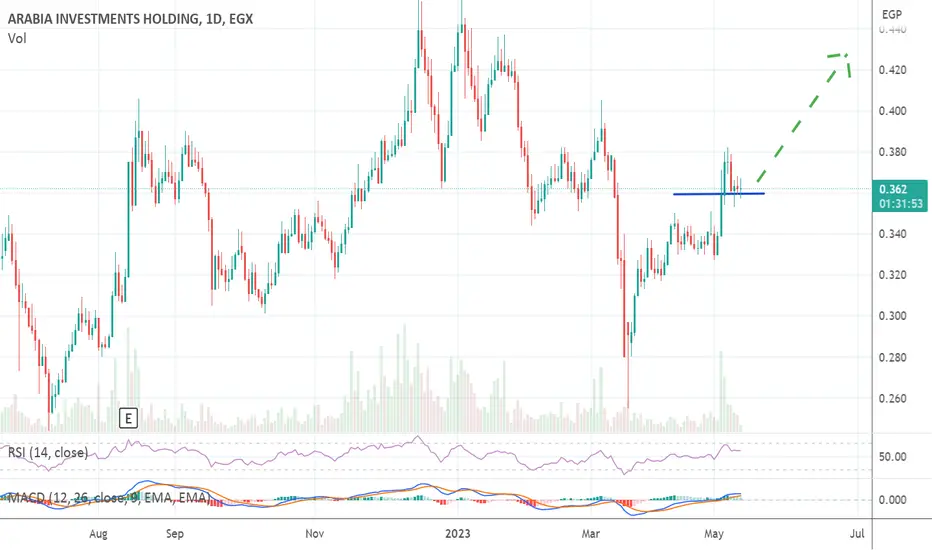
AIH, EGX, to target 0.45, LongOn daily chart,
AIH is building a strong support at 0.36, target 0.45 soon.
ORWE, EGX to target 14.5monthly chart
ORWE stock is targeting 14.5
Positive and strong technical indicators

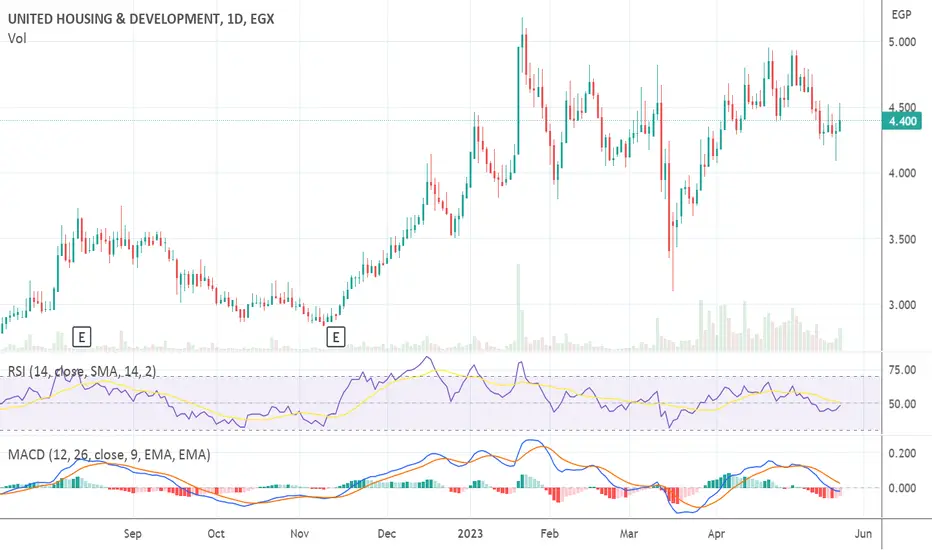
UNIT, Egypt, ready to reach 4.95UNIT , on the daily chart, is ready to target 4.95
Upon crossing this level with high volume, further higher targets will be seen (5.5 and 6)
It is time for EGBE to go long-term bullish?Monthly chart, the stock has been in a long-term downtrend, and the chart pattern falling wedge was formed.
The target is 0.610, extending to 0.652 and 0.795 (Fibonacci extension)
My view: it is a nice long-term investment.

EXPA to target 22.8 after crossing resistance lineDaily chart,
EXPA to target 22.8 after crossing the resistance line (blue) at 18.7 - 18.6
Stop loss at 17.2
The second scenario , breaking the stop loss level, the target will be the support line (red), and a new BUY can be done, to target the resistance blue line up (rebound trading)

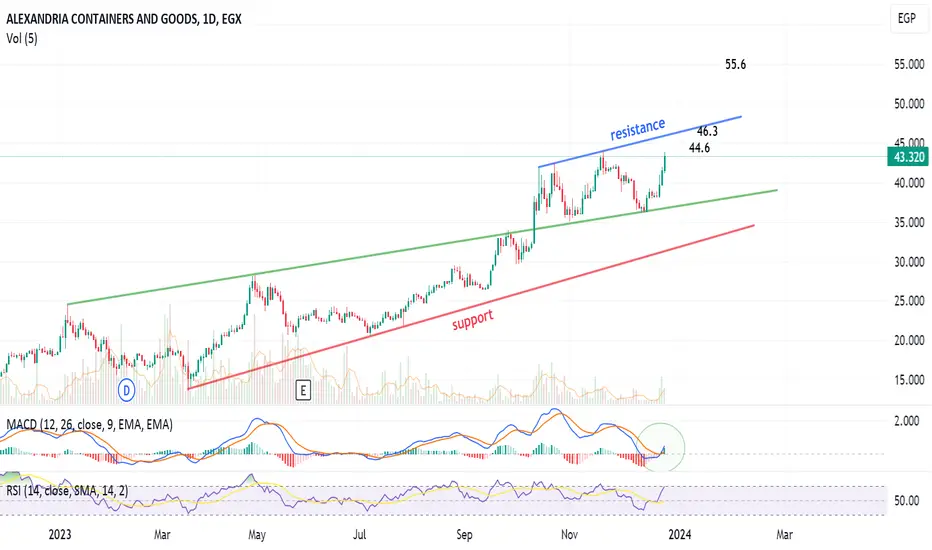
ALCN has a nice MACD signalDaily chart, Alexandria Containers (ALCN) has the MACD indicator crossed up the zero line and positively the stock has a bullish movement towards 44.6, then to test the resistance at around 46.3
Closing above resistance line will activate the target 55.6
Waiting for EKHO to confirm rebounding!Monthly chart, EKHO is still suffering (relatively) low volume trading, and the last candlestick is not complete.
We need to wait a strong rebound from the support line, and then the crossing of the medium term resistance (GREEN). Above this level (around 1.05), the target will be 1.37 then 1.57 (to test the long term resistance - BLUE line)
Technical indicator RSI is positive in the BUY area.
MACD is negative! Be careful, with the stop loss below the support)

AIFI is waiting a direction confirmation!30-min chart, AIFI is trading in a critical level, where it can rebound from the current level to test resistance (BLUE), or go downwards to test the support line (RED)
My view is more positive (upwards)..
Some important price levels of resistance and support are shown on the chart for monitoring.
Above resistance: target 0.800
Below support: target 0.412

ADPC (Arab Dairy - Panda) to target 4.61 after confirmationWeekly chart, the stock has been accumulating for long weeks.
After confirming 2 weeks closing above 1.97, the target will be 4.61
MACD crossed up positively
Stop loss below support level

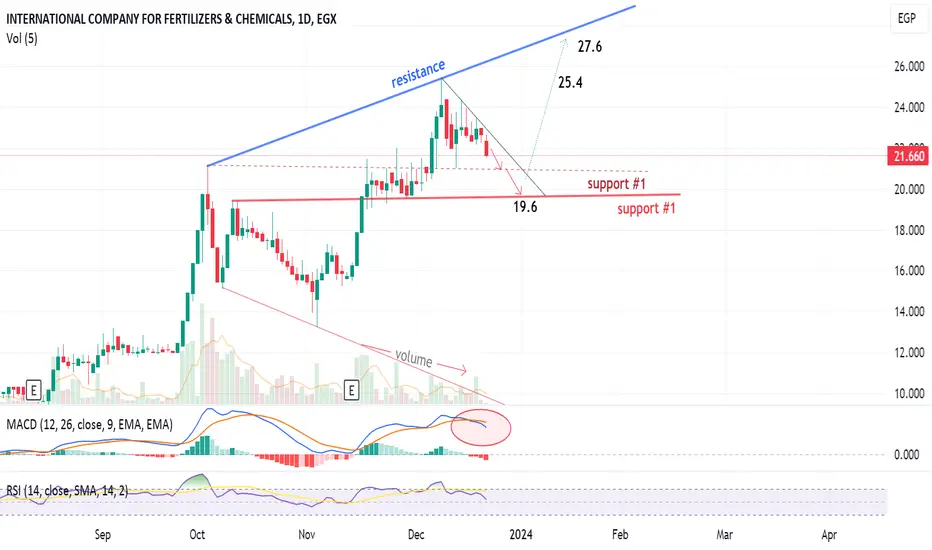
ICFC to test support Daily chart, ICFC stock is seen to test support #1 or #2 then rebound towards resistance line (BLUE)
The MACD indicator crossed the signal line downwards = negative sign
Below 19.6, the stop loss should be considered.
MFPC UP TO 1000 !Buy MFPC TO TARGET 1 = 540
After rising and stabilizing above the 540 EGY, the price targets the 1000 EGY
NOTE This is not should not be construed as an offer to sell or the solicitation of an offer to purchase or subscribe for any investment.
