RREI (ALICO) to target 1.28ARAB REAL ESTATE INVESTMENT CO.-ALICO
Weekly chart.. RREI is preparing to cross 0.81 upwards, then the target will be 1.28 - 1.29 in few weeks
The technical pattern is expected to complete soon..
Stop loss level 0.7

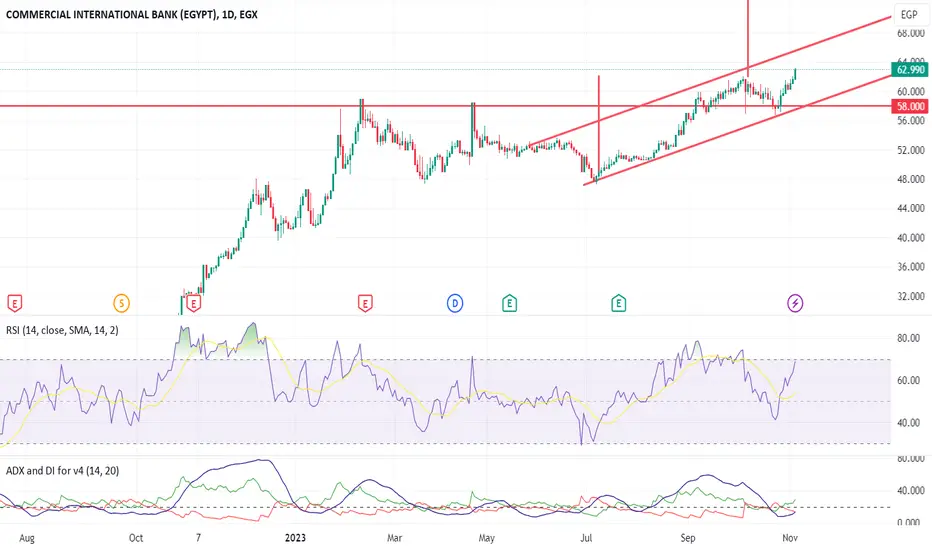
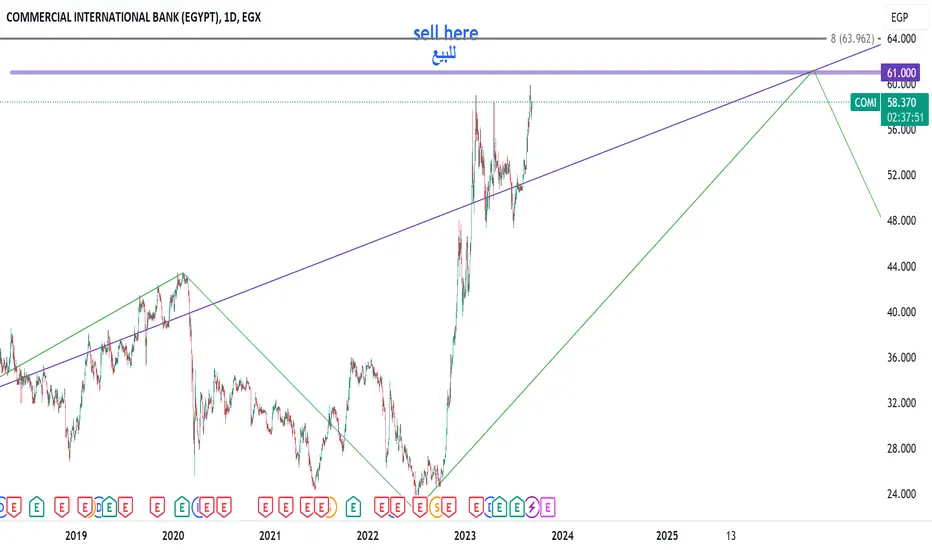
COMI in rally leading the EGX 30the Commercial International Bank (COMI) is leading the EGX 30 with weight of 26.21% to a historical high points that was not been reached before. We can see from the chart that still having a potential rally after breaking the level of 58. However, the volumes is low and the rally to the uptrend is not as sharp as before. It is moving in an uptrend channel, not that perfect, but giving a close view in the short term.
It is expected to continue in it's direction reaching new levels around 75.
on the other hand, if the stock returned below the 58, it will fall dramatically to the next level around 47.5, and may continue to 40.
According to the economical data and the current situation in the region, specially the war in Gaza, we can not say that or predict the time that we can say that the EGX30 reached it's peak, so I recommend the investors to keep in consideration the risk ratio and distribute the portfolio on several stocks with a suitable risk management.
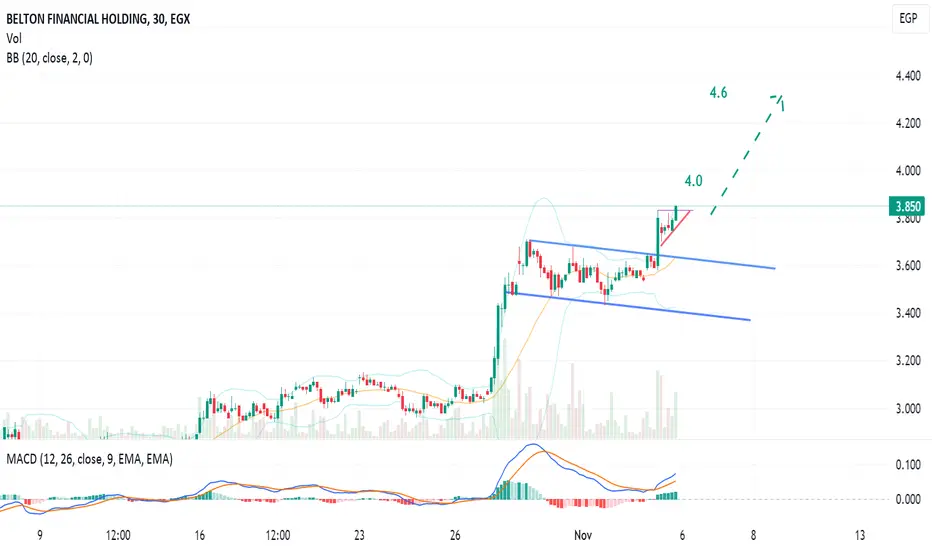
BTFH to target 4 and 4.6 soonBTFH has crossed up a strong resistance zone. On the 30-min chart, technical indicator MACD and pattern target 4 then 4.6
Profit protection level should be raised at each up-movement.
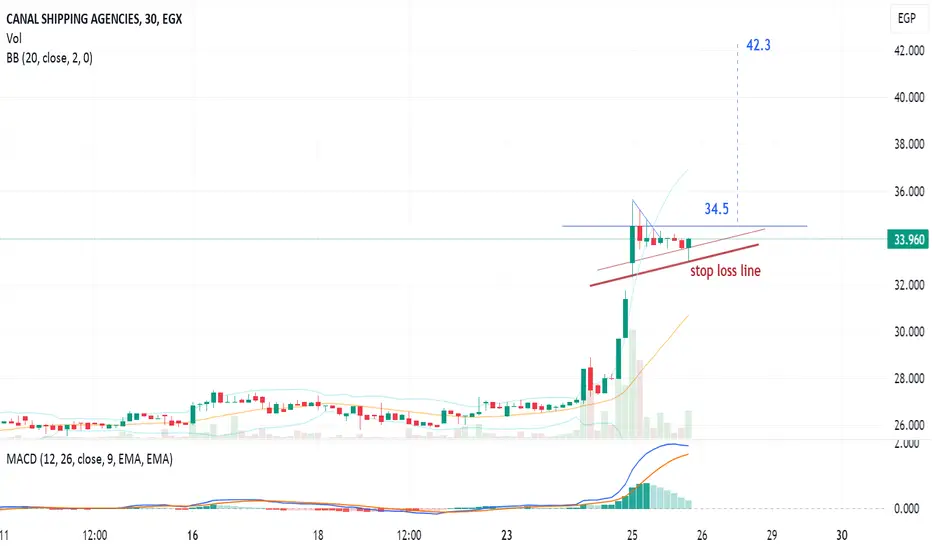
CSAG to target 42.3 (under condition)CSAG
on the 30-min chart, should cross 34.5 with high volume to target 42.3
The stop loss line should be monitored and considered.
Note: Technical indicator RSI is showing over-bought signals.
Note: This stock has had a big rally, and correction should happen. Profit protection should be considered.
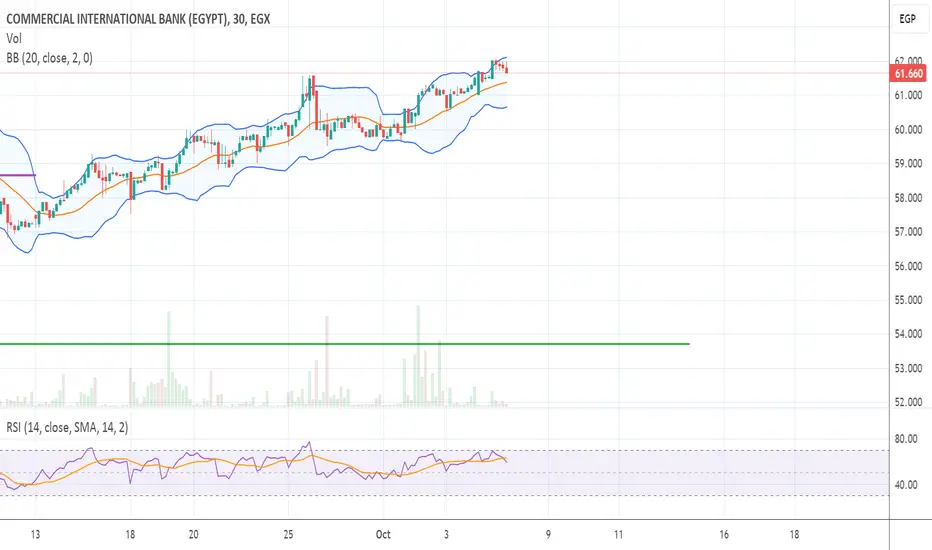
COMI, re-test 59.5 then target 70.3COMI, on the 30-min chart,
I see technical signs that the stock will go down to 59 - 59.5 , then turn up to target 70.3
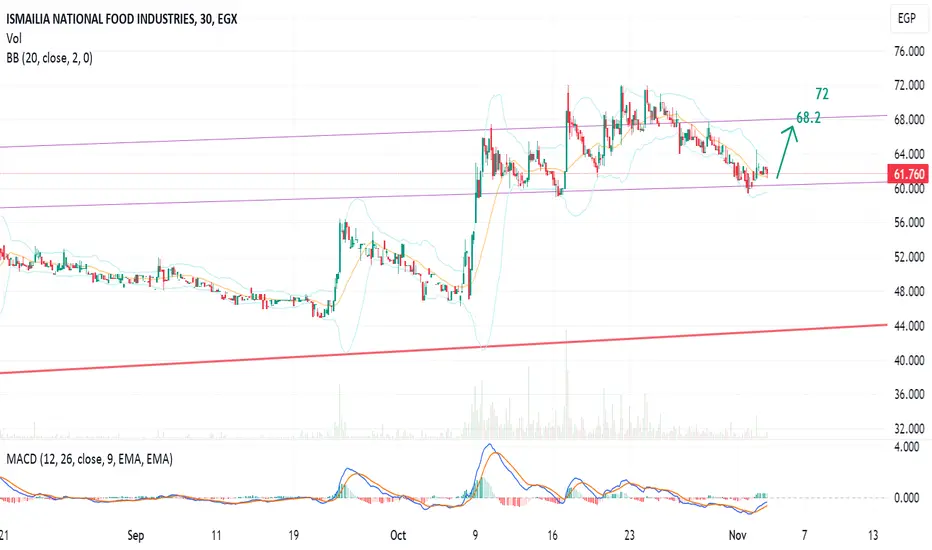
INFI to target 72 soonINFI is preparing to go above 68.2 and target 72 soon
Using 30-min chart..
Positive technical indicators and last candle.
Stop loss at 59 should be considered.
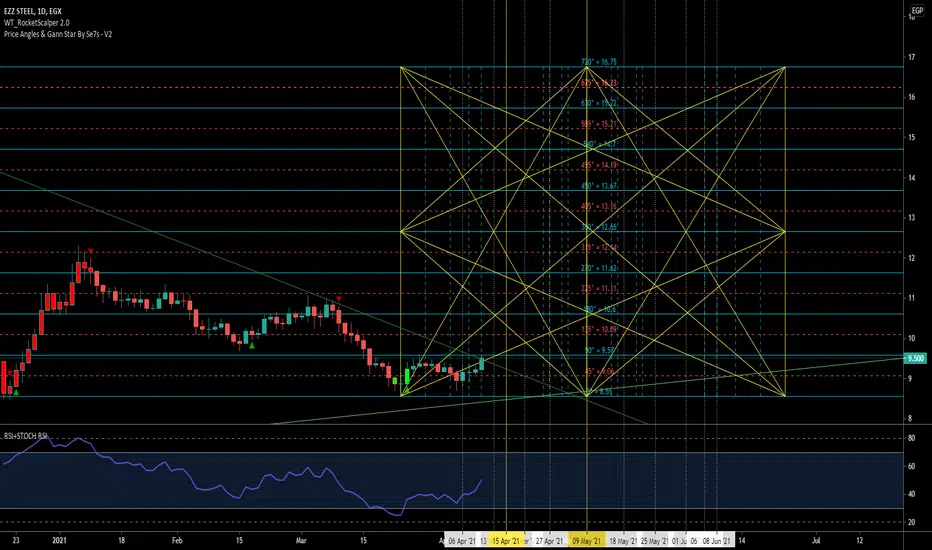
ASCM, to target 16.75 in few weeksASCM is showing a positive signal to go uptrend on the weekly chart
First target 16.75
after crossing up 16.75, the stock will target 20, 25
The (red) moving Stop Loss Line should be monitored and considered.

AIFI to target 0.39 soonAIFI is showing a high potential to jump soon to 0.39
On the 4-hour chart, the crossing up of the triangle pattern and the RSI technical indicator are supporting this idea..
The red line is the stop loss to be noted.

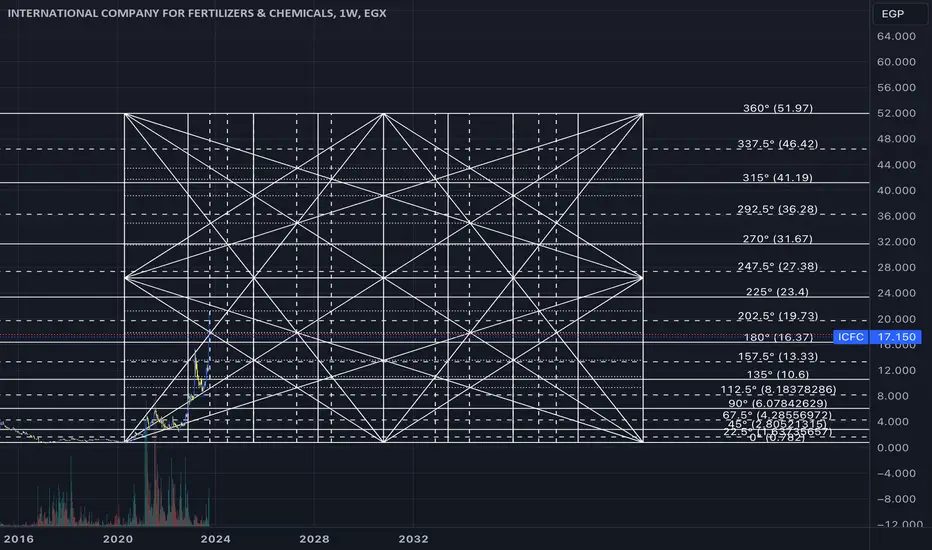
Next cyclesupport and resistance lines.. horizontal lines are Support/Resistance . Vertical lines are time pivots . Appreciate your Comments. GL Gann fans .
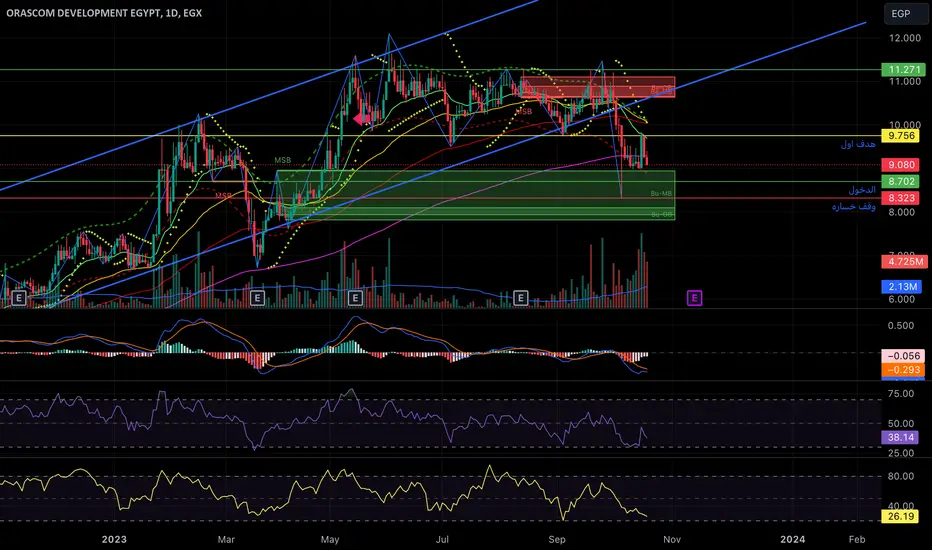
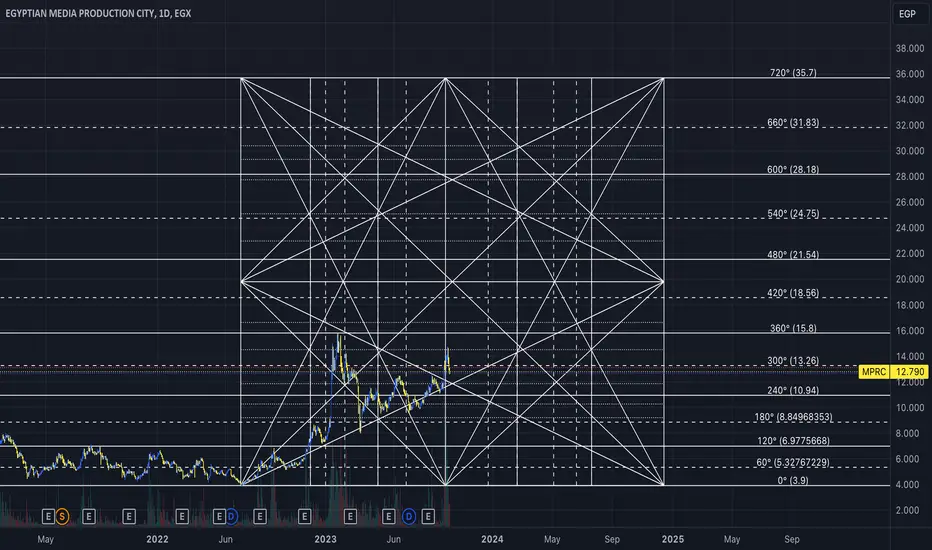
Orhd New entering position is close by. Be ready. As we can see from this drawing. This company is targeting. The lowest bottom. Of the month. So. It's will be Low risk with high earn.
ELSH it has Potential. to ride the wave again.As we can see in this chart. It. Trying to uh? Hold back holding with the third support. So I think It will write them with again.

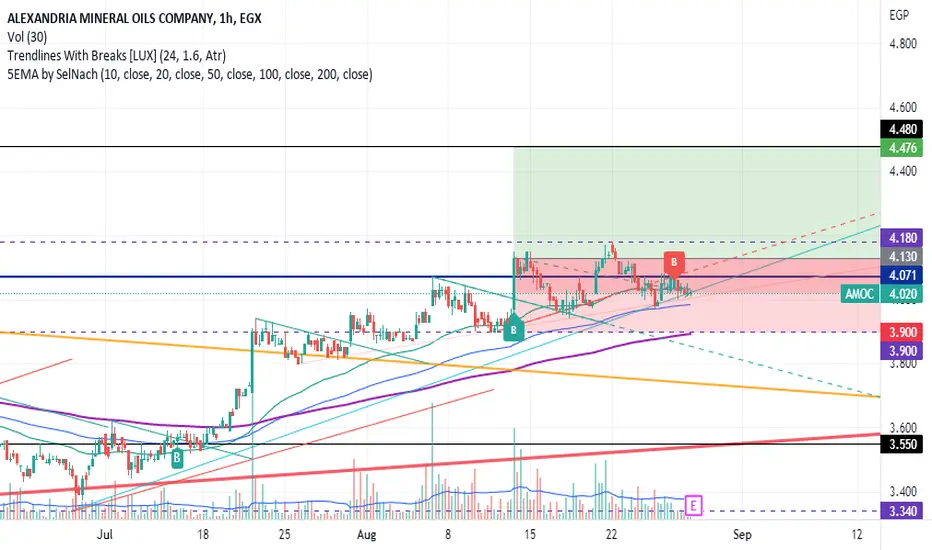
you can buy amoc between 4.13 - 4.07this is technical analysis for short term on hourly chart
buy at 4.07
target 4.47
stop loss 3.90
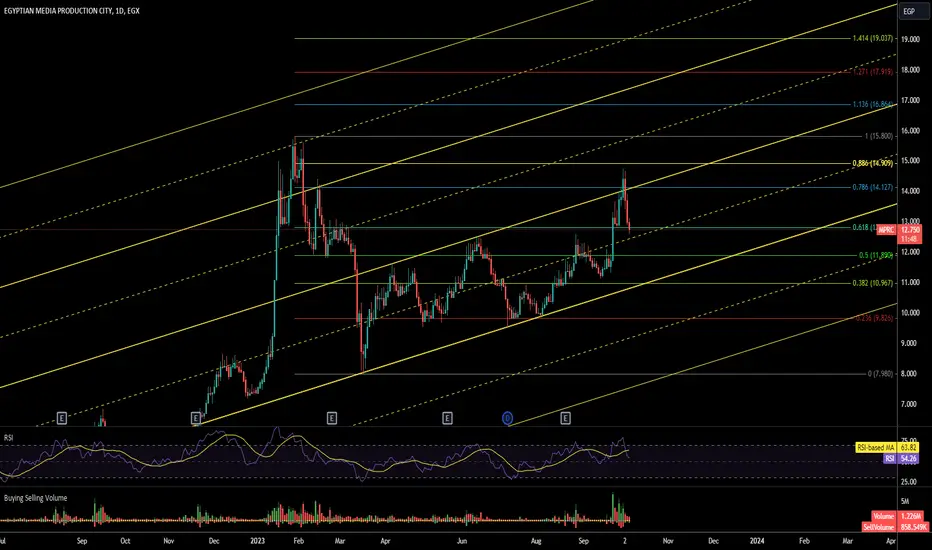
MprcTarget 15.79
Support 12.75
Stop Below 12.5
On Chart Fib Levels
12.75 is .618 FIB level,, Good Area to buy.
Top not Reached yet.. Possible Double top or more 15.799
Good Luck
ABUK, Egypt, to test 43 - 42 before rebounding to 48ABUK, EGX, on 1-hour chart:
To test support level 43 - 42 before rebounding to 48.
By crossing 48, the next target will be 53
Stop loss at 42 - 40 should be considered, as the stock has over-bought signals in the long term.

MPCO, higher possibility to target 0.92On 30-min chart,
MPCO , EGX, is trading in a channel, until crossing up and targeting 0.89, then next target 0.92
Technical indicators RSI and MACD are showing higher possibility for going up.
Stop loss at the lower channel line (around 0.82) should be considered.
It is a volatile stock.

ofhHe breaks this line and replies over it within two daily frame sessions, nothing more, and closes over it
Your target is 0.374

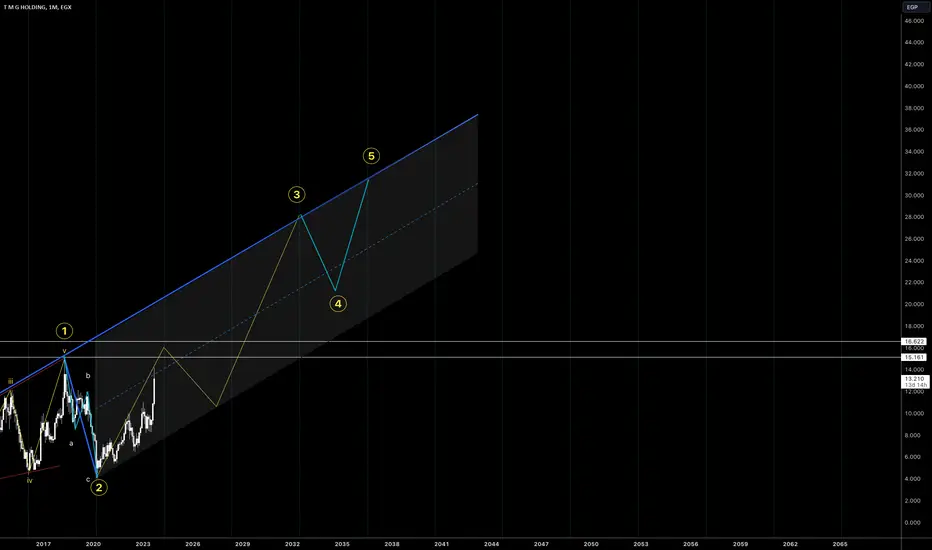
tmghtrading idea for long term investment
This wave numbering is based on a monthly basis according to the ruling time cycle EGX:TMGH
GGCC, to target 0.825GGCC has been accumulating for 91 weeks, and finally crossed the upper line of channel.
On the weekly chart, the targets are 0.56, 0.63 then 0.82
Technical indicators RSI, MACD are positive for the uptrend.
Stop loss: 0.37 - (0.36 with higher risk)

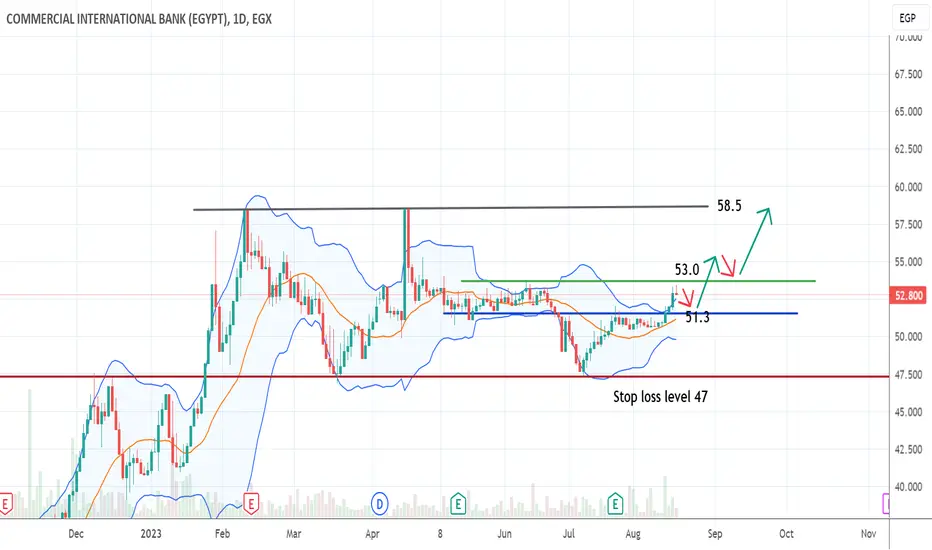
COMI, to target 58.5 in few weeksOn the daily chart, the stock COMI is trading in a channel, with a support level 47, and the target is 58.5 after crossing 53.
RSI and MACD techn. indicators are positive for uptrend.
A re-test at 51 - 51.5 is OK, before crossing up.
Stop loss should be considered.
GBCO (AUTO), To target 5.95 soonGBCO (AUTO formerly), EGX, on 30-min chart
has a support at 5.30
crossing 5.5 will lead to target 5.95, with sub-targets 5.7, 5.80.
Crossing 5.95 will target 7
