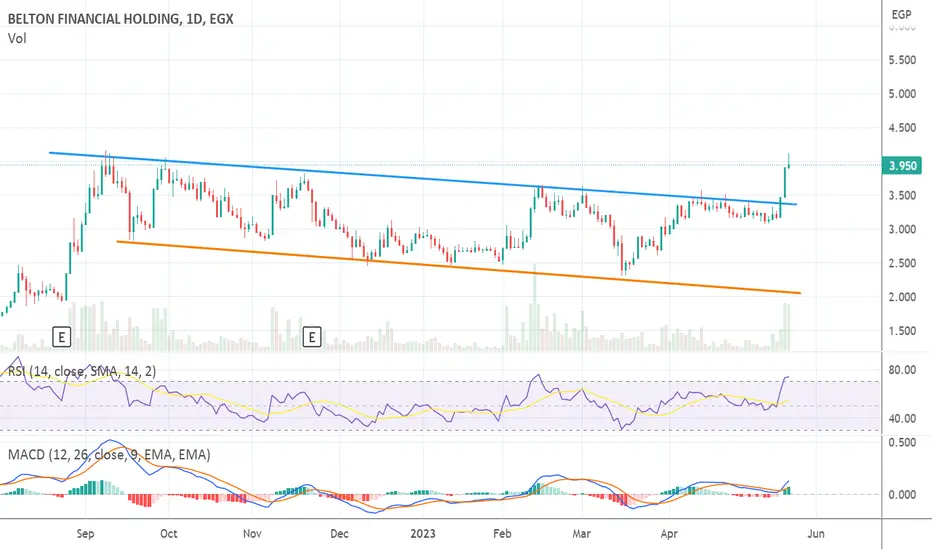
BTFH, To target 4.70BTFH, on the daily chart, is targeting a 4.7 level in the short-term.
A re-test at upper channel line is OK before heading to the target.
Further higher targets to come after passing this level.
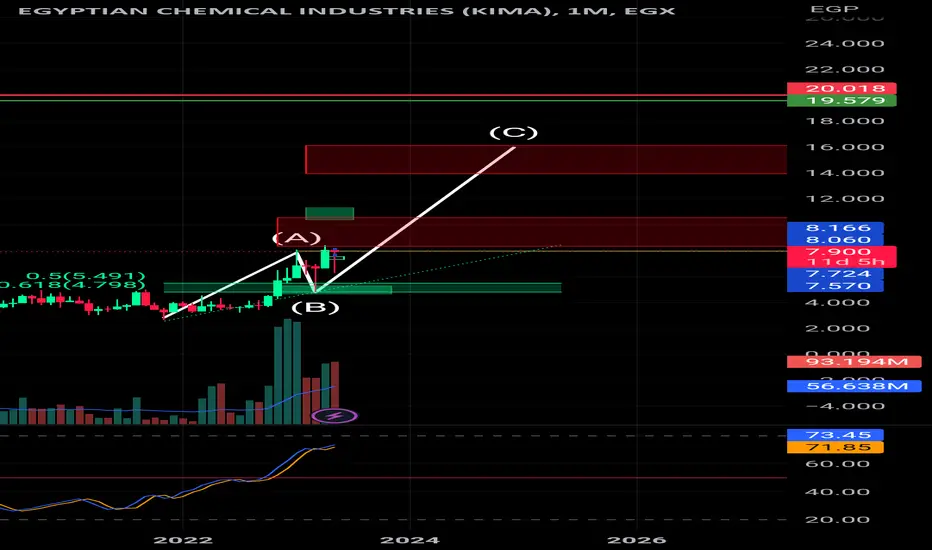
EgchGoals on the monthly frame 16 pounds, then 20 pounds, and I remember my words and password in the stock 8.20
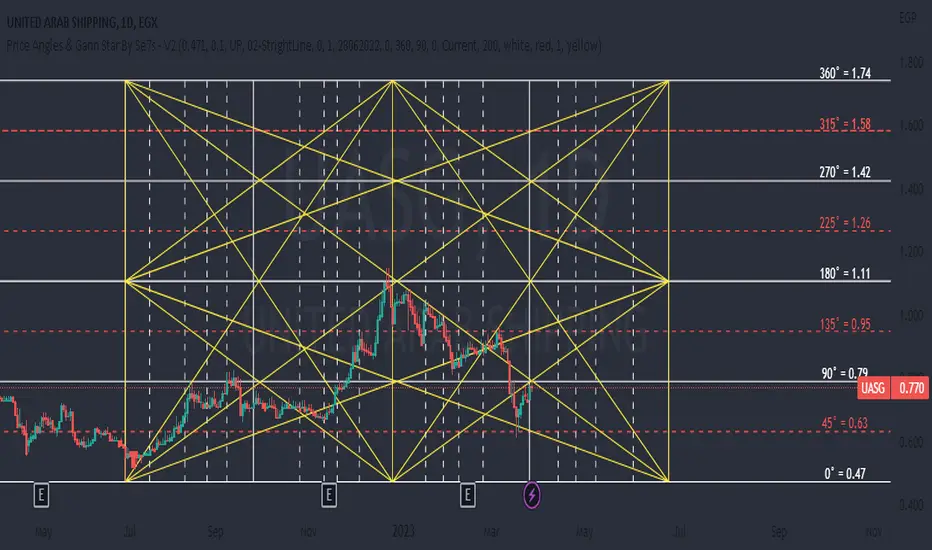
Heli Daily Fib ChannelLong Term Trends
Trade between these levels.
<>
The Fibonacci Channel is a technical analysis tool that is used to estimate support and resistance levels based on the Fibonacci numbers. It is a variation of the Fibonacci retracement tool, except with the channel the lines run diagonally rather than horizontally.
The tool is used to aid in identifying where support and resistance may develop in the future. If the uptrend is expected to continue, the 100%, 161.8%, and other higher levels are potential price targets. The same concept applies to downtrends if a downtrend is expected to continue
In an uptrend, the zero-line is like a normal trendline, helping to assess the overall trend direction. If the price falls below it, it may need to be adjusted based on more recent price action, or it could signal that the uptrend is over and that the price is breaking lower. Similarly in a downtrend, the zero-line also acts like a trendline. When the price is below it, it helps confirm the downtrend. If the price moves above it, the indicator may need to be redrawn or the price is moving higher out of its downtrend
Difference Between Fibonacci Channels and Andrew's Pitchfork
Both these indicators attempt to predict future support and resistance levels based on price levels from the past. Fibonacci channels attempt to do this with percentages of a selected price move. Those percentages are then projected out into the future. Andrew's Pitchfork is simpler in some ways as the angled lines are based on three price levels selected the trader and then extended out into the future.

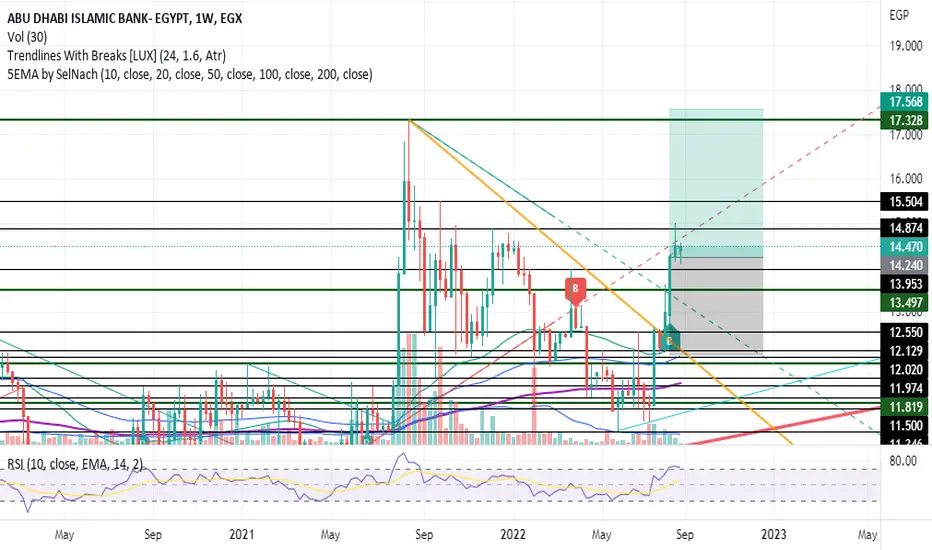
buy Adib at 14.42 this is technical analysis for medium Range on weekly chart
buy at 14.42
target 17.55
stop loss 12.02
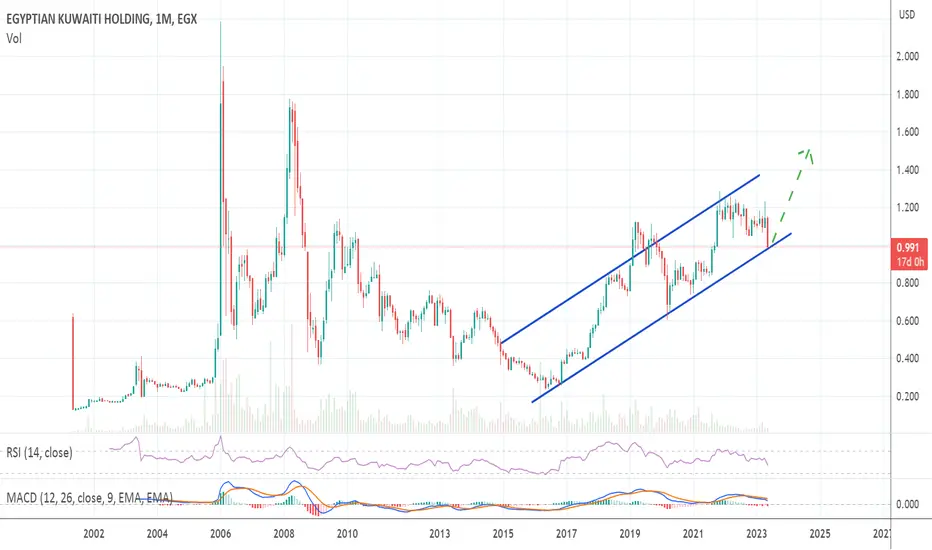
EKHO, EGX, accumulating to target 1.5EKHO , EGX
On the monthly chart, started the accumulation stage.
To target 1.5 in 14 - 15 months, as long as the stock remains above the support level 0.95
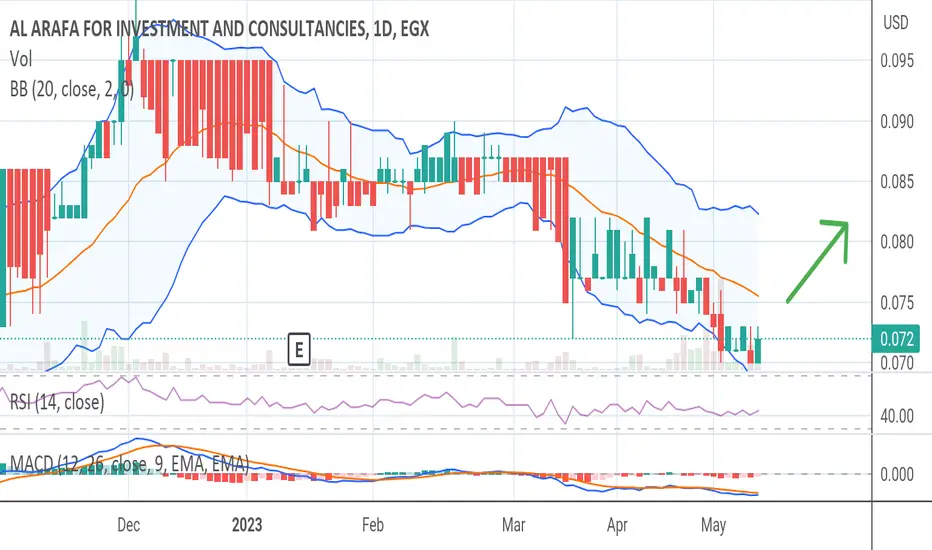
AIVC EGYPT, Ready to go up, longAIVC, on the daily chart is showing signs for takeoff. It is time to buy dips.
To target 0.09 soon

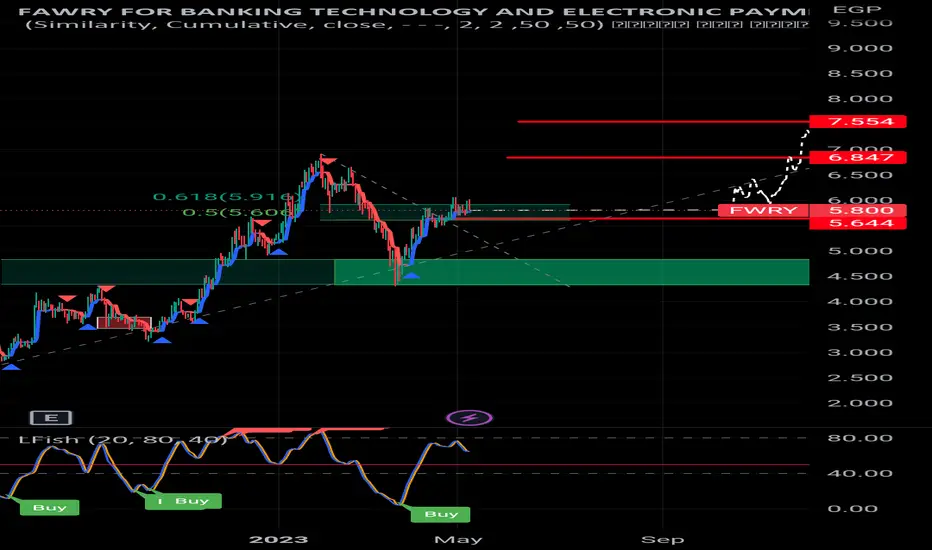
FWRYThe stock is still positive, and another entry point is the latency, two candles on the daily timeframe above 5.91. It will be another buying point, to target from the 6.85 region
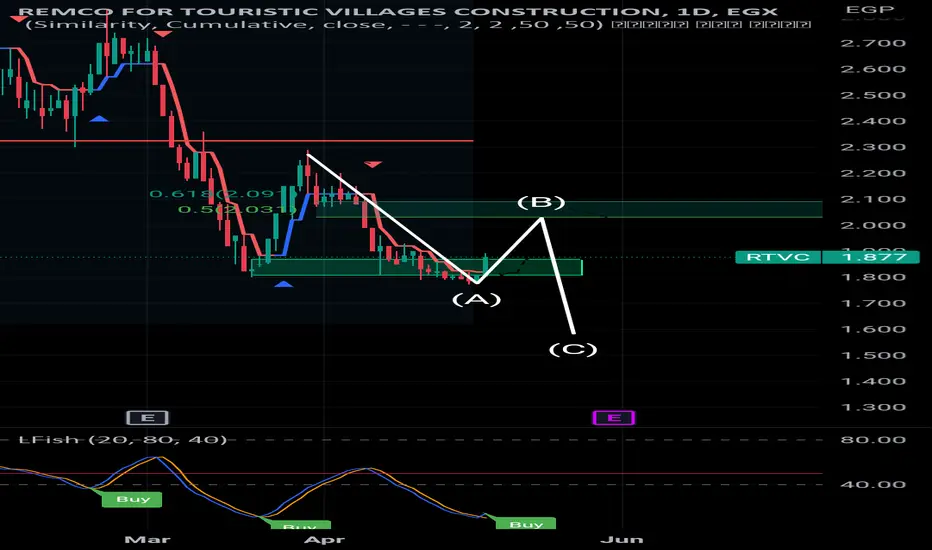
RTVC Remco gave a buy signal by building a base above 1.82A short target for 2 pounds, and in the event of a penetration of 2.10, there will be other targets
Head and shoulders Is it going all the way down or the weekly trend will push it to newest publish level !!

HELI EGX has potential for higher highsHELI is getting some minor correction in the weekly uptrend.
Higher good targets are foreseen within 4 - 6 weeks
10, 10.5, 11, ..

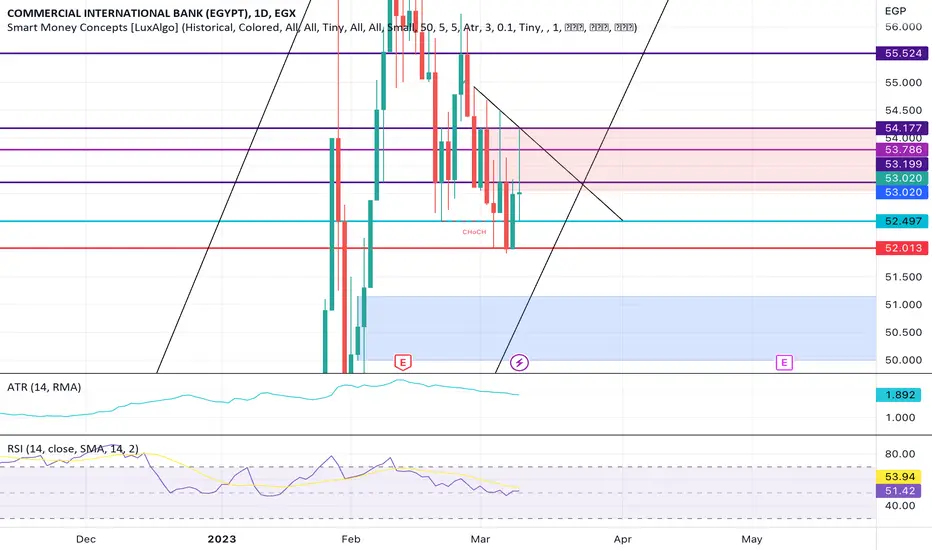
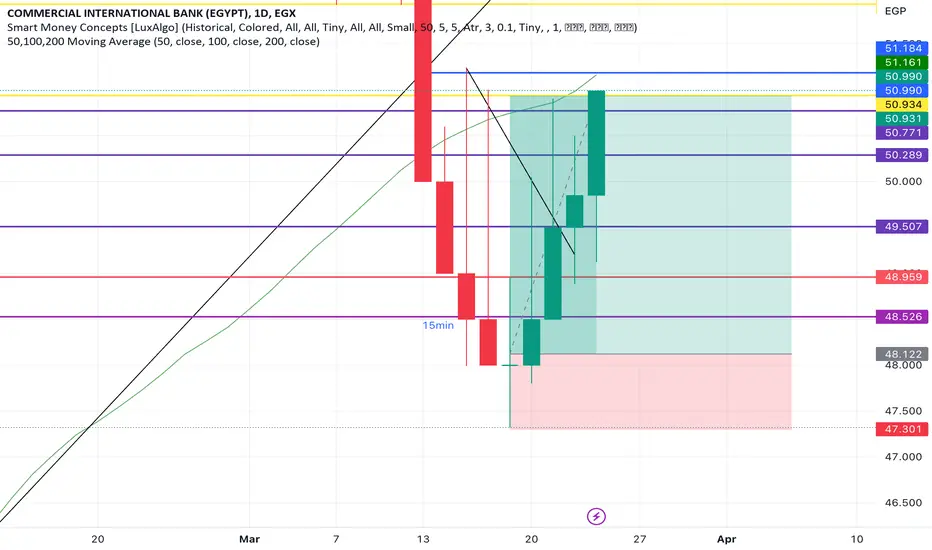
Why Enter ? COMIWhy did I enter a buy @ 49.13 and why did I put my stop loss @ 47.13
1. On day 19th march the session ended up forming a doji, which is a clear sign that indicates a possible reversal in the trend. The doji forms its own resistance and support areas , which is indicated by its tails. This takes us to the second point,
2. The tail of doji formed a strong support area @47.13, which is the area that brought the price to it real body, this is a clear sign that if it have fallen there again, and broke it then the support was not strong enough to hold the new positive trend.
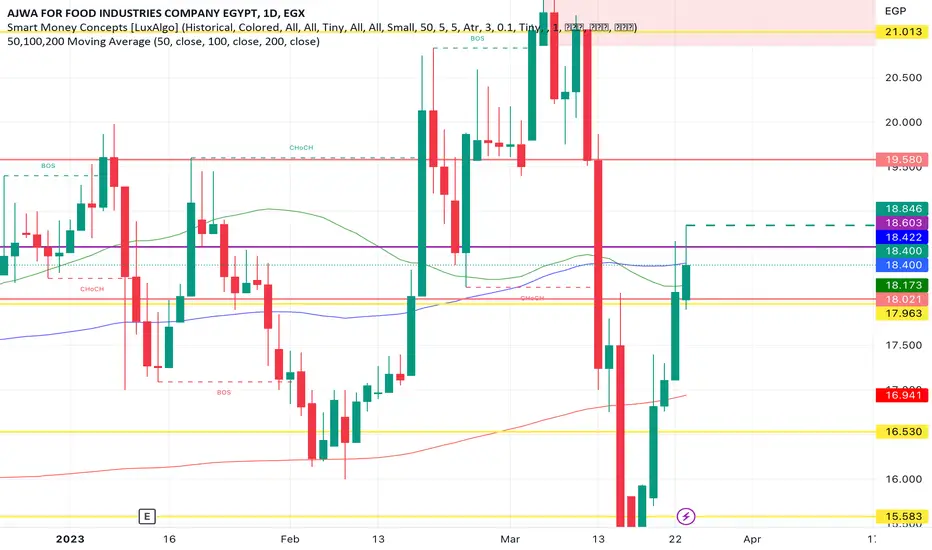
Bullish AJWAAs long as it is above 18.021, it will go up to next resistance @ 19.5-19.58.
If you look at previous dates, you will see that it has stabilized above 18.021 several times @ 19Feb23, and @ 24Nov22 and jumped to 20.21 and 19.66 respectively, this means that this area is a strong support zone and may scream Bullish. Days are shorter by an hour in ramadan so the daily jump may be cut, but is coming inshallah.
Would love to know what you think in the comments, and if you want to learn more about technical analysis and trends visit medium blog and subscribe, I will be posting there tutorials and real-world examples link in bio
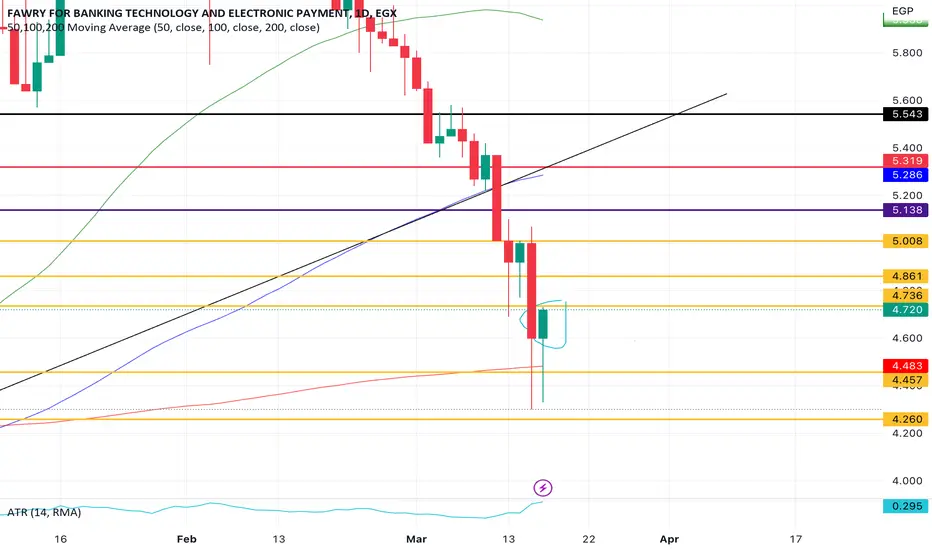
Weekly Analysis FWRYFWRY seems to be in the range part during the last 2 days, it needs to stay above 4.95 to be able to go to 5.138 then to 5.38
If you want to learn more about technical analysis and be able to analyse the market conditions, subscribe to my blog link in bio it has alot of tips and tricks about the market
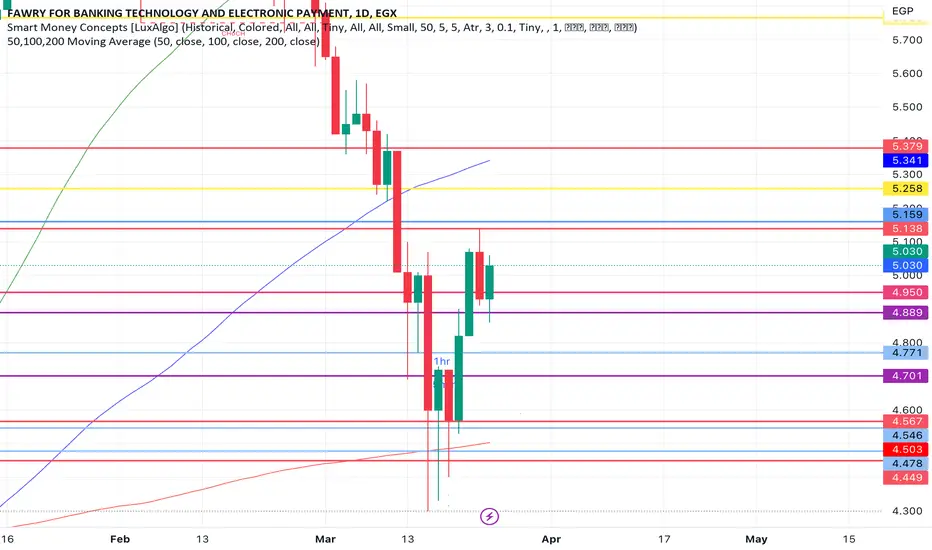
Bullish FWRYAs you have seen the last 2 days, buying power has the hold now . This can be concluded from the 2 engulfing patterns for the last 2D sessions.

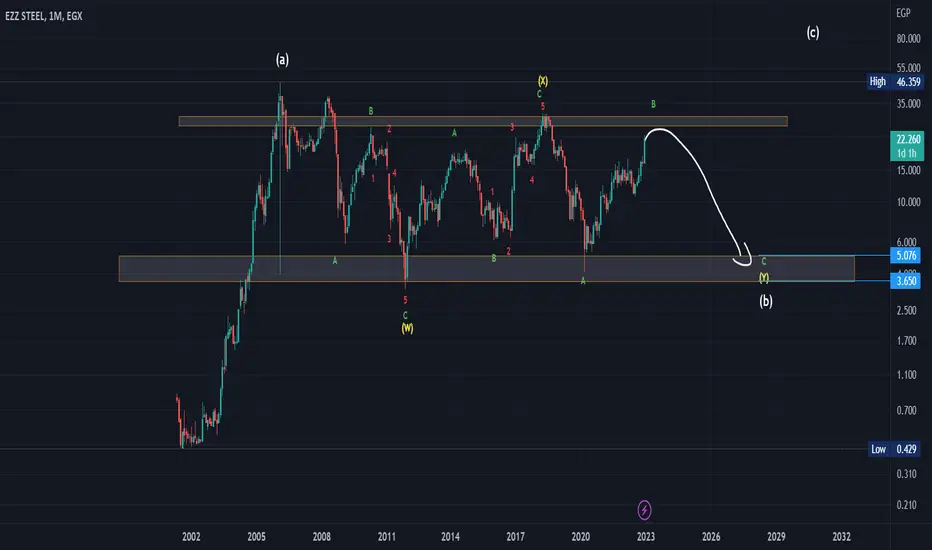
The full view ESRSEzz Fadel Steel has a small last rise before the large drop of the strong support area below, as shown in the shaded area, and this will be a large gathering area for a large annual rise later
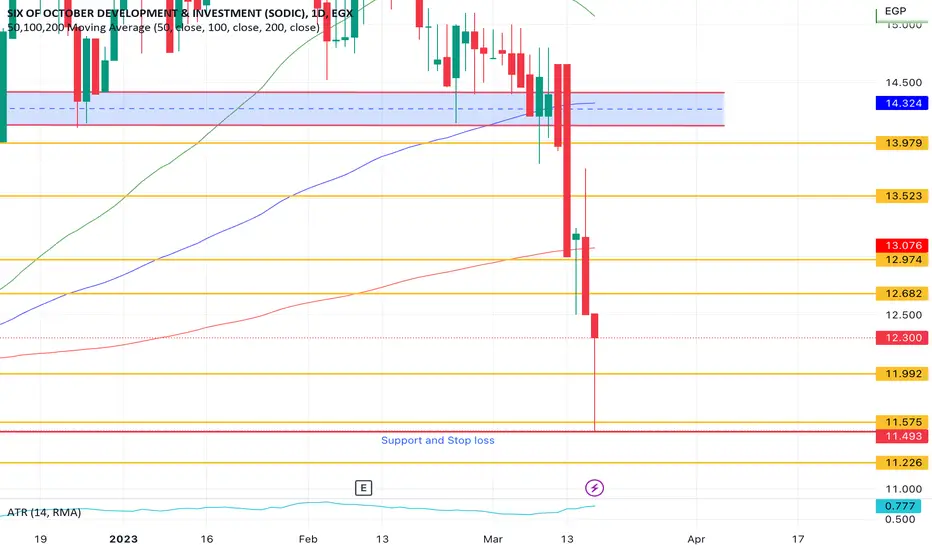
Possible Reversal OCDIOn the daily intervals it showed a doiji that formed which means that there is buying power that brought price up from support @ 11.493 to to 12.30, the market will start down then will possibly reverse and start increasing hopefully
this is not a trading advice nor a financial one , would love to know what you think
Possible Recovery FWRYThis has been a rough week, but their is hope next week to see a possible recovery in the market. The market dojii candle means that buying power is back and may introduce a reversal pattern in the new couple days. Next week will be risky.
Possible Bullish (COMI) This is not a financial advice only an analysis
COMI is an uptrend as shown in the graph, and after 2 weeks of dropping in price a doji has appeared which may suggest a possible reversal in chart, as well as the CHOCH that you can see