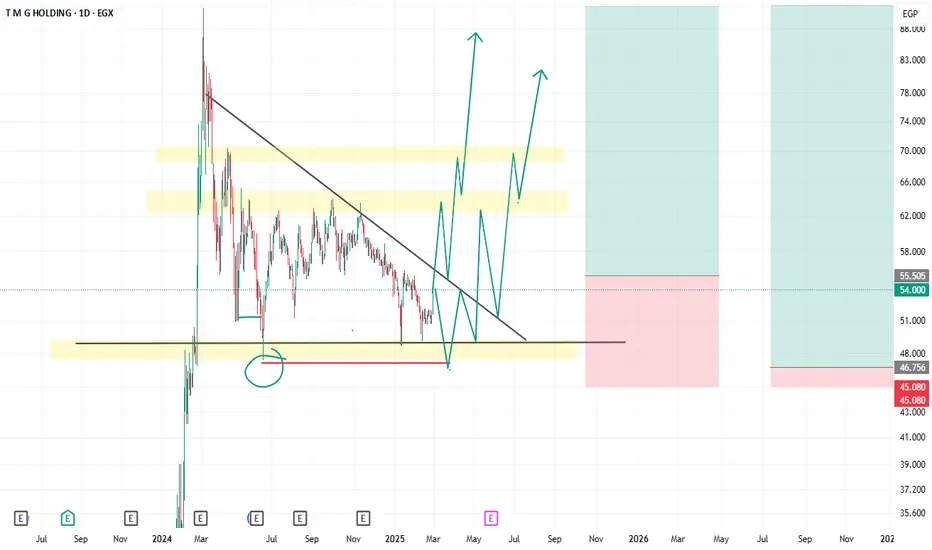
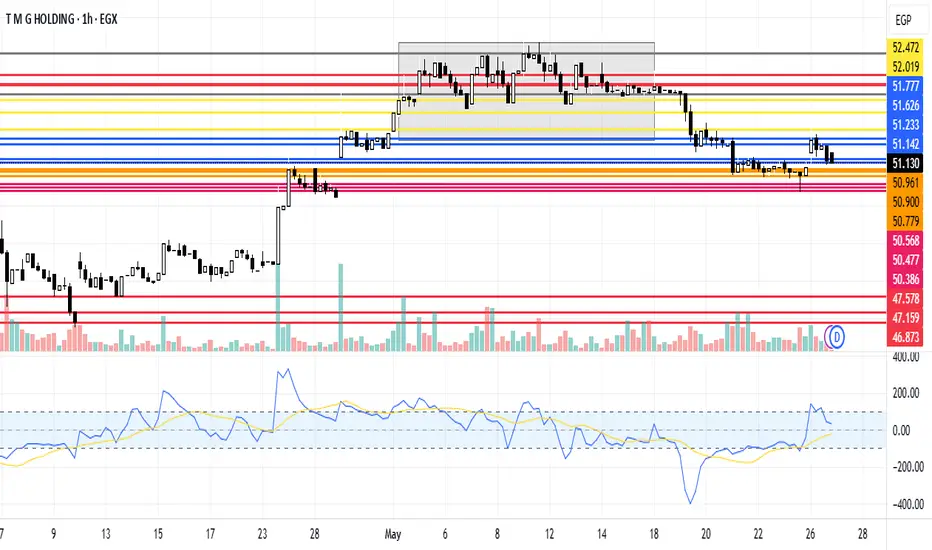
TMG Long UpdateHey everyone,
The chart shows bullish flag and held strong support at 47-48 price level. One thing that worries me is the liquidity below 47.5 (in green circle), because the price always makes big moves after a liquidity sweep, which in this case didn't happen yet.
So i expect one of two scenarios that might happen, either the price will go briefly below 47 to sweep the liquidity, create a wick and move to the upside from here or the price will just breaks the trend line, retraces and then continue upwards.
so my advice (do your own research before you take any position) is to DCA into position, meaning, every time the stock drops 1 Egp, buy and increase your buying power, every time the price goes lower (example, buy 1 share at 54, 2 shares at 53, 3 shares at 52 and so on), and for all your buying positions have a stoploss at 45 EGP.
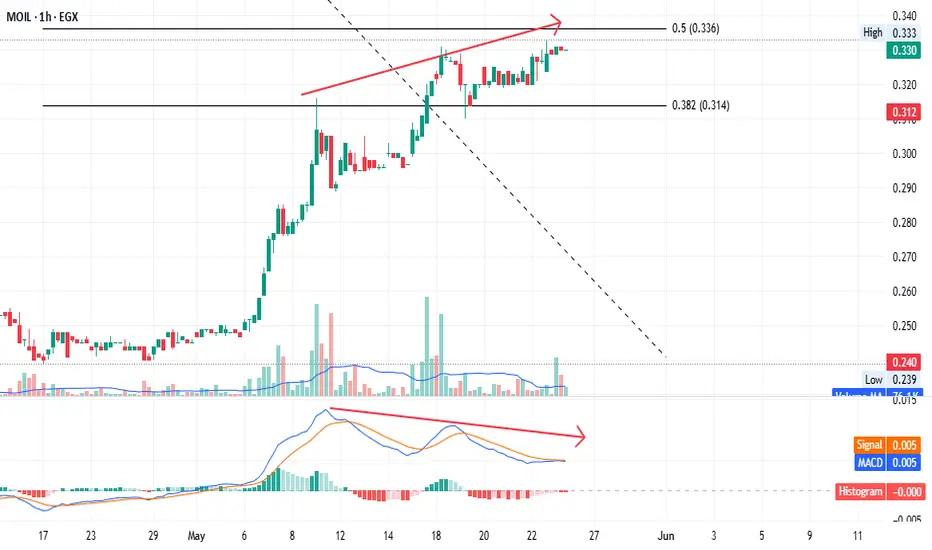
#MOIL - Be cautiousBe cautious: MACD disagrees with recent price highs. While the price action suggests a rise, the MACD is forming a lower high than its previous peak, signaling potential weakness in the upward momentum.
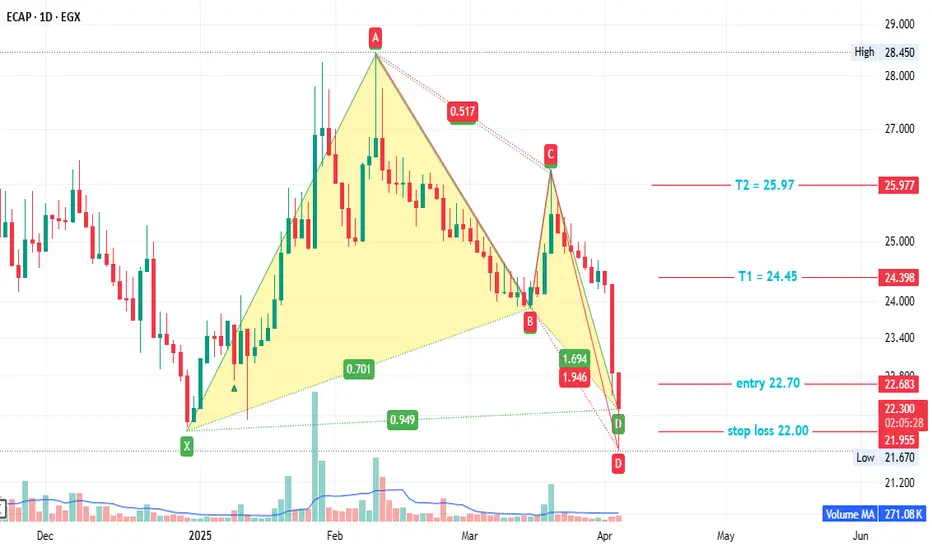
ECAP - Egyptian stock#ECAP timeframe 1 DAY
created 2 Bullish pattern ( Gartley and AB=CD ) , so we can see action price in this point .
Entry level at 22.70 ( price now 22.40 )
Stop loss 22.00( loss may go to up -3% )
First target at 24.45( with profit around 7.60% )
Second target 25.97( with profit around 14.70% )
NOTE : this data according to time frame I DAY ,
Its not an advice for investing only my vision according to the data on chart
Please consult your account manager before investing
Thanks and good luck
#COMI - ACTION IN THE WAY - all market will rising soon or ??!!EGX:COMI is showing a potential triangle pattern.
BB support is at 79.15, making it a good entry point for a long position.
Prices are currently trading below the middle BB line (80.16), which has acted as resistance since the start of the month.
As long as prices stay above 78.60, they are likely to reach 83.20 eventually.
At June market may go to moon , just remember who told you first .
But still be caution more than optimistic or hopeful
At this point market may achieve new historical levels from anther hand EGX30 tray many times to close over 32200 but is failed.
No one is bigger than the market and remember Technical analysis is not an accurate science .
This is not financial advice, just our analysis based on chart data. Please consult your account manager before investing.
Thanks and good luck!

TMGH's New PeakTMG Holding trend is reaching a new peak zone at the resistance line 56.884. Historically, it is expected to rebound to the support line at 56.324, then the support line 55.2 and finally 55.165. In conclusion, it increased by 0.09%.

SWDY Double Bottom AnalysisSWDY stock has rebounded back from the resistance line of 81.97, to reach the support line at 81.163. It shows that the double bottom wasn't a true sign to encourage a bullish reversal pattern.

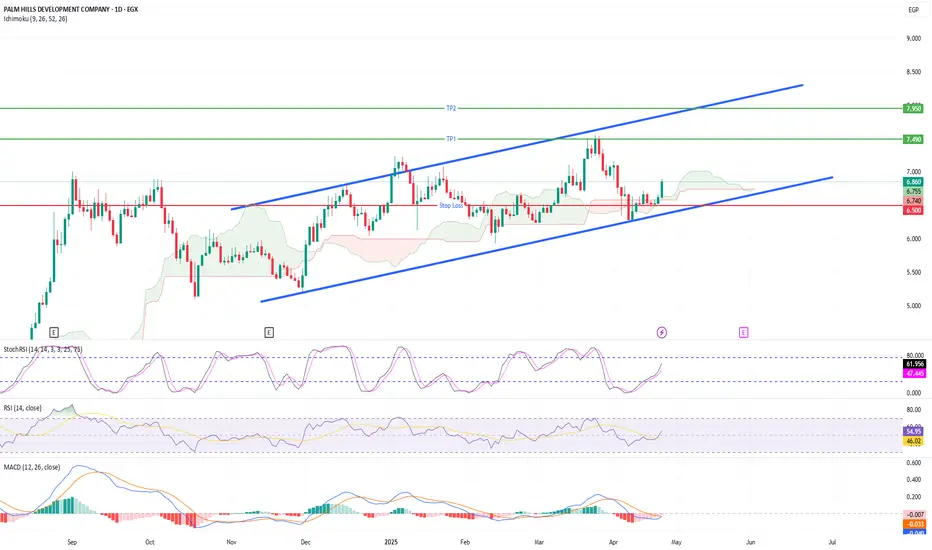
PHDC Loading for a Massive Breakout – Hidden Bull Flag Inside!Palm Hills (PHDC) is gearing up for a powerful move! 📈
After months of respecting a clean ascending channel, price just bounced perfectly off lower support.
📊 Indicators flashing green:
StochRSI bullish cross ✅
MACD turning positive ✅
Squeeze Momentum showing early pressure build-up ✅
I’m buying between 6.70–6.85 EGP with a tight stop at 6.50 EGP.
🎯 Targets:
TP1: 7.50 EGP
TP2: 8.00–8.20 EGP
A clean breakout above 7.00 EGP could trigger explosive upside. Watch closely! 🚀
(DYOR – Not financial advice)
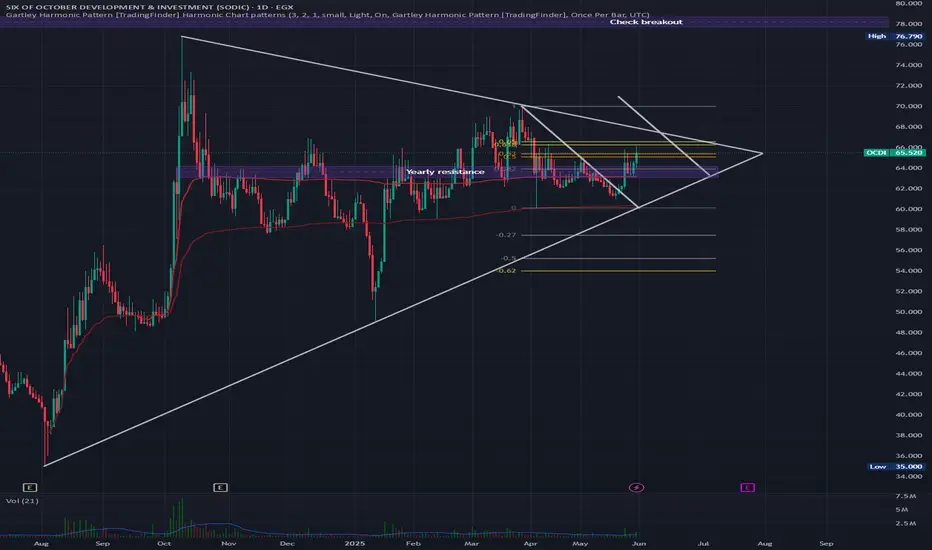
OCDI is at yearly resistance. OCDI is at yearly resistance. Buy if it breaks above the Fibonacci level and trendline.
SWDY's New Upward Region Waiting for Chart Pattern ConfirmationSWDY stock is still trying to peak up, but unfortunately, it's rebounding back from the resistance line of 82.662. It had already broken the support line 81.970. In case of continuing, it'll break the support line 81.849 till reaching the support line 81.759. In case of rising, it'll breach the 1st resistance line to the 2nd resistance line at 82.933 points and the 3rd resistance line at 83.097. In general, it's expected to rise, especially for the presence of a double bottom, which will lead to a bullish reversal pattern and orient a new upward region, but the chart pattern confirmation is still in progress.

TMGH's Current Peak ZoneTMG Holding trend has reached its peak zone at the resistance line 55.661. Historically, it is expected to rebound to the support line at 55.2, then the support line at 54.987 and 54.916. In conclusion, it increased by 0.09% due to TMGH signing a memorandum of understanding to develop a new large-scale mixed-use project on a 14 million sqm plot, as part of its regional expansion strategy focused on replicating its integrated city model in Middle Eastern markets, as per a disclosure, regarding negotiations with local Iraqi authorities, is expected to include approximately 46,000 mixed-use units. It will focus on high-quality housing, smart infrastructure, and sustainability.

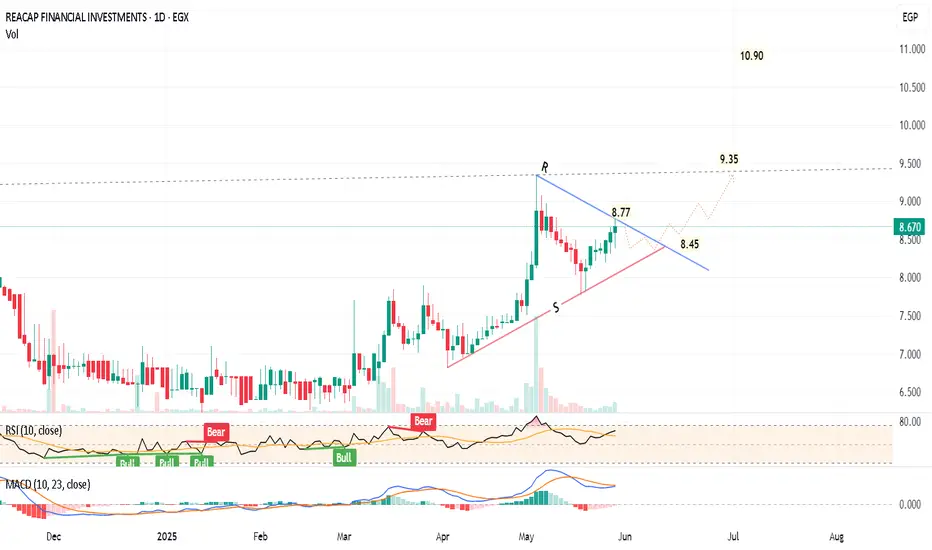
Recap Egypt has bullish indicatorsDaily chart,
I expect the price EGX:REAC will continue to form a triangle chart pattern.
Technical indicators RSI and MACD are positive, and showing a bullish movement - i.e. A soon breakout
However, I think after a rally of 7 consecutive green candlesticks, a minor correction should happen to test the support line S.
Then, a rebound to test the upper resistance line R. The breakout can be around 8.50 - 5.45
After crossing R (and stabilizing for 2 days with high volume), the target will be 10.90 passing through a resistance level at 9.35
Stop loss below 8.40 should be considered.
2nd Scenario : Direct crossing up, no correction, and the target will be 11.25
Raise the stop loss / profit protection level as the price goes up.
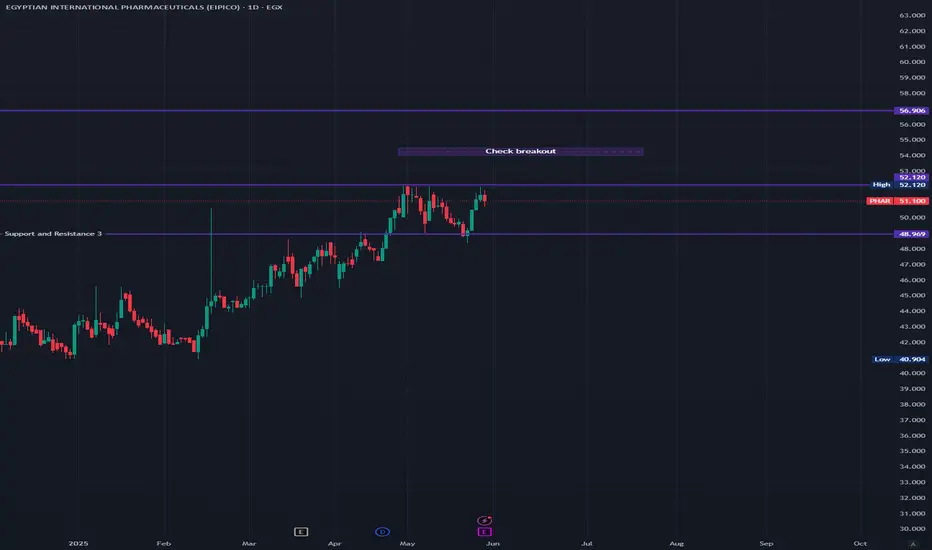
PHAR will break through the strong resistance at 52.1PHAR will break through the strong resistance at 52.1. It will then immediately target 54, with a final target of 56.9.
#ALCN - not an advise it just an ideaaccording to chart we have triangle pattern and potential bearish pattern,
Now is testing the uber line of triangle pattern
so stop loss now is 22.22
target and next sell point is 23.50 to 23.65
rebuy at 23.89
It's not advice for investing, only my vision according to the data on the chart.
Please consult your account manager before investing.
Thanks and good luck.

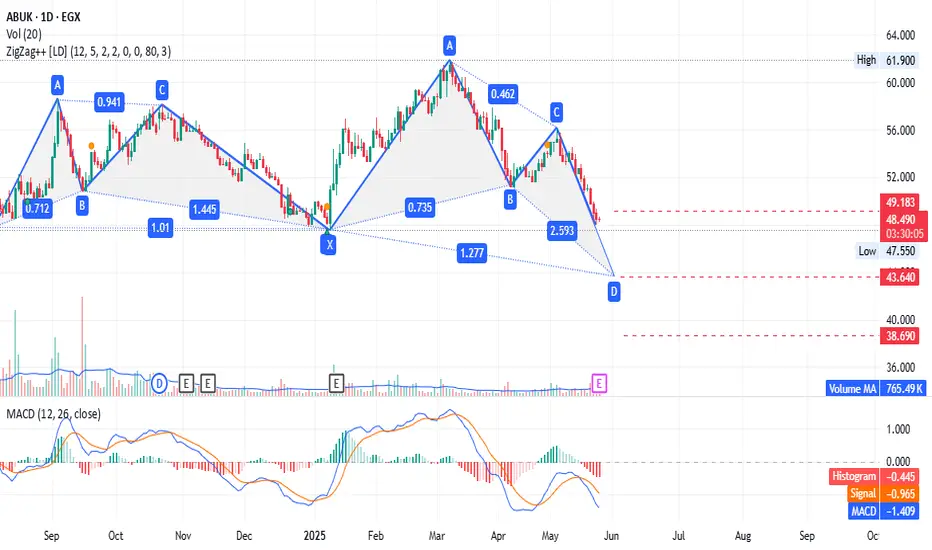
#ABUK - very confusing / where is the bottom ??!!!!3 levels prices may respect it :
first : 49.18
secund : 43.64 ( may be )
third : 38.69 ( really, no one bigger than market )
i am waiting for any positive sign at any level, now MACD is negative on daily basis .
any way consider stop loss to save your capital
good luck
TMGH Rebound ExpctationTMG Holding trend has reached its downward zone at the support line 51.142. In case of a rise, it is expected to breach the resistance line 51.233 and reach the resistance line at 51.625 points, then reach the third resistance line at 51.777 points. This upward direction is expected due to TMGH signs MoU For Development of New Large-Scale Mixed-Use Project In Iraq, which is expected to generate total sales of $17 Billion, and income of $1.5 Billion per annum upon project completion. In case of falling, it's expected to break the 1st support line at 50.961 points, then the second support line at 50.900, then the third line at 50.779.
SWDY Future ReboundSWDY stock is trying to peak up, but unfortunately, it's rebounding back from the resistance line 80.081. It had already broken the support line 78.989. In case of continuing, it'll break the support line 78.928 till reaching the support line 78.868. In case of rising, it'll breach the 1st resistance line at 79.199, the 2nd resistance line at 79.320, and the 3rd resistance line at 79.470, which is more recommended due to its Q1 Profit Rise, which achieved EGP 4.15 Billion versus EGP 3.98 Billion a year ago beside its Q1 revenue EGP 59.39 Billion versus EGP 45.25 Billion a year ago.

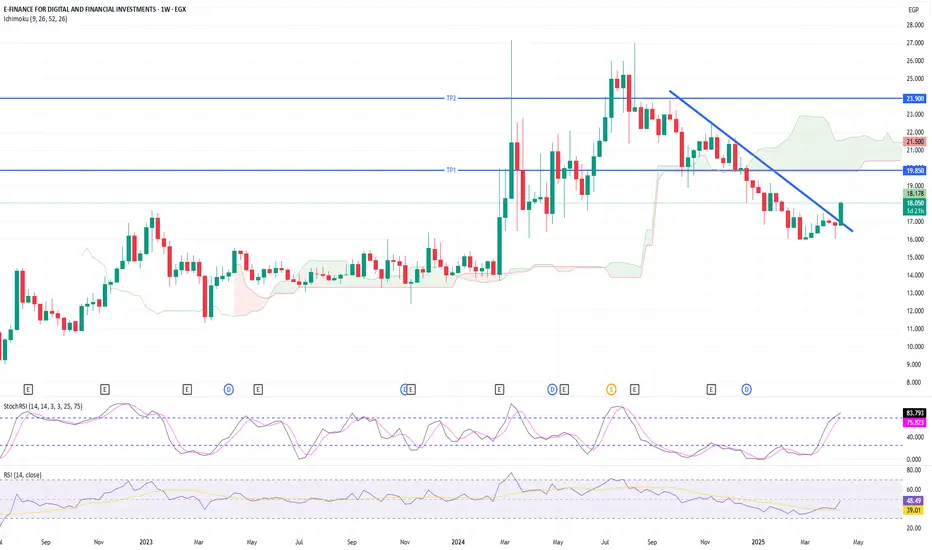
E-Finance Breakout: Trendline Breach Signals Fresh Upside PotentE-Finance (EGX) has just broken out of a descending trendline on the weekly chart, supported by momentum indicators turning bullish. The Ichimoku cloud shows that the price is attempting to re-enter bullish territory. With the MACD turning positive and the Squeeze Momentum shifting green, this breakout may be the start of a medium-term rally.
📌 Trade Plan
📥 Entry Zone: Between 17.50 – 18.25 EGP (current price or on a slight dip)
🎯 Take Profit Targets:
TP1: 19.85 EGP (upper Ichimoku cloud resistance)
TP2: 24.00 EGP (previous support-turned-resistance zone)
🛑 Stop Loss: Below 16.50 EGP (under recent swing low & trendline)
⏱️ Time Horizon: Medium-term (4–8 weeks)
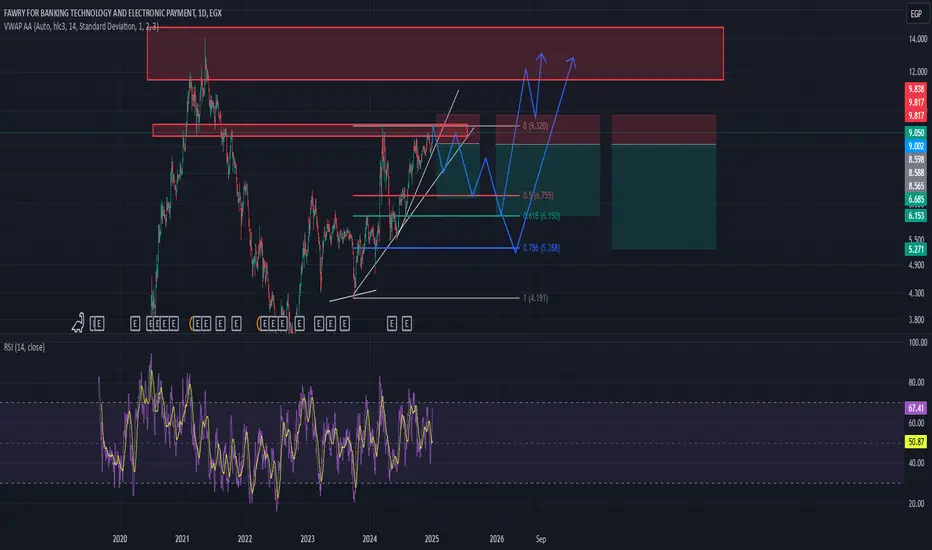
Fawry short position I love Fawry stock since it has been doing well during bad times in the Egyptian market. Its really an undervalued stock that i expect it to do exceptionally well in the future. However, based on the chart (for short term) for this stock to really takes off, it need to correct, grap liquidity and to the moon from there. So i think, realistically, its has to go down in the short term to later face the its ath resistance.
so i have checked the possible scenarios for the short positions and hopefully iam right. As for now this is only TA, and i havent checked the fundamentals so iam not really sure.
for anyone who is willing to take this trade, please, check the fundamentals , and the economic conditions. always DYOR.
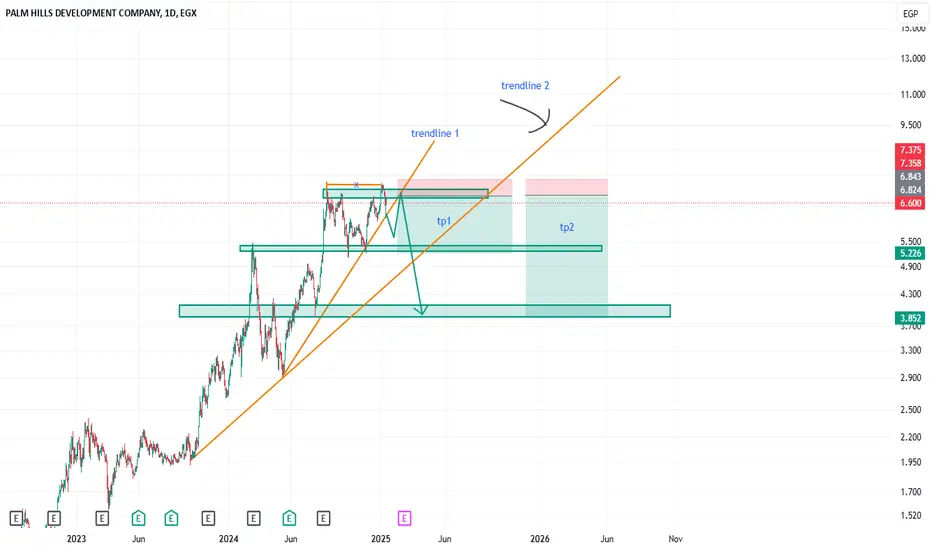
PHDC Short LOL, have you heard about the latest offers from Palm Hills Developments? They’ve launched a massive advertising campaign, offering apartments and villas with only a 1–3% down payment for properties that usually cost anywhere between 7 and 19 million EGP. Then, they’re allowing customers to pay very low monthly installments over 10 to 12 years. And guess what? This offer is only valid for 30 days.
Doesn’t seem logical, right?
Guess what else is happening in 39 days? The company’s earnings report—LOL. This is how such companies and “whales” manipulate the market.
According to the chart, the stock is extremely overbought, and it also appears that investors are unwilling to pay higher prices. The company notices this decline in investor interest and, anticipating a negative earnings report, they try to boost their earnings (to produce a higher-than-expected report) so investor interest spikes back up and the stock price doesn’t start trending down.
Spotting this sort of market manipulation should raise all sorts of red flags, which strengthens my idea of shorting this stock.
When it comes to technical analysis, the stock is overbought, and I think there’s a good chance for a correction. I would also expect other market participants to notice the manipulation and potentially short the stock as well.
If the first trendline breaks, wait for a retracement, then make an entry and set TP (take profit) at TP1. Move your stop-loss to breakeven. If it breaks the second trendline, then target TP2 and close the trade if the price reaches TP2.
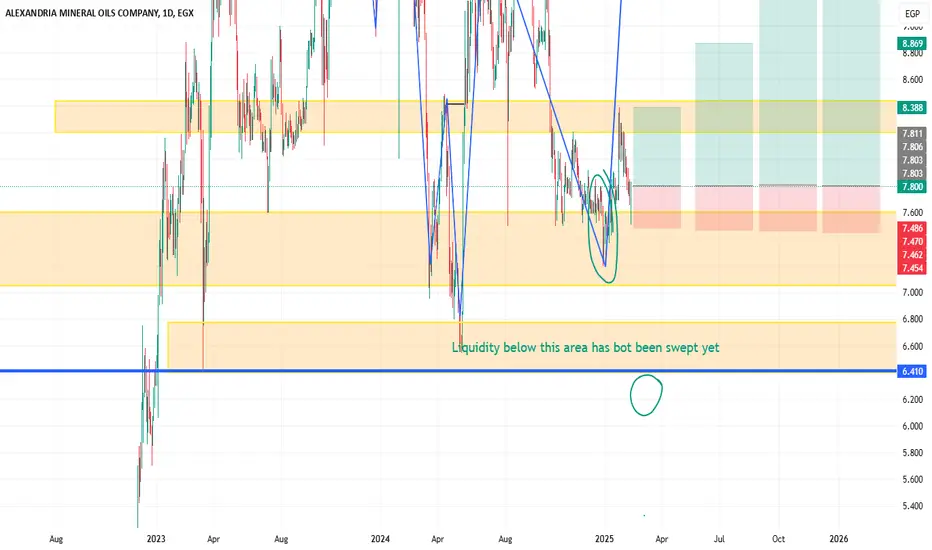
AMOC long update The stock was in a strong downtrend, but it seems to be reversing to the upside.
On the bright side, or the bullish side, the price has started making higher highs and higher lows, which could be a good sign if we consider this recent downtrend a pullback within a larger uptrend.
On the bearish side, this is a very risky trade, as bears could put pressure on the price and drive it lower to sweep the liquidity below 6.4 EGP. Also, I haven't been following the news lately, but it seems there was some negative news that drove most Egyptian stocks lower. I’m not exactly sure what the news was or how long its impact will last.
To sum it up, if you have the patience, wait for the stock to reach 6.1 to 6.3 EGP before going long. Otherwise, you can enter long now, but keep your stop-loss tight, as identified.
DYOR and read the news to understand what caused the stock market to decline and what the expectations are for the general financial situation in the coming period.