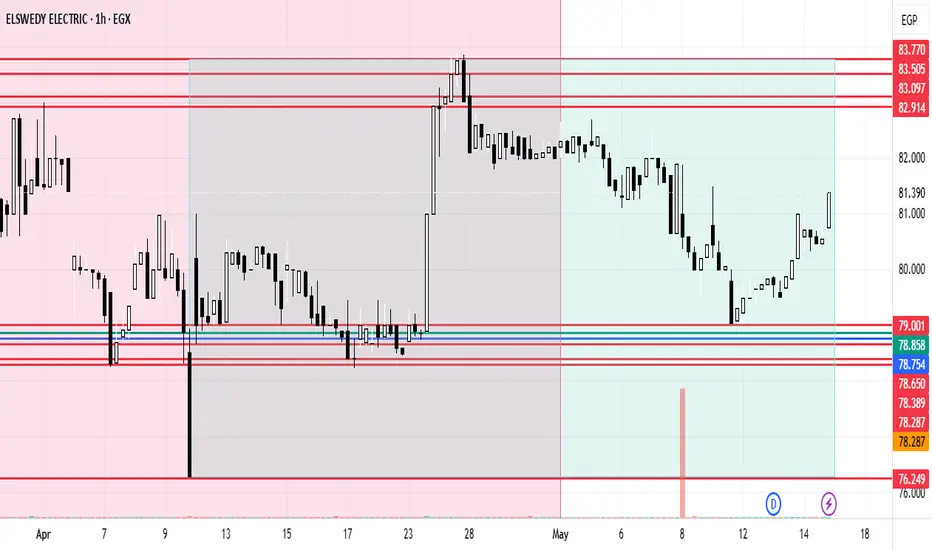
SWDY Chart AnalysisEl Sewedy Electric stock trend rose last period from the support line 76.249 to the resistance line 83.77, then rebounded to reach the support line 79.001, so the general trend was down by 1.04%. The stock rose and broke the first support line at 78.287, to get the second support line at 78.389, then the third support line at 78.650. On the other hand, when the stock rebounded, it broke the first resistance line at 83.505 to reach the second resistance line at 83.097, then the third resistance line at 82.914. This upward trend is due to the acquisition of the majority of the stake in Thomassen Service, which is 60%. This step unlocks expansion into Europe, the Middle East, and Africa.
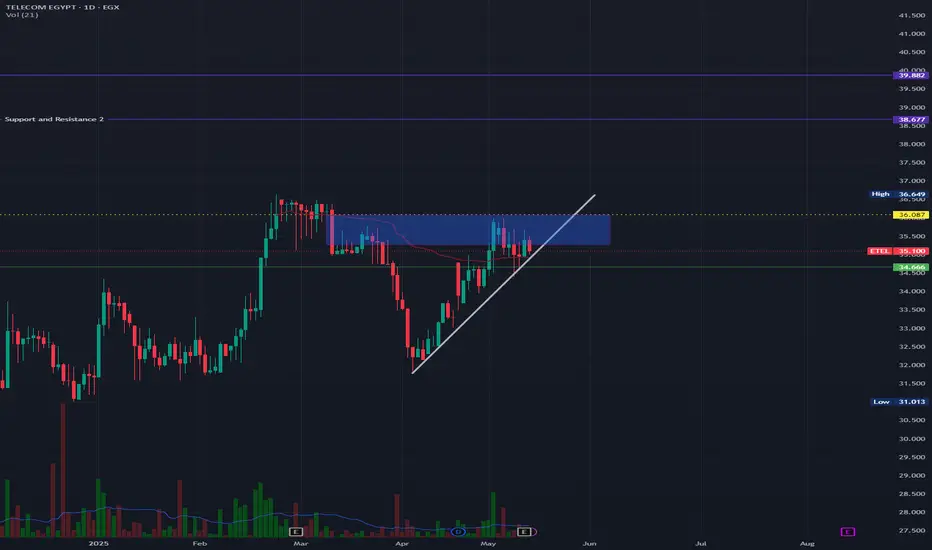
ETEL is a buy in the medium term. ETEL is a buy in the medium term. First quarter earnings are strong.
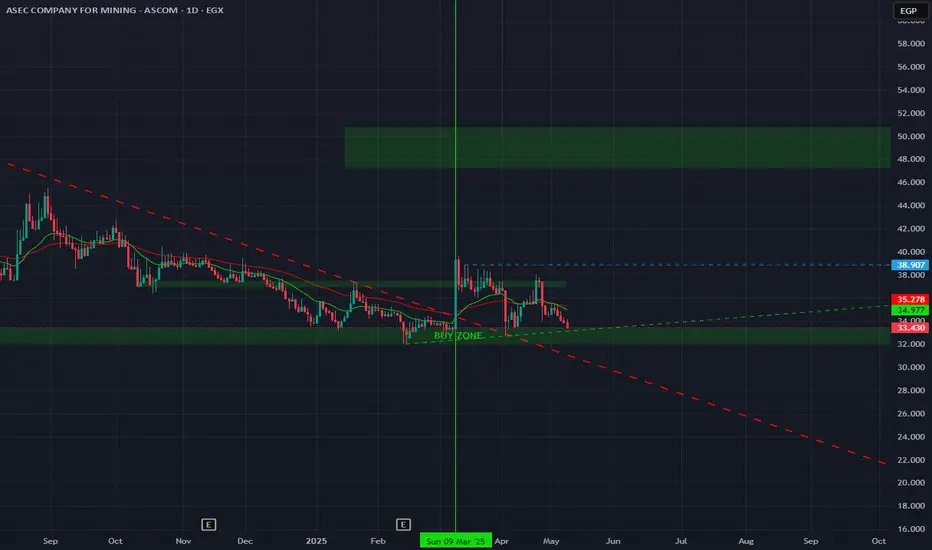
Buy when it breaks the order block channel at 36 points. A break of the upper trend line signals a short-term negative outlook.
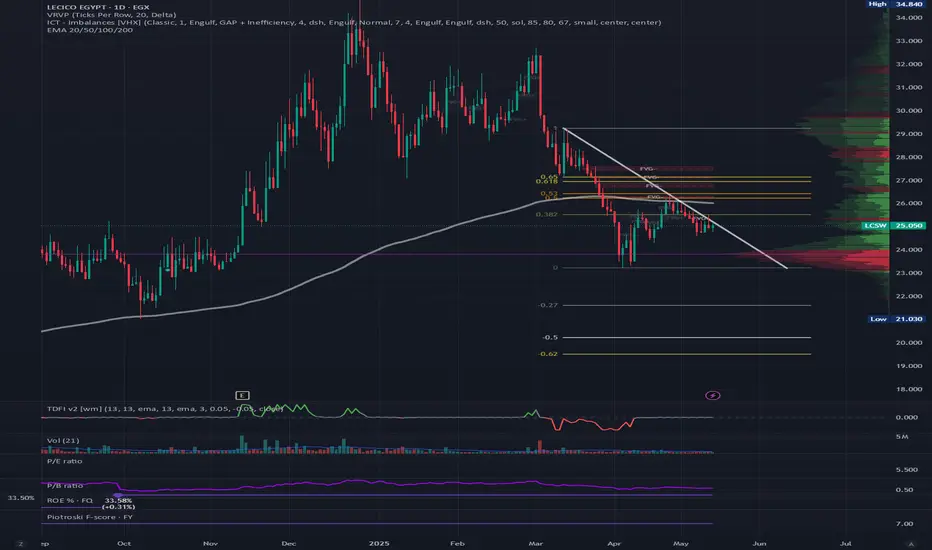
LCSW is still in down trend on the short term,LCSW is in a downtrend. It must break the downtrend line with strong volume, surpass the 200 EMA, and exceed the $26.32 Fibonacci level for a buy signal. Confirm this signal by also surpassing the $26.92 Fibonacci level.
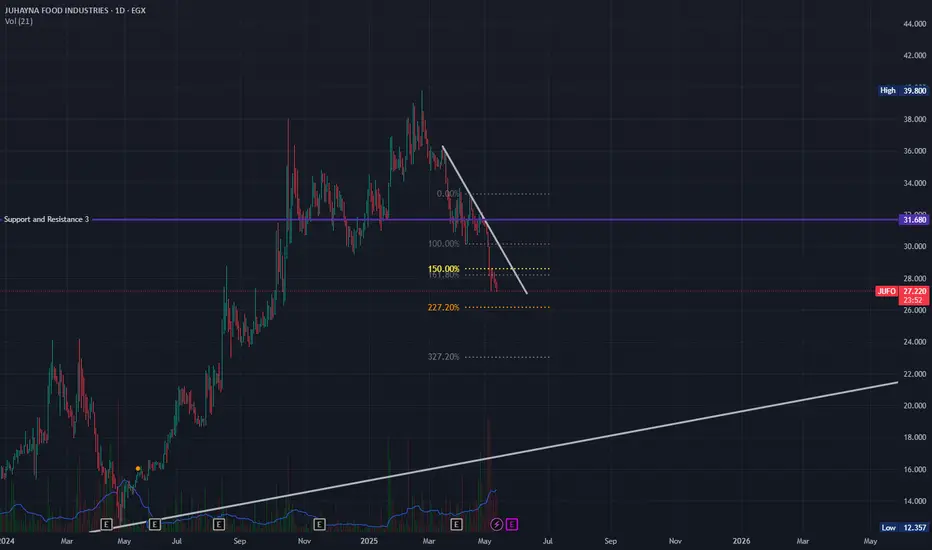
JUFO will decline in the medium term due to the dividend halt.JUFO will decline in the medium term due to the dividend halt. Expect a drop to 26.2, then to 23, with a yearly trend line at 18. No improvement is expected until the downgrade trend line breaks and the price exceeds 31.6.
Macro Group Egypt is expected to target 2.70 then 2.92Daily chart,
the stock EGX:MCRO price is drawing a rising channel pattern.
I expect the price will break out the resistance line R1; to target the line R2, then the line R3 at around 2.92
Some intermediate resistance levels are shown on the chart.
A new entry (buy) should be made after closing above 2.30
Stop loss below 2.20
Technical indicators:
RSI has a bullish trend line
MACD is positive

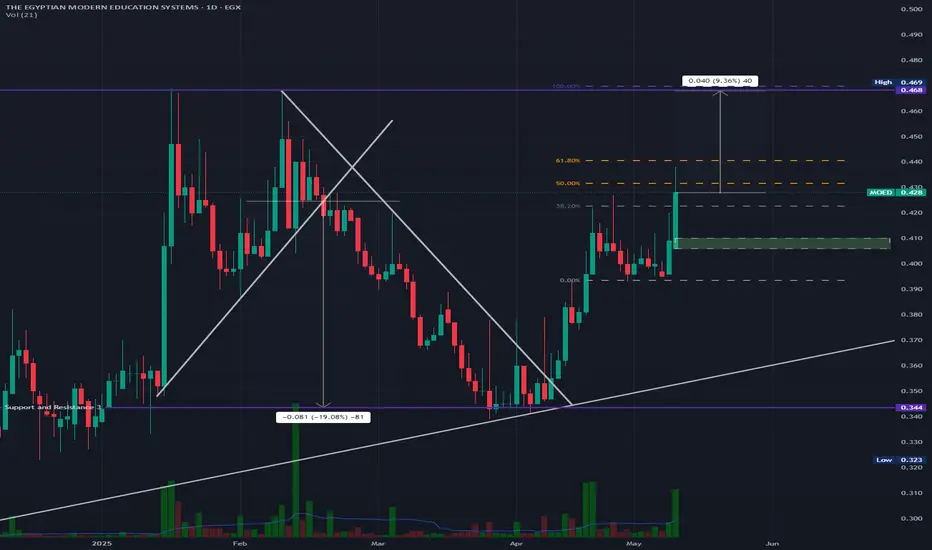
MOED broke a downtrend and aims for 0.468.MOED broke a downtrend and aims for 0.468. A price gap at 0.406 might close first. Strong volume suggests a 9% rise is likely.
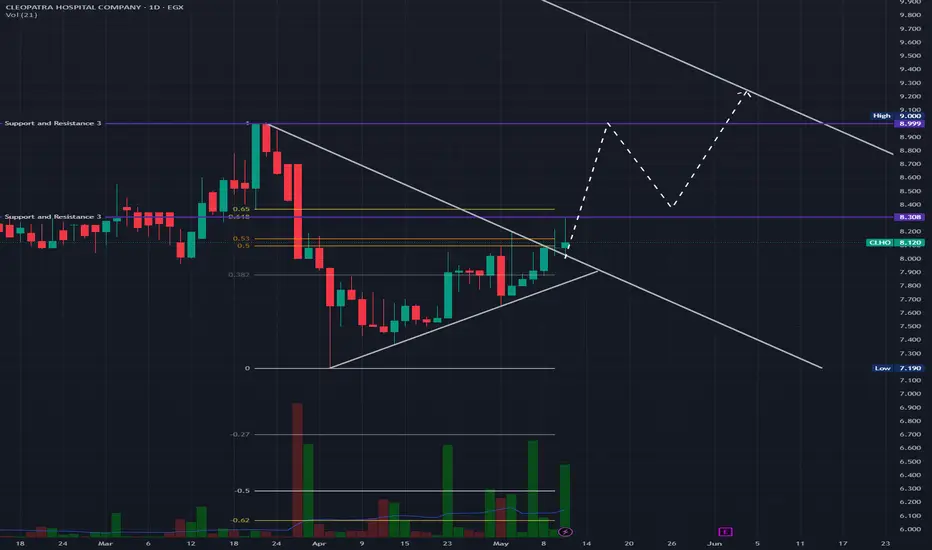
CLHO break a harmonic pattern.A breach of the established harmonic pattern by CLHO will be confirmed upon surpassing Fibonacci level 8.3. Subsequently, a clear trajectory towards the preceding high at level 9 is anticipated. A retest of Fibonacci level 8.3 may then occur prior to a potential breach of the harmonic pattern target. A bullish trend is expected in the short term. Should level 9 be exceeded, a bullish trend is projected for the medium term.
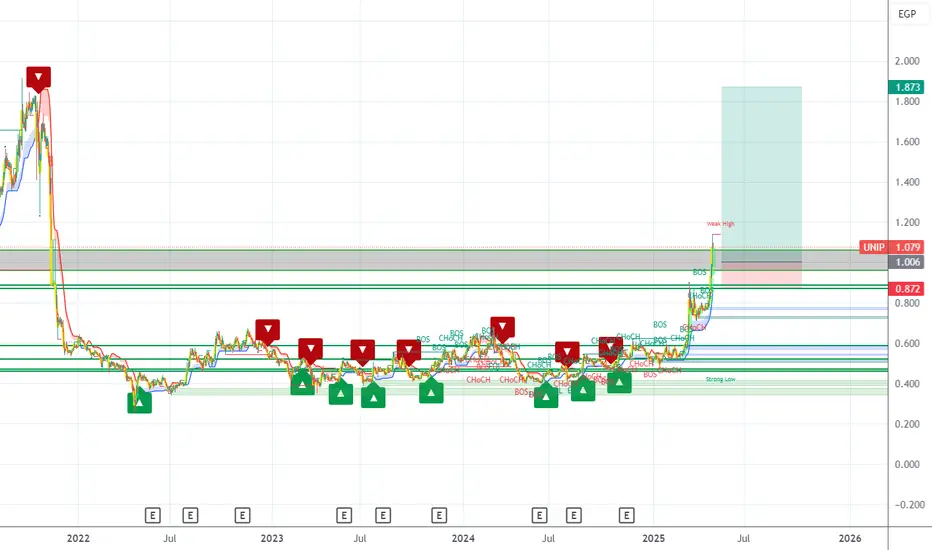
UpTrend after channelling 3 years Hello Traders,
i was checking out this company for the last 3 month and i didn't realise the amount of the volume and the trades made on it in one week its huge, I see its still have a lot to gain,last time we broke the channel we test 1.5 and then 1.8 which still very safe to play 80p on each stock very fair play i will keep an eye for the correction I'm not chasing it up now i will see how the wave reacts next week
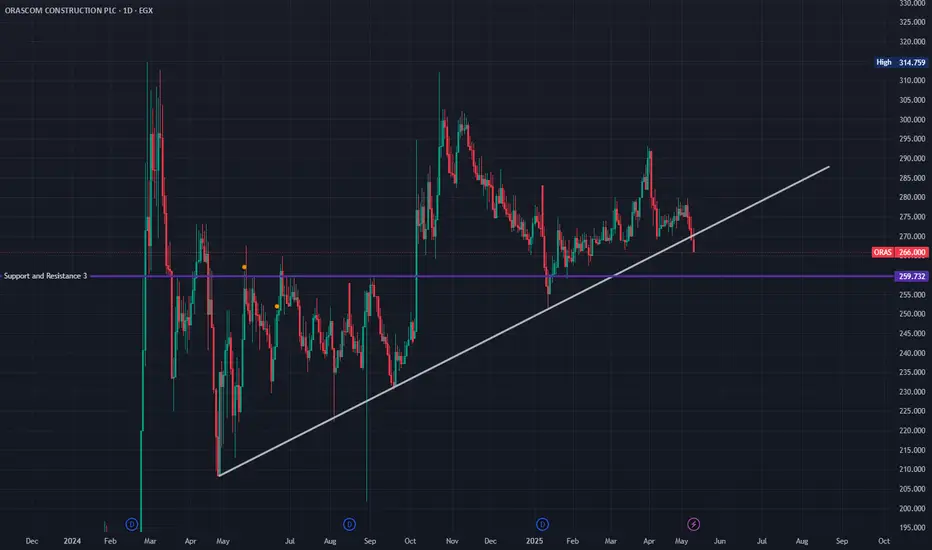
ORAS broke a long-term trend lineORAS broke a long-term trend line that had been in place since May 2024 with strong volume. Our next resistance is a significant one at 259.7. Expect the price to bounce off this resistance.
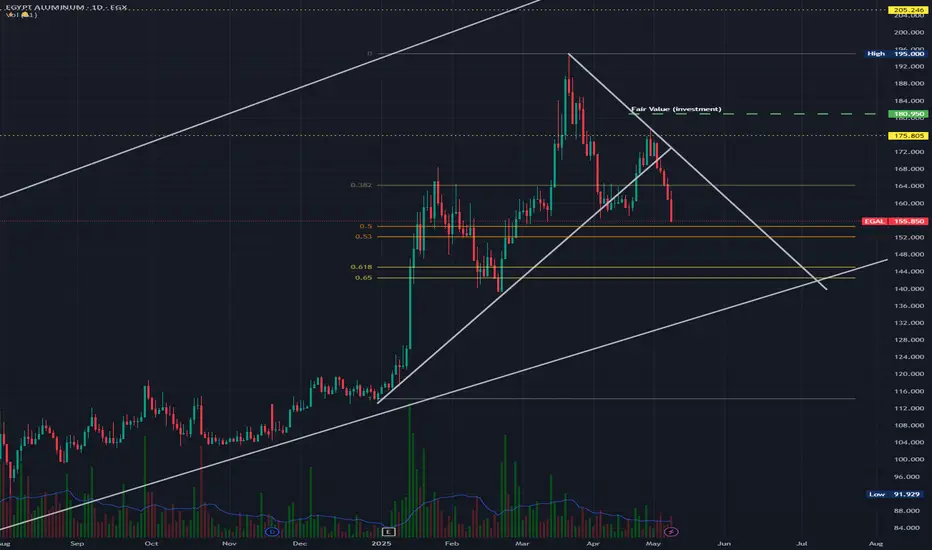
EGAL testing FIB levels with strong selling volume.EGAL testing FIB levels with strong selling volume.
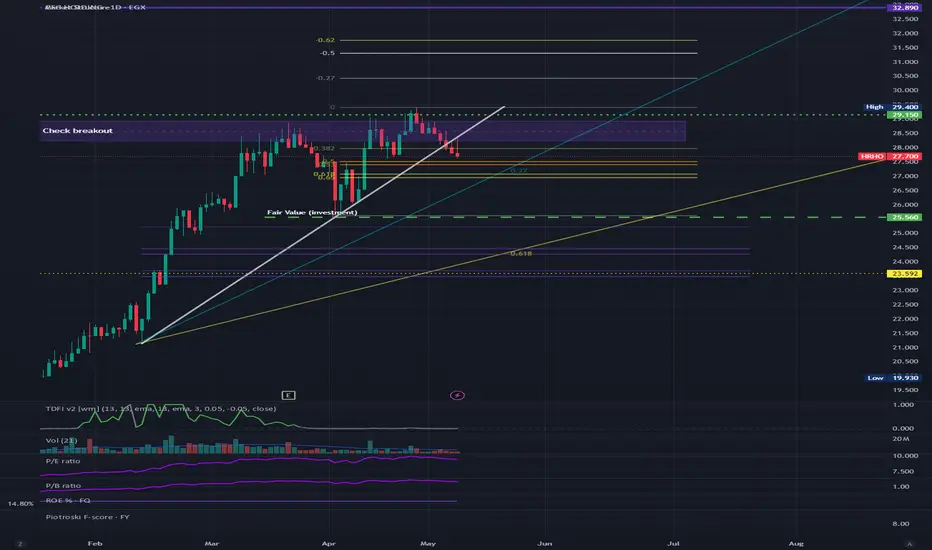
EFG broke its trend line.EFG broke its trend line. Expect a correction to 27, possibly to 24.4 if it passes 27 with strong volume.
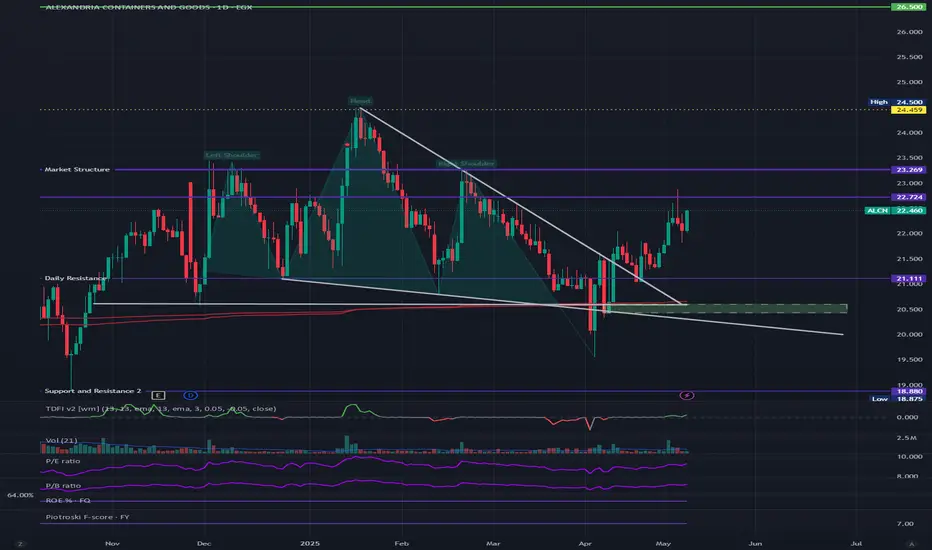
ALCN broke below the trendline after a head and shoulders patterALCN broke below the trendline after a head and shoulders pattern. Expect it to test resistance at 22.7, then 23.2, and finally 24.4.
EPCO hit the target. EPCO hit the target. It will likely test the key FIB level, close two gaps, then rise to test the new trend line.

TMGH Rising Trend AnalysisTMG Holding trend is still in progress in its upward trend between the support line 53.823 and the resistance line 52.573, up by 0.19%. It is expected to keep rising till breaking the 1st resistance line at 53.6115 and then the 2nd one at 53.719 points because of positive news about the announcement of SothMed's second phase launch of on Mediterranean, which generated EGP 70 Billion sales.

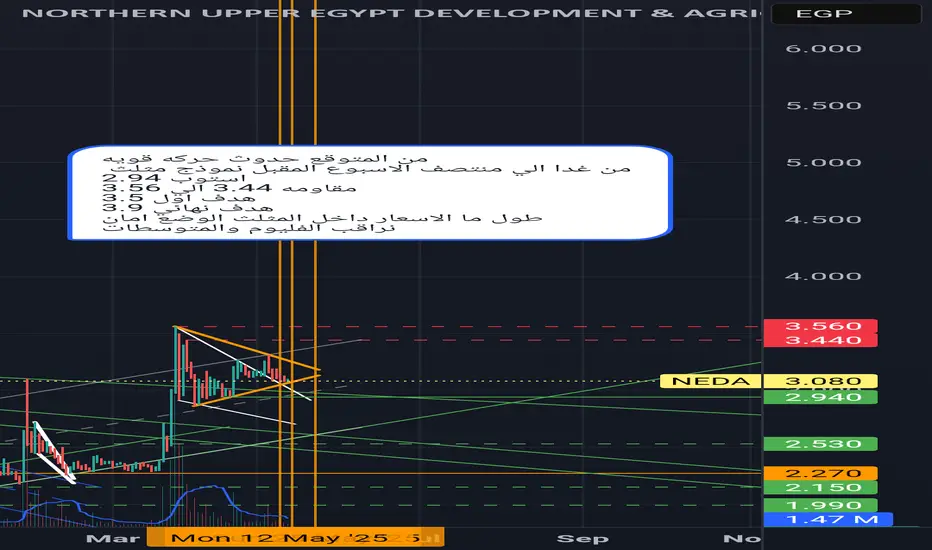
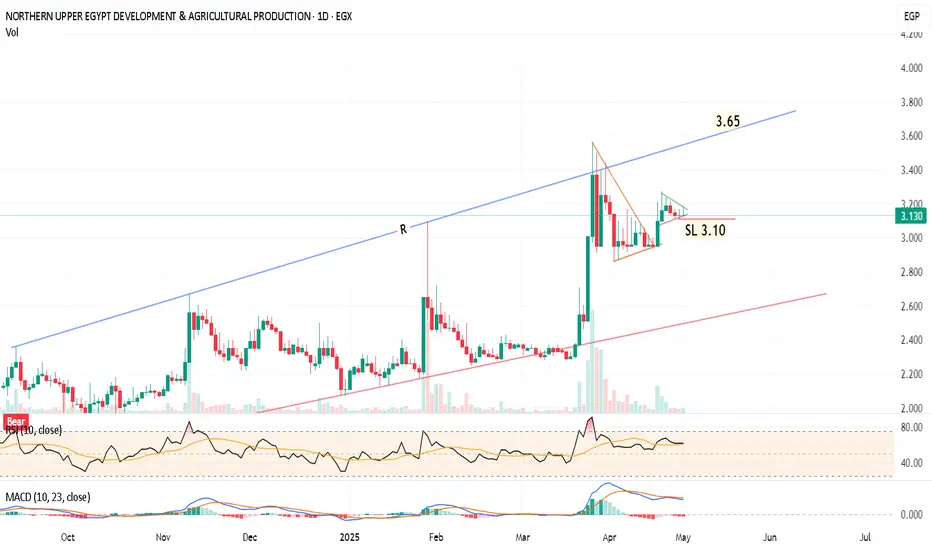
NEDA Egypt should target 3.65 then 4.25Daily chart,
the stock EGX:NEDA formed a pennant chart pattern and is forming another smaller pattern.
I am expecting some minor correction and consolidation around 3.10
Then, a bullish movement towards the resistance line R, at around 3.64 - 3.67
Stabilizing for 2 days above 3.70, will push the price to the next target 4.25
Note the resistance levels at 3.27, 3.44 , 3.56
(Closing below 3.10 for 2 days should be considered a near stop loss level)
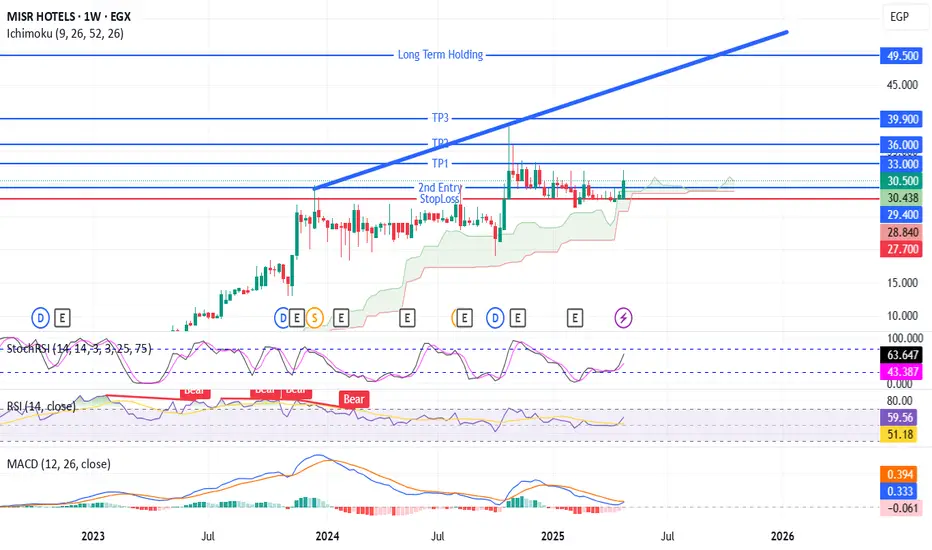
MHOT Bullish Breakout – Targeting 33/36/39.9 EGP After Range EscMHOT (EGX) just confirmed a breakout above a long-standing sideways range near 29.5 EGP, supported by increasing bullish momentum across multiple indicators.
📈 Ichimoku Cloud: Price is clearly above the cloud on both daily and weekly charts — signaling strong trend structure.
💪 MACD + SQZMOM: Both confirm momentum acceleration and possible trend ignition.
📊 Stochastic RSI + RSI: Still have room for upside without being overextended.
🎯 Trade Plan:
Entry 1: 30.50 EGP
Entry 2: 29.40 EGP (support retest)
TP1: 33.00 EGP
TP2: 36.00 EGP
TP3: 39.90 EGP
Stop: 27.70 EGP
⏳ This setup favors swing traders looking to ride a multi-week move toward previous highs, with a risk-reward ratio up to 3.5.
🚨 As always, use proper position sizing and risk management.
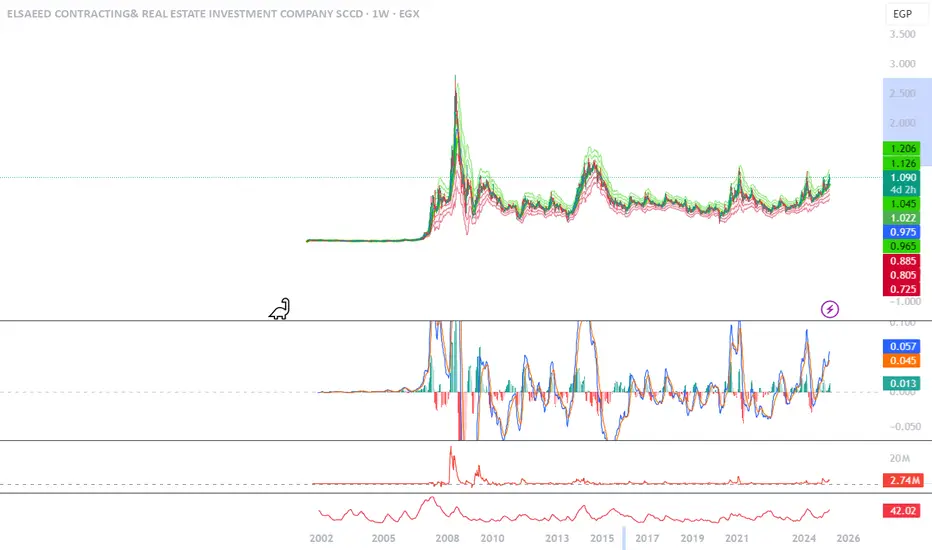
MBEG Set to Soar: Poised for a Historic Rally Back to EGP 118% Here’s a **bullish publication idea** for **M.B. Engineering (EGX: MBEG)**, focusing on its potential rally to **EGP 118**, retesting its **2008 highs**:
---
# **MBEG Set to Soar: Poised for a Historic Rally Back to EGP 3! 🚀🔥**
M.B. Engineering (EGX: MBEG) is showing strong signs of a **major breakout**, with technical and historical indicators aligning for a potential rally back to its **2008 high of EGP3**.
## **Key Bullish Signals:**
✅ **Historical Resistance Turned Support**
MBEG previously hit **EGP 3 in 2008**, marking a significant level of interest. As the stock consolidates, it appears poised to **retest this critical level**, potentially signaling a new uptrend.
✅ **Volume and Momentum Increasing**
A rise in **trading volume** and **buy-side demand** suggests growing investor confidence, setting the stage for a potential surge.
✅ **Technical Breakout Incoming**
- If MBEG **breaks above recent resistance**, it could trigger a **parabolic move**.
- Watch for a clean breakout above **near-term resistance**, which could **confirm the trend reversal**.
✅ **Egypt’s Market Recovery & Sector Growth**
With **Egypt’s economic reforms** and increased **construction/infrastructure investments**, MBEG is well-positioned to benefit from **higher demand and sector expansion**.
## **Final Thought:**
If MBEG maintains its **upward momentum**, a retest of **EGP 118%** is **not out of reach**. Smart investors are keeping a close eye—**don’t miss the move!** 🚀📈
*What’s your price target for MBEG? Drop your thoughts below!* ⬇️💬
---
Would you like to add any **charts, technical indicators, or market news** to strengthen this publication? 🚀Clear Divergence on the 4H time frame with increasing volume
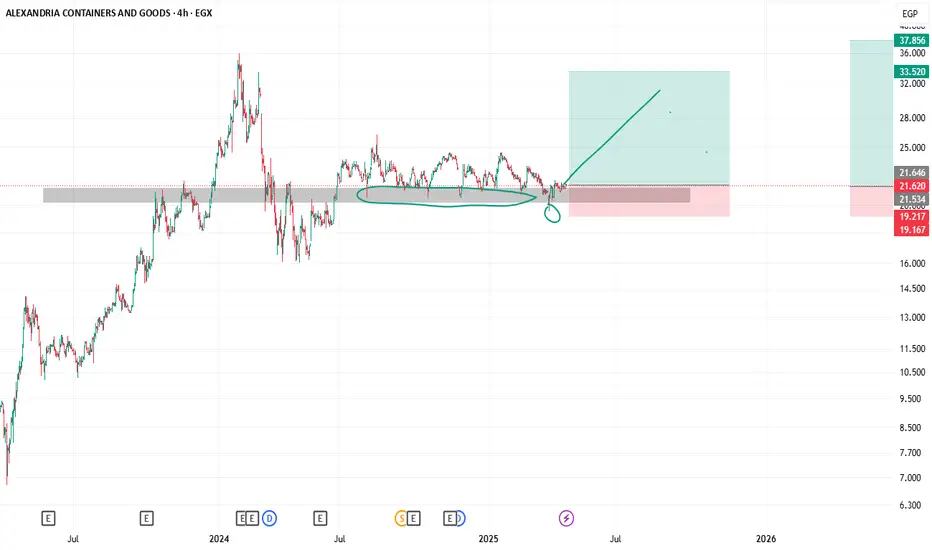
ALCN Stock (free money)Yep as i can see in here, this is free money laying around needs to be taken. This is a classic example of an uptrend, got weak a little bit, formed a double bottom. Price made a new range. Accumulated, manipulate, then the final stage is distribution, that's were we make money.
i would give it a 9 out of 10 trade. But DYOR as my analysis could be wrong, and news could affect this stock badly.
ABUK Short This stock is a short term bearish until 42.4 or if i dives dipper to 36.11 EGP. But more than likely it will stop at 42.4 EGP then full reversal should be in play.
The 80% likely scenario is the price further retraces and reverse. But if good news comes around and the price fully closes above 62 EGp, then wait for any retracement to 62 again and go long.
Also iam very convinced that this is a short play in hands, the price didnt make a lower lows yet and stalls at this support level, so it really depends on the news and its correlation to price action and how the stock will respond to it.
DYOR and check the news daily if you to take any trade since one negative or positive news that happens suddenly could change the whole setup.

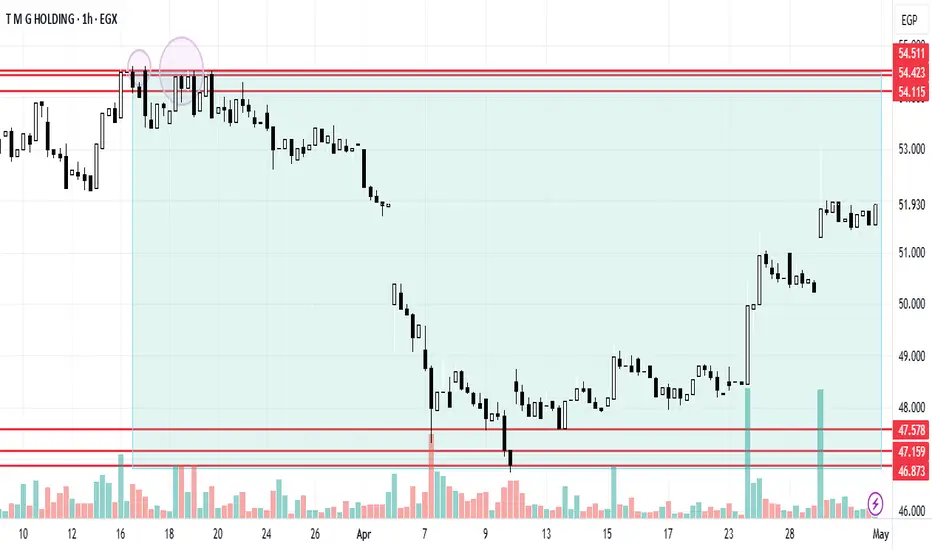
TMG Holding Fundamental and Chart AnalysisTMG Holding trend has recently taken an upward trend between the support line 46.873 and the resistance line 54.511, up by 0.78%. It is expected to keep rising till breaking the 1st resistance line at 54.115 and then the 2nd one at 54.423 points because of positive fundamental analysis. On one hand, the CBE's decision about cutting the interest rate by 2.25% would lead to positive impact on corporates because of the current reasons behind the economic activity, decreasing interest rate will lead to a decrease in the cost of borrowing, which will decrease the cost of production and will increase the corporates' profit and their monetary value. Accordingly, this will lower the products' price and individuals will have a higher will to diversify their investments and increase their purchasing power. On the other hand, besides the current annual advertisements about SouthMed and the summer getting closer, there is news on Reuters about an advanced stage of negotiations for a new large-scale mixed-use project in Iraq. This project is estimated to generate total sales vicinity of $17 Billion and annual recurring income exceeding $1.5 Billion.