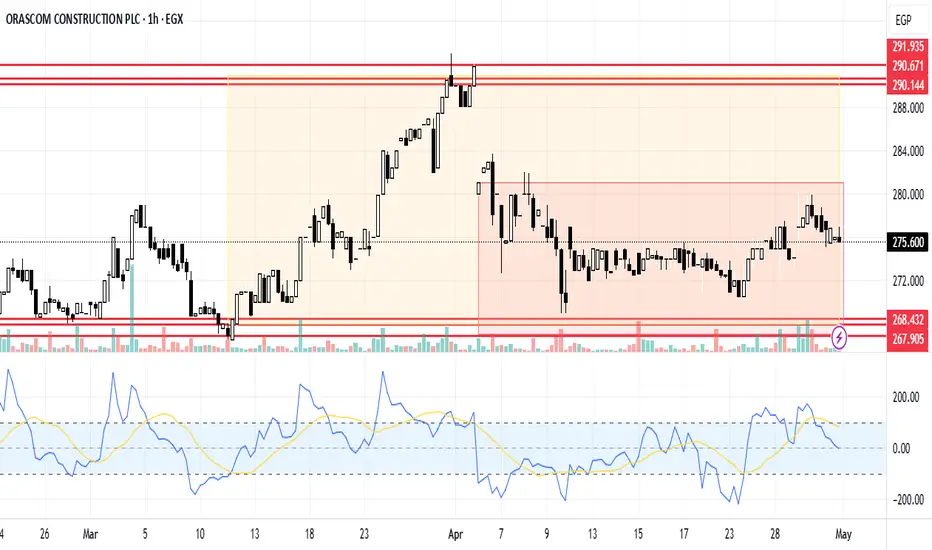
ORAS Stock Fundamental AnalysisORAS trend was neutral between the support line 266.851 and the resistance line 291.935, the trend was down by 0.14%. The stock rose, and broke the first support line to reach the second support line 267.905, then the third support line 268.432. It's expected to keep rising till reaching the resistance line 290.144, then 290.671, because of the CBE's decision about cutting the interest rate by 2.25% which will have a positive impact on corporates because according to the current reasons behind the economic activity decreasing interest rate will lead to decreasing the cost of borrowing which will decrease the cost of production and will increase the corporates' profit and their monetary value. On the other side, this will decrease the products' price and individuals will have a higher will to diversify their investment beside increasing their purchasing power as well.
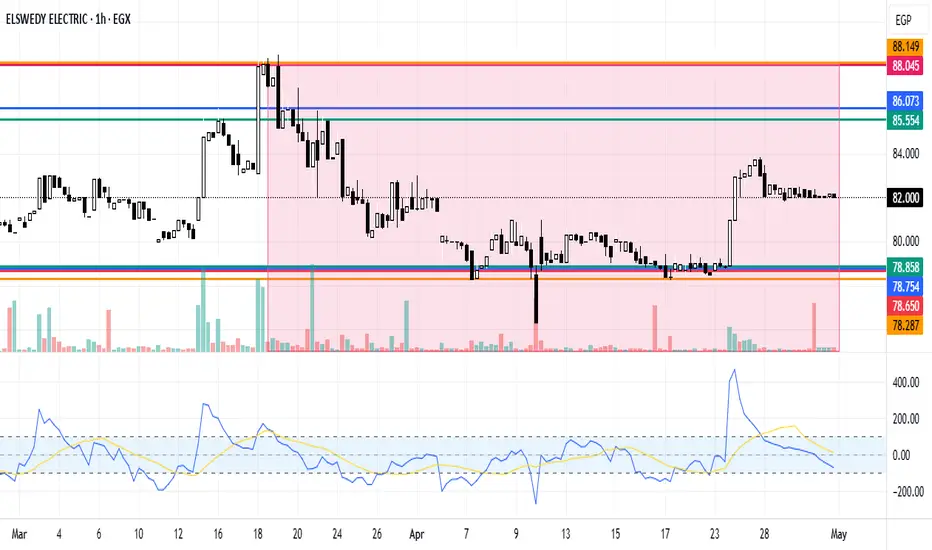
El Sewedy Electric Stock Trend AnalysisEl Sewedy Electric stock trend rose last period from the support line 78.287 to the resistance line 88.149, then rebounded to reach the support line 78.65, so the general trend was down by 0.24%. The stock rose, and broke the first support line 78.65 to reach the second support line 78.7574, then the third support line 78.858. On the other hand, when the stock rebounded, it broke the first resistance line 88.045 to reach the second resistance line 86.073, then the third resistance line 85.554
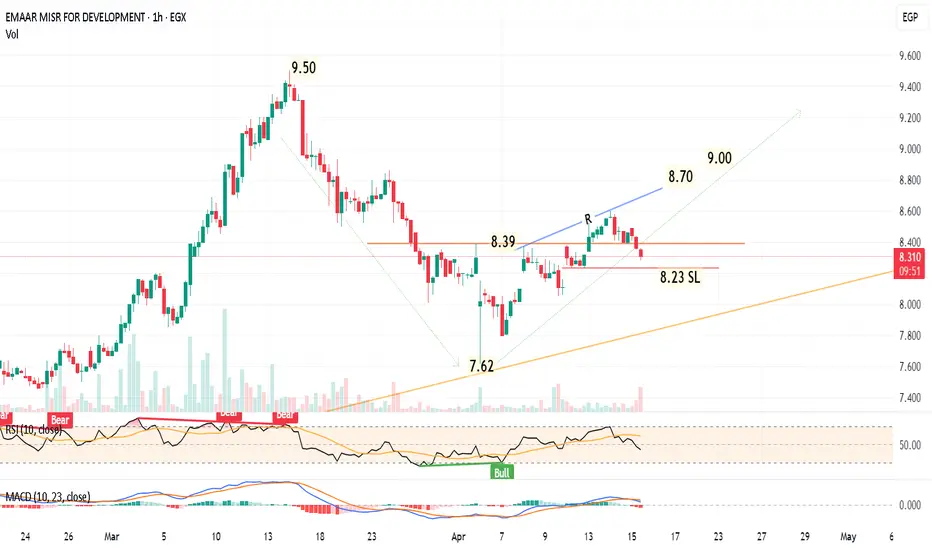
EMFD Egypt should be targeting 9.001-hour chart
The stock, fell from 9.50 to 7.62, and rebounded to 8.60, then it is under minor correction in the bullish direction.
A new entry Buy will be after closing above 8.40 for 2 hours, the target will be 8.70 then 9.00
Also, buying in parts from 8.30 to 8.24 is OK with a higher risk and higher profit.
Consider a stop loss level below 8.23
breakout above resistance** can signal strong upside potential.
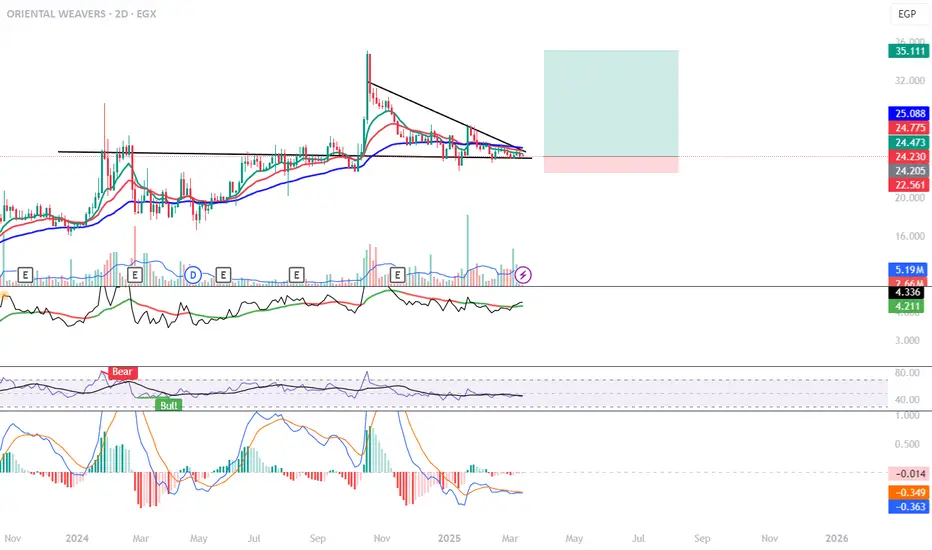
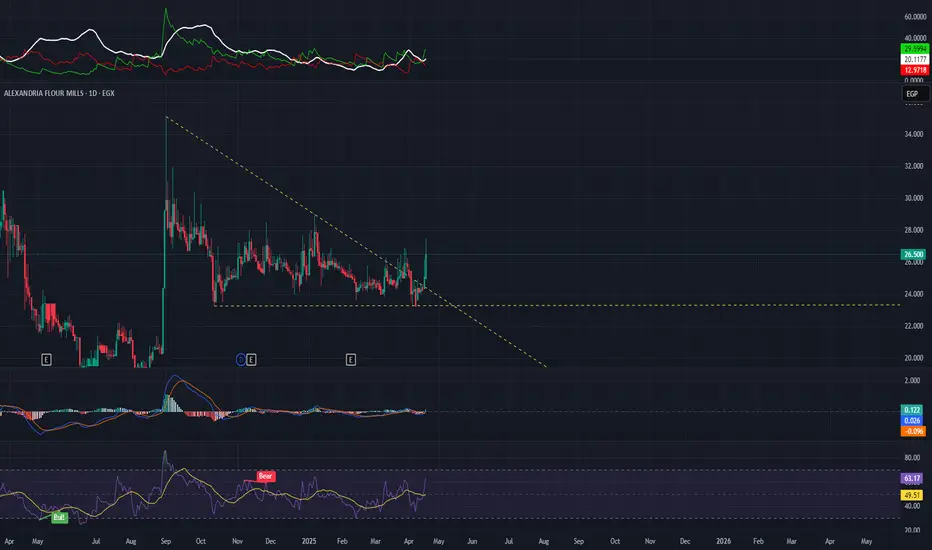
#### **1️⃣ Chart Pattern & Breakout Potential**
- The stock is forming a **descending triangle**, which is often bearish, but **a breakout above resistance** can signal strong upside potential.
- The price is consolidating near **24.23 EGP**, close to a breakout point.
- If the price **breaks above 25.08 EGP**, it could trigger a strong rally.
#### **2️⃣ Key Levels to Watch**
- **Immediate Resistance:**
- **24.77 EGP** → Break above this = first bullish confirmation
- **25.08 EGP** → Major breakout level 🚀
- **Support Levels:**
- **24.00 EGP** (bulls need to defend this)
- **18.66 EGP** (worst-case scenario)
#### **3️⃣ Indicators Supporting a Bullish View**
✅ **RSI (45.91)** → Near 50, if it crosses **above 50-55**, bullish momentum increases.
✅ **MACD** → Although slightly bearish, a **bullish crossover** could confirm the breakout.
✅ **Volume (5.19M)** → A **spike in volume** will validate an upward move.
#### **4️⃣ Bullish Targets 🚀**
- **📍 First Target:** **27.00 - 28.00 EGP**
- **📍 Second Target:** **30.00 - 32.00 EGP**
- **📍 Ultimate Target:** **36.00 EGP** (if strong momentum follows)
#### **5️⃣ Ideal Bullish Trade Setup 🎯**
- **Entry:** On breakout above **25.08 EGP** (with strong volume).
- **Stop-Loss:** Below **24.00 EGP** (to protect downside risk).
- **Take Profit:** Gradually at **27.00 - 30.00 EGP**.
- **Confirmation:** Watch for RSI moving above 50 and MACD crossing bullish.
---
### **🔹 Final Thoughts**
- **If ORWE breaks above 25.08 EGP, the next stop is 27-30 EGP.**
- **Watch volume closely! A big move needs strong buying pressure.**
- **Bulls should hold as long as 24.00 EGP support holds.**
🚀 **If volume confirms, this could be a strong breakout trade!**
Sell breakout Sell the breakout of the trendline to the targets shown by zones of interest ( demand zones)
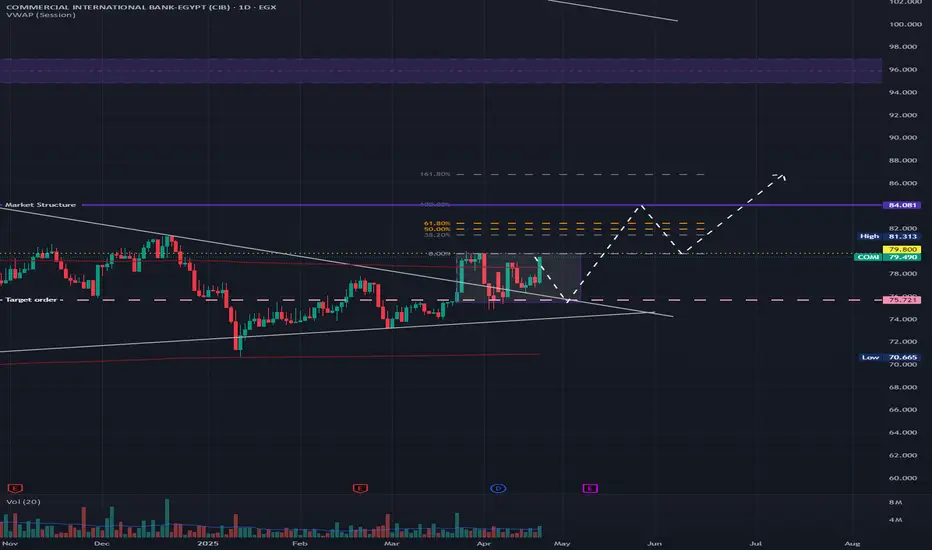
COMI needs to break out of the channel to reach the next target.The price is currently facing channel resistance at 79.8. If it breaks above this level, the initial target is the strong resistance at 84. From 84, the price might pull back to retest the 79.8 level. If 79.8 holds as support and buying pressure is strong, the subsequent target would be 96.
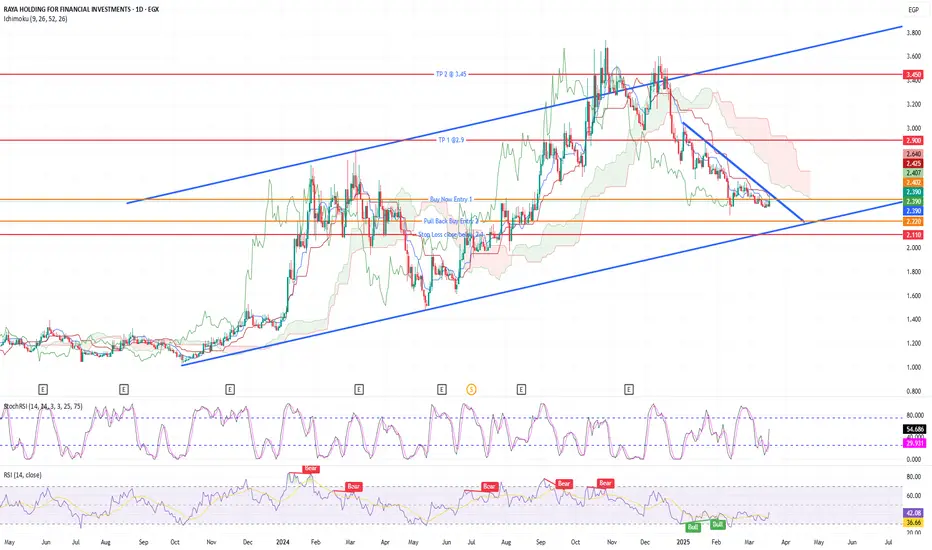
RAYA HOLDING: Bullish Rebound or Breakdown? Key Levels to Watch!RAYA HOLDING (EGX) is at a crucial decision point!
Trading near key support at 2.22 - 2.39 EGP, with a chance to rebound within the long-term bullish channel.
Breakout above 2.40 could lead to TP1 at 2.9 and TP2 at 3.45 🚀.
Bearish case? A breakdown below 2.1 could trigger further downside.
📊 RSI & Stoch RSI hint at potential momentum shift—what’s your take? Let’s discuss!
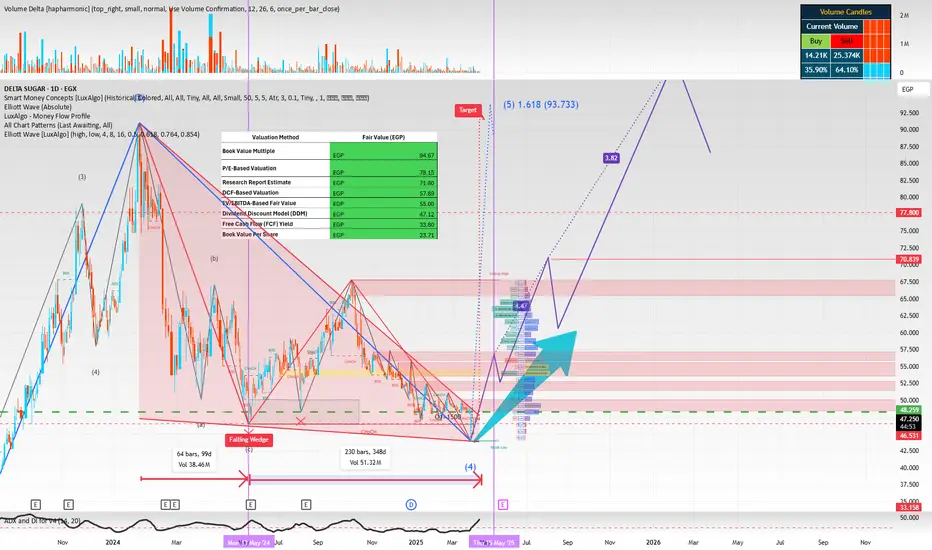
long for 1 Year investor (EGX:SUGR)Delta Sugar Company (EGX:SUGR)
On 23th April 2025 close at 47.17 EGP/Share
Overview
Delta Sugar Company engages in the manufacture and sale of sugar beets in Egypt. The company was founded in 1978.
📊 Financial Snapshot
✅ Strengths:
• EPS (Trailing): 7.60 → Solid earnings power.
• PE Ratio: 6.22 → Undervalued vs. market.
• Book Value/Share: 23.71 EGP → P/B ratio ≈ 2 → Moderately priced on asset basis.
• Strong ROE: 39.38%
• ROIC: 22.22% → Efficient capital use.
• Net cash position: +557.5 million → No leverage risk, ample liquidity.
⚠️ Weaknesses
• Free Cash Flow (FCF): -181.79 million EGP → Negative FCF raises sustainability concerns
• Operating Cash Flow (OCF): -38.57 million EGP → Core operations not currently cash generative
Fair Value Estimates:
• Cairo Financial Holding: 71.80 EGP
• Ostoul Securities Brokerage
• Sector-based Book Value Multiple 76.58 EGP/Share
• Sector-based PE Multiple 98.069 EGP/Share
📐 Technical Analysis
• Pattern Analysis: Currently forming a falling wedge pattern, typically a bullish signal.
• Elliott Wave Target (TP1): 94 EGP/share, as illustrated.
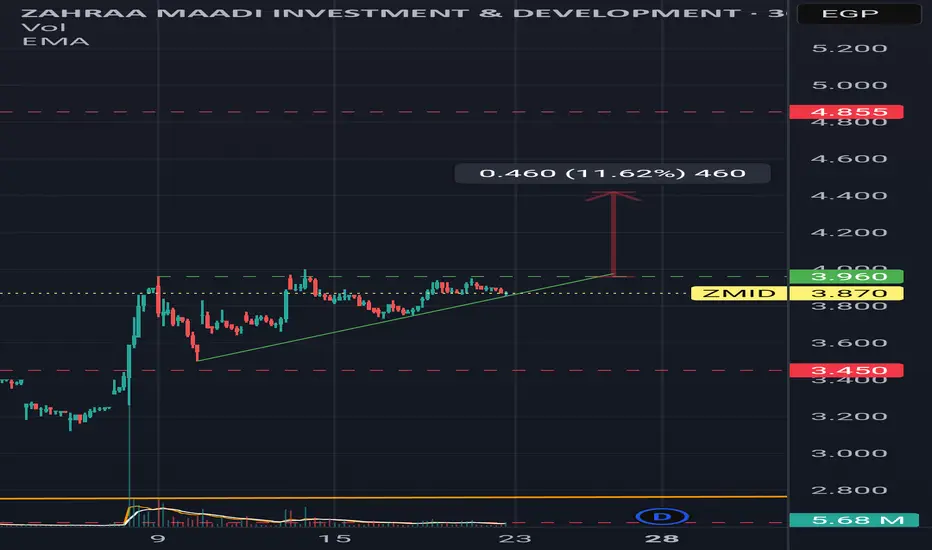
Waleed zaki is a wolf Final target 4.4
Resistance 3.96
Tic tac
Short trade
Don't forget support and follow
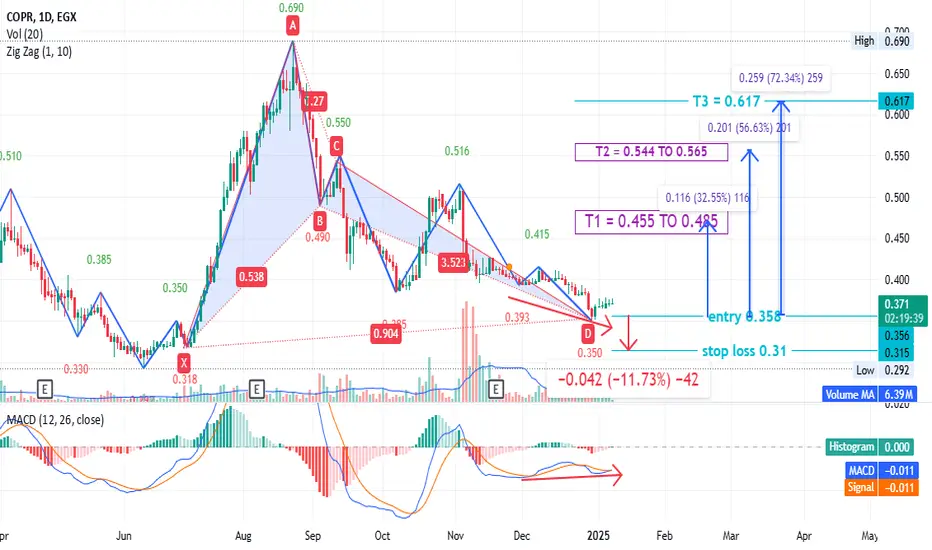
#COPR Egyptian stock#COPR time frame 1 DAY
created a bullish Gartley pattern
Entry level at 0.358 to 0.33
Stop loss 0.31 ( loss may go to up 11% )
First target at 0.455 to 0.485 ( with profit around 32% )
Second target 0.544 to 0.656 ( with profit around 55% )
Third target 0.617 ( with profit 70% )
Hight expectation with stop loss more than 11%
the positive thing here is MACD created a positive diversion with low volume at last 3 weeks .
NOTE : this data according to time frame I DAY , it`s may take period up to 3 months to achieve targets , you must study well the Alternative opportunities before invest in this stock .
Its not an advice for investing only my vision according to the data on chart
Please consult your account manager before investing
Thanks and good luck
CIRA EDU | Breakout Brewing After Rate Cut – Eyes on 16.80 EGP! CIRA is showing early signs of a bullish reversal just as Egypt's Central Bank slashes bond interest rates by 2.5%. With a fresh MACD bullish crossover and rising momentum, the stock is pushing off key support and aiming for the top of the Ichimoku cloud.
Momentum: Price just broke out of a short-term consolidation zone
Ichimoku Cloud: Price is trying to break upward but still under the cloud → neutral to mildly bullish
Stochastic RSI: Entering overbought territory (above 80)
RSI: Around 42–43 → still has upside room
MACD: Gave a bullish crossover, histogram flipped green → early bullish signal
🟢 Entry: 14.40 EGP
🎯 TP Levels: 15.45 / 16.4
🔻 SL: 13.3
The education sector tends to thrive in lower rate environments, and with strong dividend growth and improving EBITDA, CIRA could be a hidden gem for short- to medium-term traders.

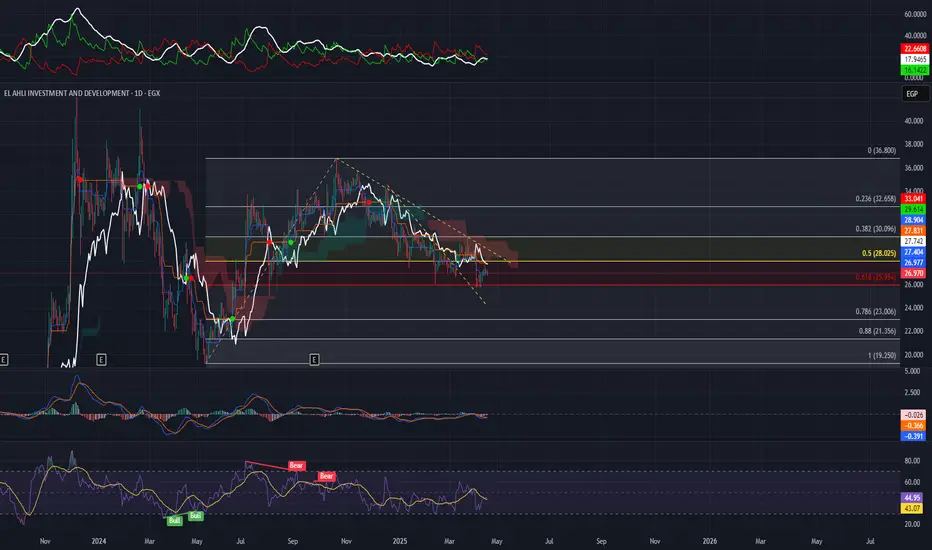
long for smart money and long investors up to April 2026Credit Agricole Egypt (EGX:CIEB) is currently fundamentally undervalued with a strong balance sheet and net cash position of 55.72 billion or 44.58 per share.
Wyckoff Analysis for EGX:CIEB
Using the Wyckoff Method, we analyze smart money accumulation and potential future price action.
Accumulation Zones (Smart Money Entry Points)
Primary Accumulation Zone: 19–18 EGP
Secondary Accumulation Zone: 13.50–14.60 EGP
Supporting Evidence:
Strong Support Level at ~17.1 EGP – Confirmed as a previous accumulation zone.
Extremely Low P/E (2.9) – Undervaluation likely attracted institutional buying.
Price Decline (-14.99% over 52W) – Classic Wyckoff accumulation behavior.
Smart Money Entry Below 20.0 EGP – Likely near the Last Point of Support (LPS) before markup.
🚀 Distribution Phase Projection (Future Exit Zone)
Per Wyckoff theory, smart money may begin distributing shares near fair value, estimated at:
Fair Value (FV) = EPS × P/E → 6.24 × (5–6) = 32.1~38.52 EGP
Investment Thesis (if suitable for your portfolio):
• ✅ Very low PE & high ROE
• ✅ Strong dividend yield (17.2%)
• ✅ Healthy balance sheet with large net cash
• ⚠️ Risks: Market liquidity, FX/capital controls, macro instability in Egypt

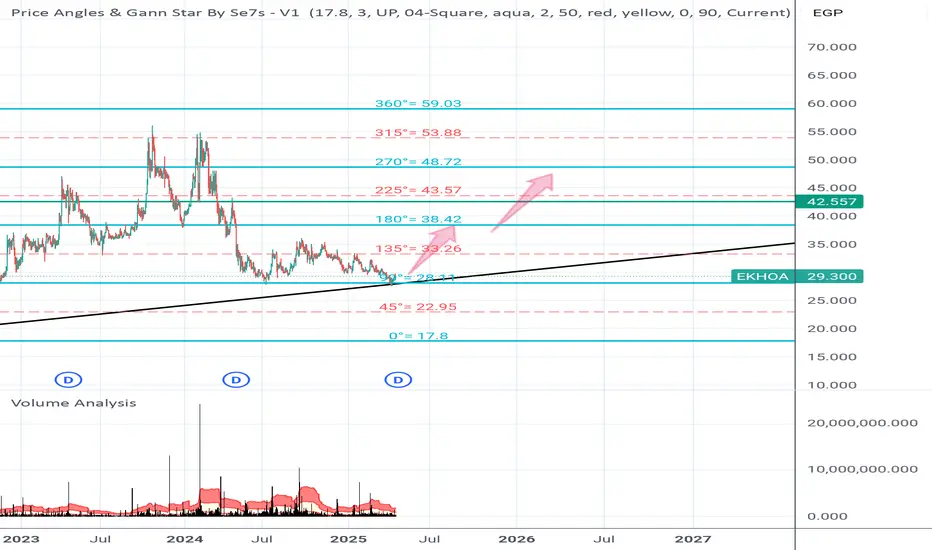
EKHOA .....Let's SeeEKHOA, let's see if this analysis would be valid or not. I think 28 level will be the base to go up to reach 38.42, then 48.72 then 59 as third target.
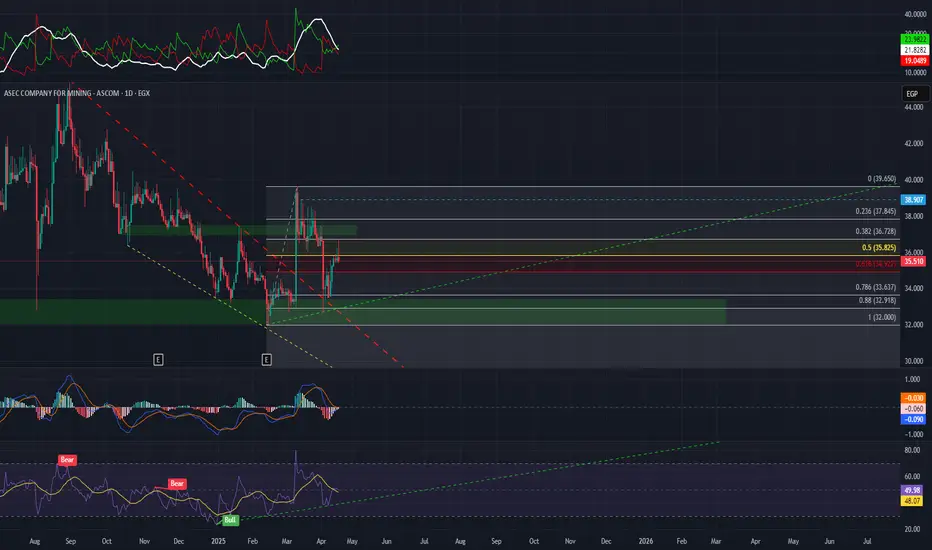
EGX:ASCM Long Call ... EGX:ASCM
For fellow traders evaluating a long position, here’s the reasoning behind the setup:
Falling wedge breakout: The price has successfully broken out of a falling wedge, a bullish reversal pattern. Additionally, the breakout level has been retested, confirming it as a solid support zone.
88% retracement: The asset has retraced 88% from its recent bottom, aligning with typical wave 2 behavior in a larger motive wave. This deep pullback strengthens the likelihood of an upcoming impulsive move.
RSI confirmation: The Relative Strength Index (RSI) is forming higher lows, indicating weakening bearish momentum and increasing buying pressure.
Monitoring volume and key resistance levels could help refine the entry strategy. Let me know if you’d like to expand on any specific details! EGX:ASCM
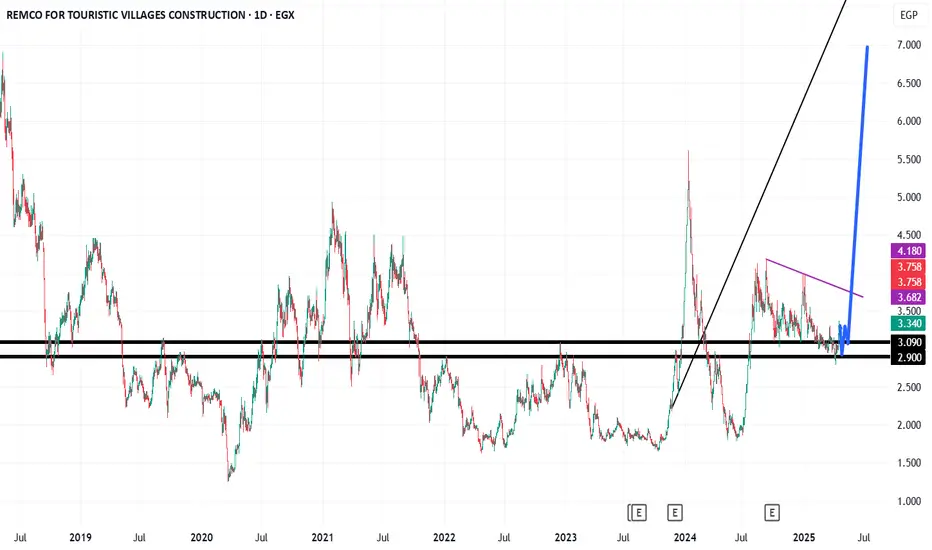
#RtvcRamco stock presents a strong opportunity with a small stop-loss and a potential gain exceeding 100%. Entry point at 3.25, target at 7.00, with a stop-loss at 15%. A very promising setup
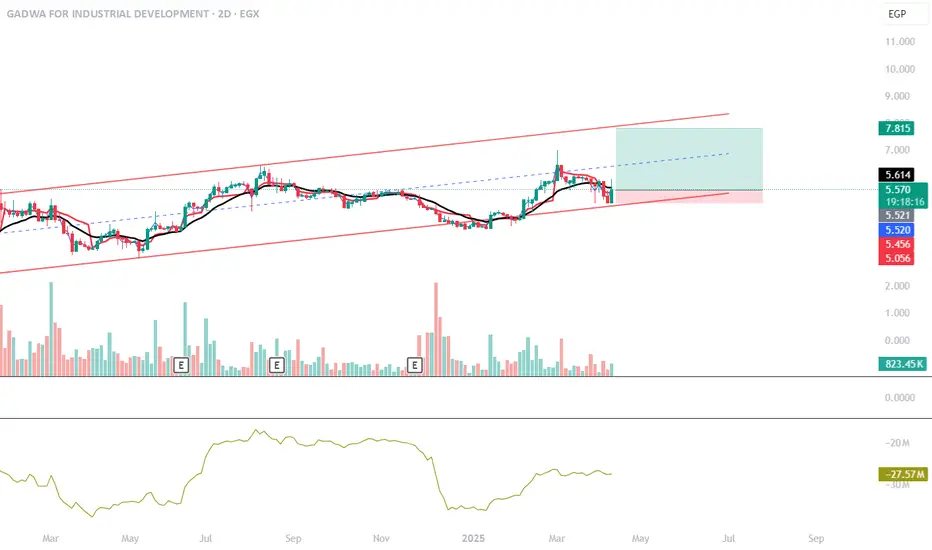
Trend is your Friend Confirmation showed up Hello Traders,
very clean setup and easy for any one you can see the trend confirmation buy signal from the support line clean close above the prev close
im buying and getting out from the 7.5 area no need to complicate things up
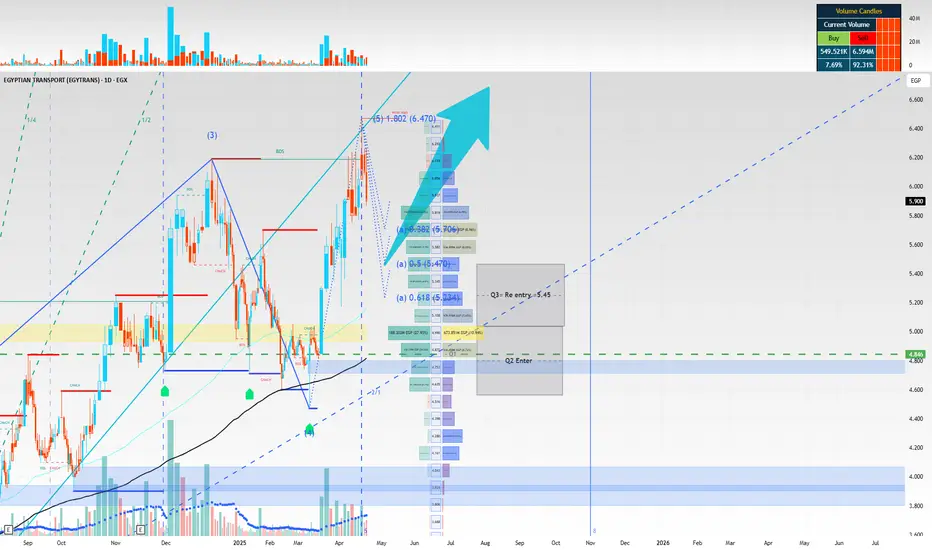
ETRC_strong investment opportunityEgyptian Transport and Commercial Services Company S.A.E. (EGX:ETRS)
Company Overview:
Egyptian Transport and Commercial Services Company S.A.E. (EGX:ETRS) is an Egyptian logistics provider offering a wide range of professional and cost-effective logistic services. The company was established in 1973 and is listed on the Egyptian Exchange (EGX).
Investment Highlights:
• Significant Undervaluation: Trading at EGP 5.90, below fair value of EGP 9.10 (54.2% upside)
• Exceptional Financial Strength: Low P/E ratio, strong profit margin, minimal debt
• Positive Technical Outlook: Bullish trend in Elliott Wave and Wyckoff analysis
• Favorable Risk-Reward Profile: Upside potential (54.2%) outweighs downside risks (15-20%)
• Strong Sector Outlook: Egyptian transportation and logistics sector projected to grow at 7% CAGR.
Fair Value Range
• Ostoul Securities Brokerag Conservative Fair Value: EGP 7.82 (+32.5% upside)
• DCF Fair Value: EGP 7.6 (+28.2% upside)
• Optimistic Fair Value: EGP 11.00 (+86.4% upside)
• Cairo Financial Holding Research Fair Value: EGP 9.5 (+61% upside)
Base Case on the above Fair Value: EGP 9.10 (+54.2% upside)
ETRS is Financial Health and is considered a strong investment opportunity based on
Fundamentals:
• Low P/E ratio of 4.17
• High profit margin of 30.83%
• ROE: 45.14%
• Low debt-to-equity ratio of 0.09
• EV/EBITDA: 4.06 (Undervalued)
• P/FCF: 23.02 (Suggests weaker cash flow compared to earnings)
Technical analysis:
Based on my analysis average accumulation price:4.30 EGP by Smart Money Holdings
According to Wyckoff theory, smart money typically begins distribution likely begin distribution in the 8.50-9.50 EGP range the price approaches fair value.
• Primary Support: 5.00-5.20 EGP (previous resistance turned support)
• Secondary Support: 4.80 EGP (entry point)
• Strong Support: 4.30-4.60 EGP (previous accumulation zone)
• Elliott Wave Theory Analysis Wave 5 Scenario: If in early Wave 5, we would expect a final push upward with a price target of approximately 7.50-9.00 EGP forecast Oct.2025
• Long-term (12+ months) target is +11.00 EGP
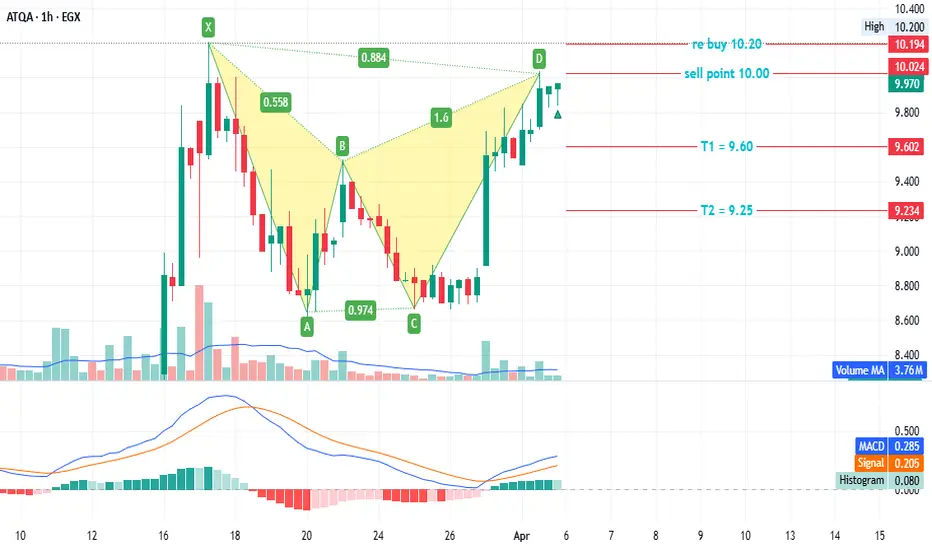
#ATQA - Egyptian stock#ATQA timeframe 1 hour
Created a bearish Gartley pattern
Sell point around 10.00
Stop loss / reentry 10.20 (estimated loss -1.65%)
First target at 9.60 (estimated profit 4.20%)
Second target 9.25 (estimated profit up to 7.70%)
NOTE: this data according to timeframe 1 hour.
NOTE: stock remains positive for long term.
It's not an advice for investing, only my vision according to the data on chart.
Please consult your account manager before investing.
Thanks and good luck.
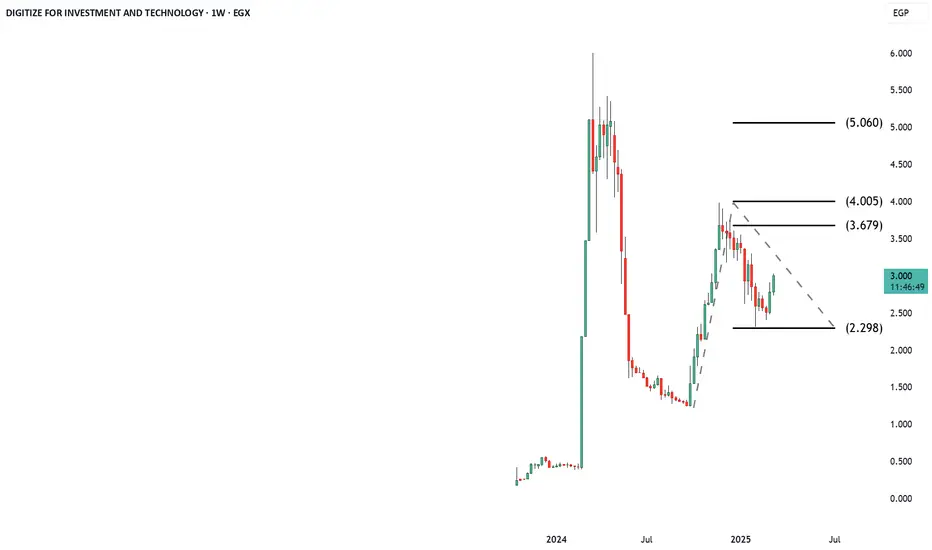
DIGITIZE EGX | Breakout or Breakdown? Key Levels & Trading StratDIGITIZE FOR INVESTMENT AND TECHNOLOGY (EGX) is currently trading at EGP 3.00, showing signs of consolidation within a descending triangle pattern. The price is attempting to break out from a downtrend, with Ichimoku cloud resistance and key support levels in play.
In this analysis, I outline a Stop-Loss & Take-Profit strategy to navigate the next move efficiently.
🔹 Key Resistance Levels:
EGP 3.60 → First target
EGP 3.90 → Second target
EGP 4.90 - 5.00 → Strong breakout potential
🔹 Key Support Levels:
EGP 2.75 → Near-term support
EGP 2.30 - 2.40 → Strong support zone
Entry: Buy after a confirmed breakout above EGP 3.20
Take-Profit 1: EGP 3.60
Take-Profit 2: EGP 3.90
Take-Profit 3: EGP 4.90 - 5.00
Stop-Loss: Below EGP 2.75
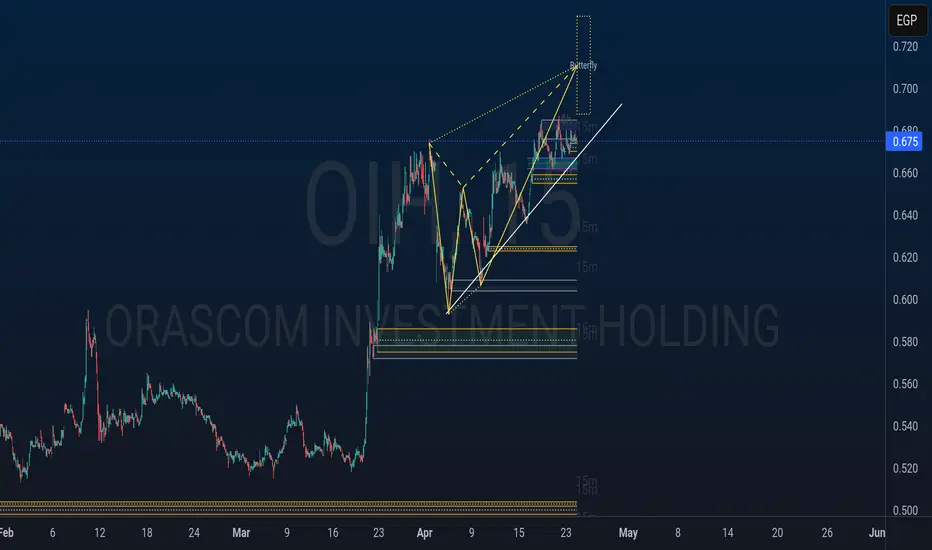
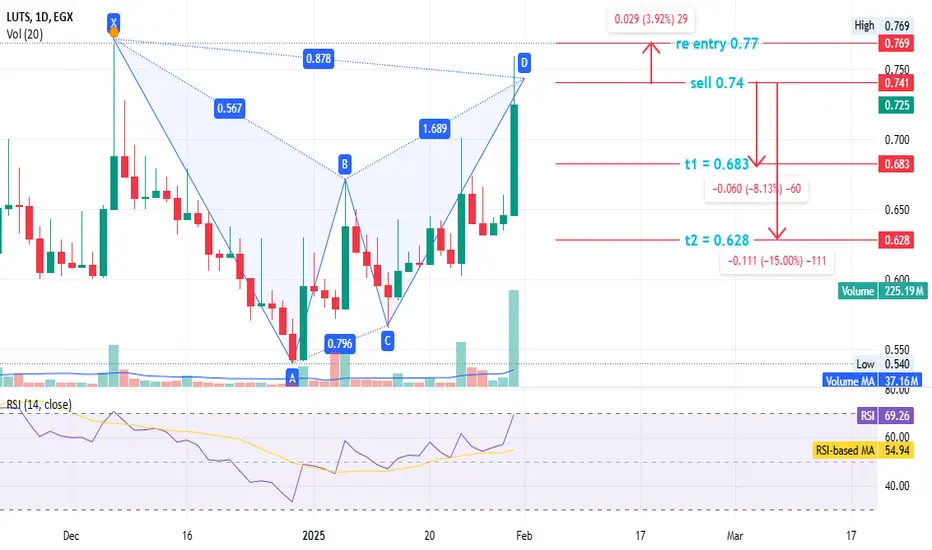
#LUTS Egyptian stock#LUTS time frame 1 DAY
Created a bearish Gartley pattern
Sell point around 0.74
Stop loss / reentry 0.77 ( estimated loss -4% )
First target at 0.683 ( estimated profit 8% )
Second target 0.628 ( estimated profit up to 15% )
Although all indicators is positive but the prices at sell point according to bearish Gartley pattern ( prices at 0.886 FIP ) , also there is negative diversion on RSI time frame 15m , may tha support or idea
any way if prices closed daily uber 0.77 with volume at least 40 M shares , re bay .
the profit in this case is saving your invest from losses up to 13% .
in case the prices still rises then re entry for targets 2.75 , 2.83 , 2.93 up to 3.11.
NOTE : this data according to time frame 1 DAY
Its not an advice for investing only my vision according to the data on chart
Please consult your account manager before investing
Thanks and good luck
PHGC - Egyptian stock#PHGC timeframe 1 DAY
Created a bearish Gartley pattern
Sell point around 1.48 ( PRICE NOW 1.50 )
Stop loss / reentry 1.574 (estimated loss -6.35%)
First target at 1.267 (estimated profit 14.40%)
Second target 1.077 (estimated profit up to 27.63%)
NOTE: this data according to timeframe 1 DAY.
It's not an advice for investing, only my vision according to the data on chart.
Please consult your account manager before investing.
Thanks and good luck.
