Ryanair: Focus on Major Cities and Pressure on AenaBy Ion Jauregui – Analyst at ActivTrades
Ryanair’s withdrawal from regional airports in Spain once again exposes their dependence on the Irish carrier. The airline, which had already significantly reduced its offering in Jerez, Valladolid, and Vigo, now threatens to cut another one million seats next winter if Aena does not reconsider its plan to raise airport fees by 6.5% in 2026. During 2025, the airline has already canceled around 800,000 seats on regional routes, redirecting capacity toward larger cities such as Madrid, Málaga, or Alicante, where its capacity increased by 3% over the summer.
According to Aena data, the reduction has hit Valladolid (-59.5% passengers until July) and Santiago (-13.3%) the hardest, while airports such as Vigo (+10.2%) and Zaragoza (+2.9%) have managed to partially offset the loss. Competitors, however, have not managed to fill the gap. Vueling will only resume the Barcelona–Valladolid route in October, while Volotea and Air Nostrum have not yet taken over any canceled routes. Meanwhile, UK-based Jet2.com has announced it will begin operating Jerez–London starting in 2026.
Among the routes canceled at mid-sized Spanish airports are the following:
Jerez – Barcelona
Jerez – Santiago de Compostela
Valladolid – Santiago de Compostela
Valladolid – Barcelona
Valladolid – London Stansted
Vigo – Barcelona
Zaragoza – Vienna
Zaragoza – Lisbon
Asturias – London Stansted
Santander – Alicante
Fundamental Analysis
Results confirm that Ryanair remains solid in Spain despite its regional pullback. In the first half of 2025, it carried 32.64 million passengers—two million more than in the same period the previous year—consolidating its position as Spain’s leading airline. Its strategy is clearly aimed at maximizing profitability in high-volume hubs by reallocating capacity from less efficient routes.
The conflict with Aena is key: Ryanair argues that the network model and fee increases make its operations more expensive compared to other European markets. If these are not reviewed, the adjustment could extend to more mid-sized airports, further threatening regional connectivity in Spain.
Technical Analysis (Ryanair Holdings – Ticker AT: RYA.IE)
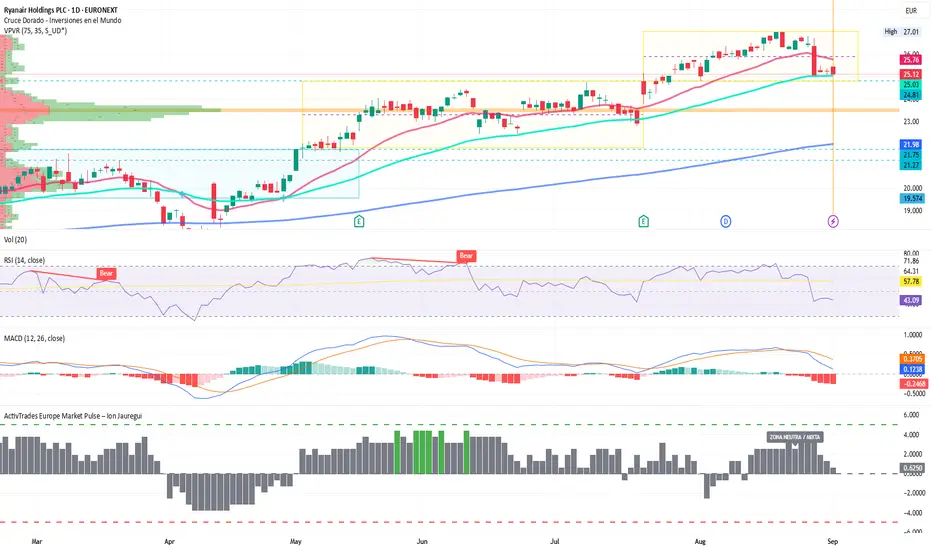
Ryanair shares maintain an underlying bullish bias in 2025, supported by air traffic recovery and strong cash generation. The stock broke out of its consolidation range between €21.98 and €24.82 at the end of July, reaching an annual high of €27.01. However, after that surge, it corrected sharply to €25.12, a level where it has found support once again.
The most relevant Point of Control (POC) sits at €23.52, coinciding with the midpoint of the previous consolidation range. Technically, the price has lost support from the 50-day moving average but remains above the 100-day average, reinforcing a scenario of consolidation with a slightly bearish tilt. Indicators confirm this picture: the RSI stands at 43.09%, in slight oversold territory, while the MACD still reflects bearish corrective pressure.
In the short term, a clear breakout above €26 would enable a new upward leg, potentially retesting recent highs at €27.01. Conversely, a breakdown of supports could open the door to pullbacks toward €23.52—the midpoint of the prior consolidation range—or even the lower band at €21.98.
The ActivTrades Europe Market Pulse indicator points to a rise in risk aversion (risk-off), though still within neutral territory. This suggests that macro sentiment will be decisive: while market pressure persists, the stock may remain in consolidation. If risk appetite improves, Ryanair could once again have room to test its yearly highs.
Market Sentiment Impact (Rise in Risk-off)
The airline sector, due to its cyclical nature, is particularly sensitive to shifts in investor risk appetite. In a risk-off environment—shaped by geopolitical tensions, economic slowdown, or higher oil prices—airline stocks typically face selling pressure, with capital flowing instead into safe-haven assets such as Treasuries, the Swiss franc, or gold.
Although Ryanair benefits from its competitive low-cost model and leadership position in Spain, it remains exposed to macroeconomic volatility and potential demand drops in risk-off scenarios. This duality makes the company an attractive play during risk-on phases but vulnerable during periods of global uncertainty.
Ryanair’s regional retreat is more of a strategic maneuver than a structural setback. The company is strengthening its presence in major airports and continues to show strong passenger growth. Pressure on Aena and the proposed fee hikes will set the tone for the coming months, while on the stock market the share remains in a key range, with investors closely watching the outcome of this standoff with Spain’s airport operator.
*******************************************************************************************
The information provided does not constitute investment research. The material has not been prepared in accordance with the legal requirements designed to promote the independence of investment research and such should be considered a marketing communication.
All information has been prepared by ActivTrades ("AT"). The information does not contain a record of AT's prices, or an offer of or solicitation for a transaction in any financial instrument. No representation or warranty is given as to the accuracy or completeness of this information.
Any material provided does not have regard to the specific investment objective and financial situation of any person who may receive it. Past performance and forecasting are not a synonym of a reliable indicator of future performance. AT provides an execution-only service. Consequently, any person acting on the information provided does so at their own risk. Political risk is unpredictable. Central bank actions can vary. Platform tools do not guarantee success.
Klea Holding (ex-visiomed) a new hopes :) :)The buyback and cancellation of the PARK BSAs, as well as the overall financial strategy, present several positive aspects for Klea Holding and its shareholders: Reduced dilution: The cancellation of 20,000,652 BSAs (Tranches 3 and 5) and the negotiations for Tranche 4 (22,831,050 BSAs) reduce the risk of creating new shares, protecting the value of existing shares. This is particularly important for a small-cap company like Klea Holding (capitalization of approximately €12.36 million in August 2025), where dilution can have a significant impact on the share price. Positive signal: By repurchasing the warrants at low prices (€0.01 for Tranche 3, €0.08 for Tranche 5), Klea Holding is taking advantage of the low current value of the warrants to limit their future impact, especially for Tranche 4 (strike price of €0.16, close to the current price of ~€0.203).
Sufficient cash flow: The transaction is financed by existing cash resources, demonstrating financial strength and independence from external financing (debt or capital increase). This reinforces investors' confidence in Klea's ability to support its growth without immediate financial pressure.
The mention of sufficient cash flow to finance growth projects (notably the expansion of Smart Salem and Smart Health) is a reassuring signal.
Consistent financial strategy: Capital stability: The share buybacks (announced on August 18 and 25, 2025) and the cancellation of warrants are part of a strategy to reduce the free float, which can support the share price in the medium term by reducing supply.
Debt reduction: The target of zero debt by the end of 2026, with the repayment of Smart Salem's debt by September 2025, improves the balance sheet structure and reduces financial expenses, increasing future profitability.
Cost streamlining: The reduction in holding company expenses (e.g., administrative costs) is expected to improve EBITDA, as planned for 2025 (+50% in 2024 to €3.3 million).
Solid operational performance: The Smart Salem subsidiary posted a 55% increase in tests performed in H1 2025 (+48% in revenue at constant exchange rates), with a record 17,500 tests in January 2025. This momentum supports Klea's ability to generate cash flow to finance operations such as the BSA buyout.
Smart Health's expansion in Saudi Arabia and a new investor in the KAFD project strengthen its international growth prospects.

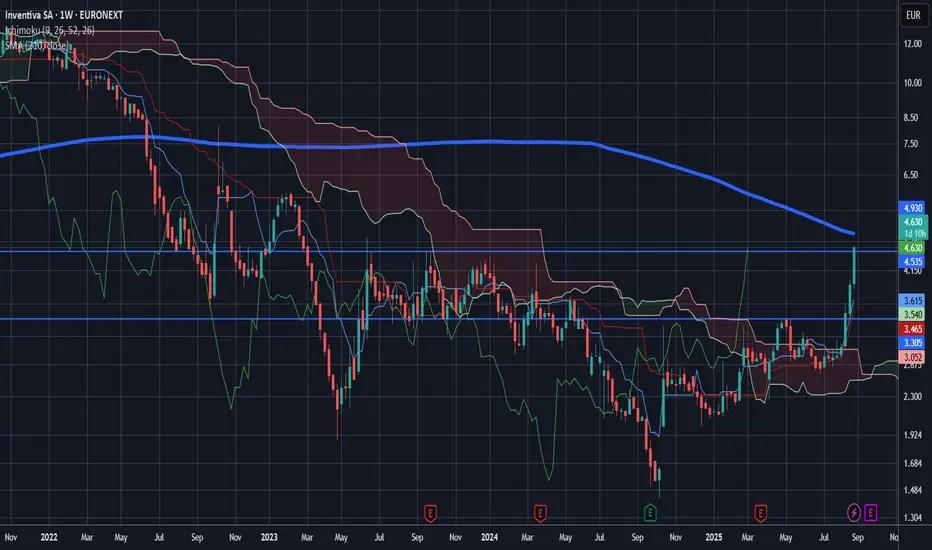
Inventiva faces resistance but has solid fundamentalsOn an uptrend near the 210-day MA (30 weeks) (Wall around €5) . Key takeaways:
- Clinical advances on lanifibranor
- Financing and partnerships (including rumors from US pharmaceutical giants)
- Cash flow increasing until mid-2026.
Analysts' speculative price target around €8. Everything will depend on the feedback from lanifibranor's advances. The Chinese paid $10 million as part of a partnership. I have a PRU of €2.93. I'm sticking with this company for the long term.
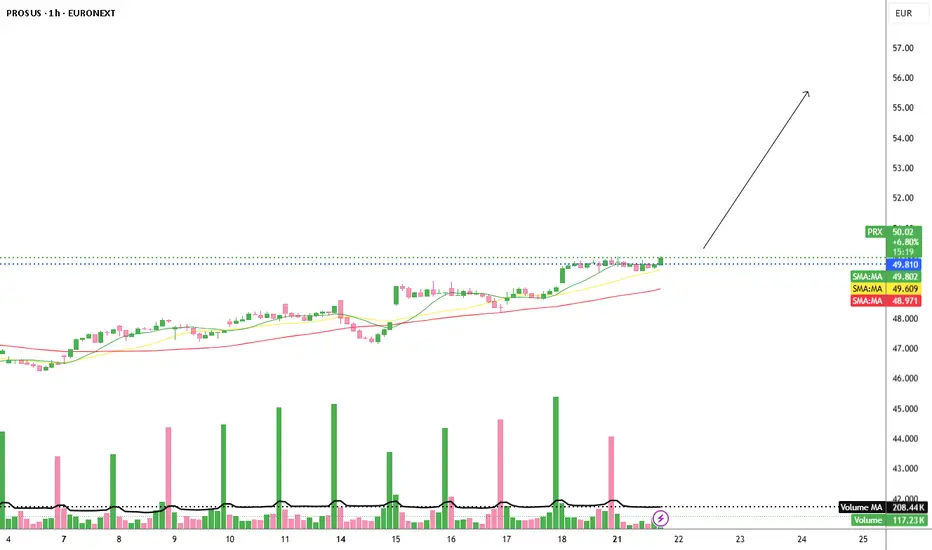
Prosus N.V. – Hidden Giant with Breakout PotentiaFollowing a strong bullish trend in July, Prosus N.V. is already up 8% month-to-date, and things are heating up. The company is reportedly in talks to acquire Just Eat Takeaway.
However, since Prosus already holds a 24% stake in Delivery Hero, the EU antitrust body has pushed back. Prosus has responded by offering to cut its Delivery Hero stake down to 10%, which could pave the way for regulatory approval.
But beyond the headlines, Prosus is a hidden champion in the European tech sector – with a market cap near €120 billion. The company is a global investor and operator in digital platforms, e-commerce, online classifieds, food delivery, fintech, and increasingly, artificial intelligence. With holdings across high-growth tech assets and a long-term strategy focused on unlocking value, Prosus has a positive, innovation-driven outlook, also constantly implementing AI-infrastructure.
From a technical perspective, the chart is clean and convincing: bullish continuation patterns forming repeatedly, always accompanied by decreasing volume during consolidations – a classic sign of strength. On the daily chart, Prosus is comfortably trading above its 10, 21, and 50 moving averages, indicating strong momentum and trend-following alignment. Especially in the last few sessions, we’ve seen a tight consolidation just beneath the 2021 all-time high, with volume drying up – often a precursor to an explosive move.
Should the Just Eat deal go through, Prosus could quickly push toward the €60 level, aligning with Wall Street targets and implying ~20% upside from current levels. Notably, the RSI remains below overbought, leaving room for a healthy push higher.
One cannot overlook the company’s strategic stake in Tencent, which remains a massive value anchor. Tencent not only provides financial muscle but also ongoing exposure to Asia’s tech innovation – something Prosus continues to leverage smartly.
With solid fundamentals, technical momentum, and a major catalyst on the table, Prosus looks well-positioned for Q3 and Q4 2025.
best, gqt
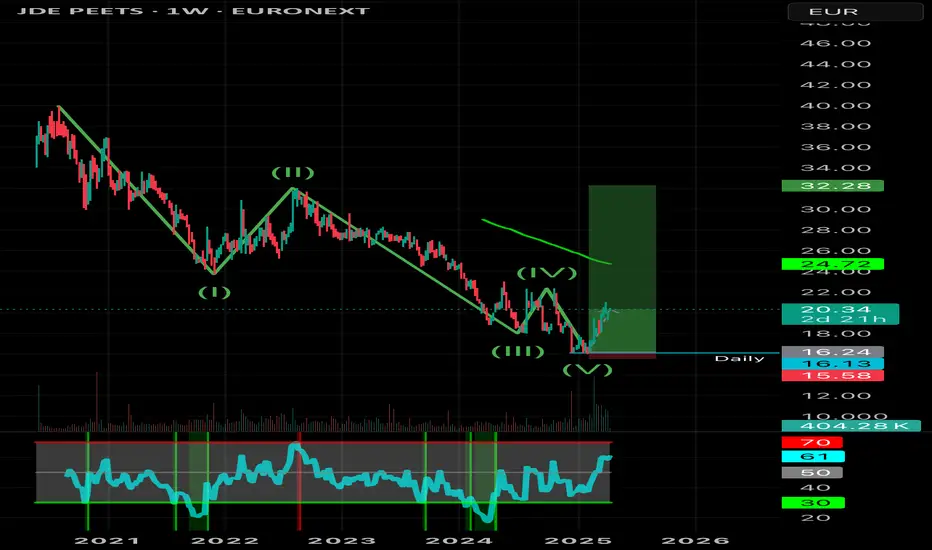
Capital rotationIf you follow my trades you know I was bearish US tech stocks before the drop. I’ve recently been selling my gold as it was breaking all time highs. I was positioned in European stocks like Nestle, which I have mostly exited now. JDEP is another swing trade I entered, I still believe there’s more room to the upside here. This was my inverse coffee bean play and it’s been working out perfectly. Trailing stop loss is a useful risk management tool.
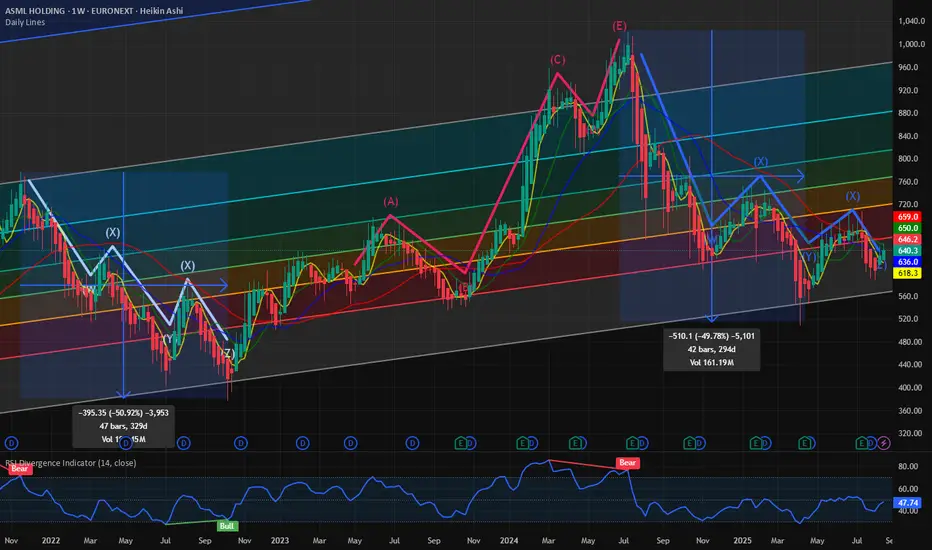
$ASML: Is the stock primed for upside? Indicators are aligned.NASDAQ:ASML is one of the very few semis cap equipment cos. which have not broken out of their previous ATH. The stock is still at lower bound of the upward slopping channel which we have been following for a few months in this blog.
IN this chart below we are following a combination of various technical indicators to see the path of least resistance for the stock. The stock every time bounces back from the lower bound of the upward slopping fib retracement channel. During the 2022 bear market the stock made lower lows and after 5th leg of the bearish pattern on the Elliot’s wave the stock finally made its lows after 329 days of trading and down almost 50%. From its lows it also perfectly followed a textbook rally in 5 legs perfectly matching a bullish Eliots wave pattern before reaching ATH of 1030 $. The recent drawdown on the stock also happened when the stock went above the channel and was slammed back into penalty box by the sellers.
Surprisingly the stock also followed the same Eliots wave bearish pattern downwards and the price bottomed at the lows of the channel now almost 2 times in the weekly chart shown below. Each time the stock had a drawdown of almost 50% in 2 instances. As the stock is going sideways for quite a few weeks we can expect some bullish price action with 980 $ in the upper limit.
Verdict: NASDAQ:ASML in an accumulation pattern. Major upside expected with 980 as our price target.
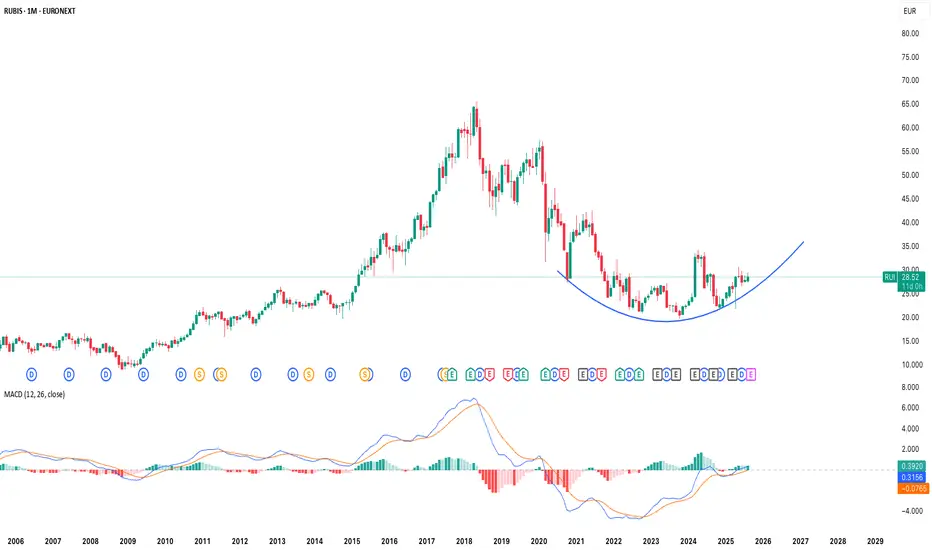
Rubis (RUI:EPA) - A Deep Value Infrastructure Play - TP: 60 EUR📌 Investment Thesis
Rubis is a small-cap European energy distributor undergoing a strategic transformation. Traditionally focused on downstream oil and gas distribution, the group divested its storage business in 2023 and has since begun allocating capital into renewable electricity generation in France, Italy, and Spain. This pivot is supported by favorable EU and French regulatory frameworks designed to accelerate decarbonization.
Despite several years of share price weakness, 2024 saw the entry of heavyweight French industrial investors:
• Vincent Bolloré acquired ~6% of shares.
• Patrick Molis’ Compagnie Nationale de Navigation (CNN) holds ~9%.
Their presence and reshffling of the management Board validates Rubis’ new strategic direction and strengthens its long-term shareholder base.
📈 Technical check
After several years in a pronounced downtrend, Rubis shares have been building a base since the second half of 2023. Early 2024 marked the initiation of a trend reversal, confirmed by higher lows and improved momentum indicators. The stock is currently trading well below its 2018 all-time high of ~€65, but the technical setup suggests that, upon confirmation of the reversal, Rubis could progressively retrace back toward those levels. A sustained break above resistance in the mid-40s would open the path to a multi-year recovery cycle, in line with the company’s strategic repositioning.
🌍 Macro Backdrop
• European equities regain traction: After years of underperformance, Europe returned to the spotlight in 2024, benefiting from capital rotation out of US mega-caps and geopolitical shifts under the Trump administration.
• Energy security meets energy transition: The EU seeks to balance renewable capacity growth with hydrocarbon reliability. Rubis straddles both worlds.
• Valuation support: European energy mid-caps continue to trade at a discount versus US peers, making Rubis attractive for contrarian investors.
⚡ Strategic & Financial Drivers
1. Shift to Renewables – Through its subsidiary Photosol, Rubis already operates 535 MW of solar capacity with a pipeline exceeding 3 GW, targeting 3.5 GW in operation by 2030.
2. Stable Downstream Franchise – Distribution of LPG, fuels, and bitumen across 40+ countries remains a resilient, cash-generating core. EBITDA for the fill FY2024 was €730m, with the distribution business ("retail and Marketing) accounting for 95% of it..
3. Dividend Aristocrat Status – Rubis has increased its dividend for 28 consecutive years, delivering an impressive 8% CAGR in dividend per share (DPS) over the past decade. With a forward yield of ~7.2% by 2026, it ranks among Europe’s most attractive income stocks .
4. Strong Financials – Historical EPS CAGR of 9% over 10 years, >100% free cash flow conversion (2011–2021), and conservative leverage (<2x corporate net debt/EBITDA) ensure balance sheet resilience .
5. Influential Shareholders – Bolloré and CNN’s stakes provide confidence in governance and long-term optionality.
🚨 Risks
• Execution risk in scaling renewables profitably.
• Structural long-term decline of oil & gas distribution volumes.
• Regulatory and taxation headwinds on fossil fuels in Europe.
• Delay in commercial operation of solar plants
🧭 Conclusion
Rubis combines the resilience of a cash-generating downstream franchise with the growth optionality of renewables, backed by a 28-year record of dividend growth. Trading at a discount to peers (p.e. of 8.6x), with a forward yield of 7%+ and validation from industrial shareholders, Rubis stands out as a contrarian long-term income and transition play in European infrastructure.
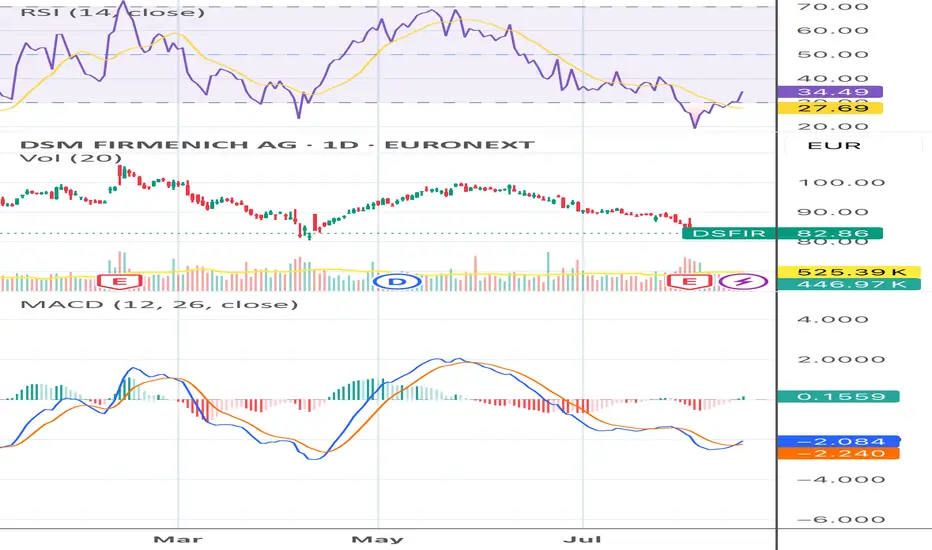
Keep an eye on DSFIR. This might be a good opportunityDSM-Firmenich (DSFIR) is at a crossroads, trading at two-year lows with technicals pointing towards oversold. While there is bounce potential, the prevailing downtrend demands caution. A patient, incremental approach is advised - small entry now, larger position if signs of stabilization emerge. This is not an “all-in” moment, but a candidate for disciplined, tactical accumulation. I keep this in my potential to invest category. Not moving in yet.
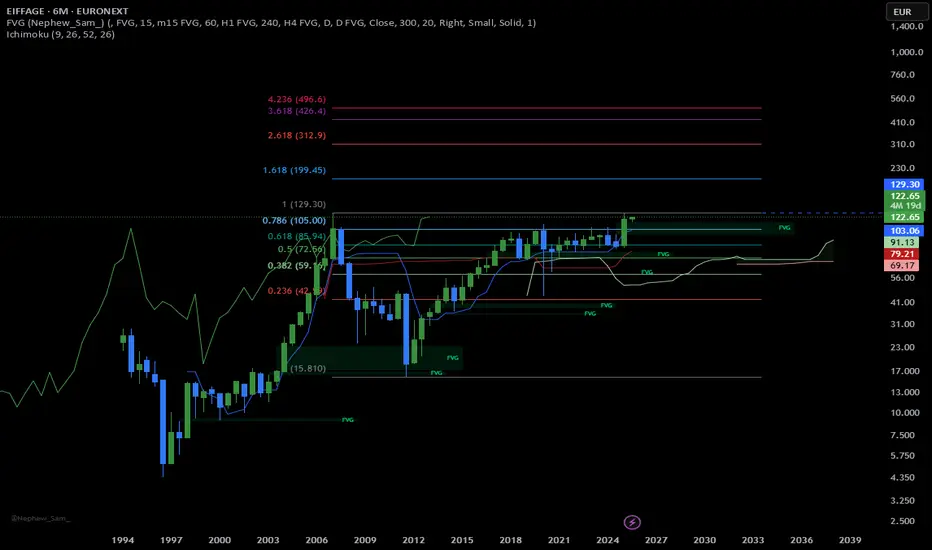
A first target might be 129.30 and then...Another target might be 199.45 that is a Fibonacci level.
On a long term basis.
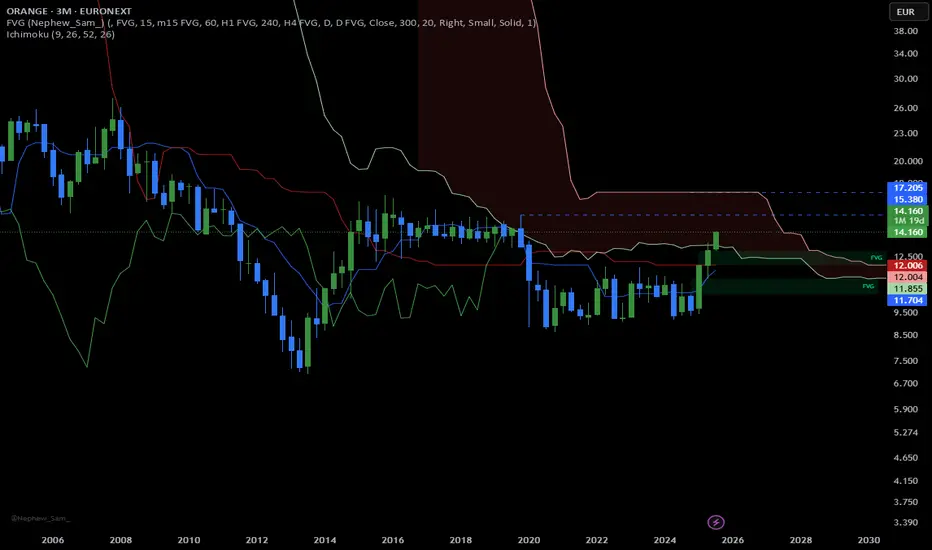
Next target could be 15.38015.380 being a last higher high.
If this level is reached then the next one might be 17.205.
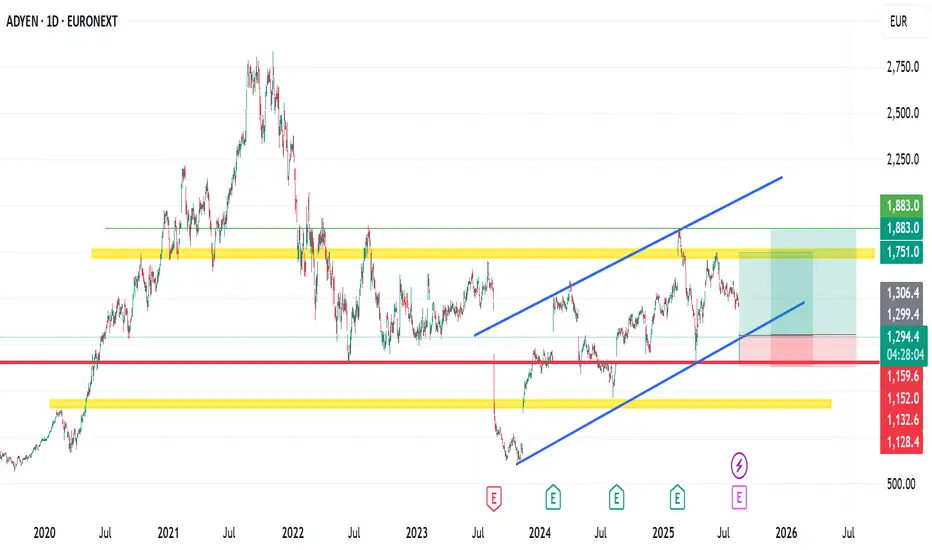
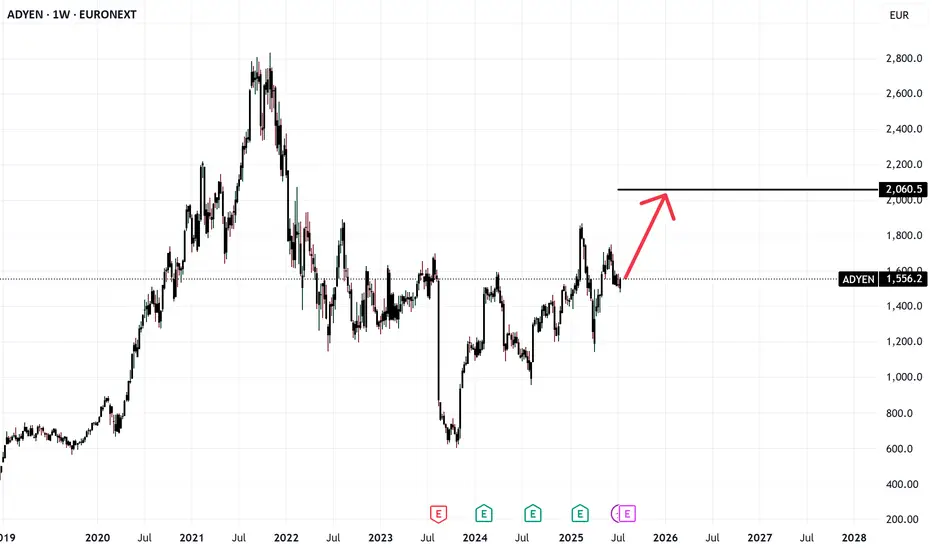
Adyen's stock price experienced a significant dropAdyen's stock price experienced a significant drop.
ADYEN plunged about 18% the past 24 hours. This decline followed the release of the company's half-year results, which revealed slower revenue growth and a lowered full-year outlook
Looking at the stock technically, I see that it is trading in an ascending channel. The market dropped to as low as €1,160 in the past 24 hours, but it has recovered and is currently at €1,300 zone.
I expect the market to move from here, and my first take profit target is around 1,330. The second take profit target is at €1,880.
It's currently trading in an ascending channel and has come back to hit the channel support.
As usual, my target is mid to long term.
I look forward to connecting with you.
Please, like, share, follow me and share your thoughts in the comment section
ASML enters buy zone and will posibly rotate to uptrend again.ASML is lagging behind after stagnated growth and a weak order intake due to china chip machine restrictions and uncertaincy about chip machine import tarrifs. It looks like tarrifs on chip machinery is settled and companies will likely place orders again after internal investment approvals.
Earnings of alphabet, microsoft, meta and amazon have confirmed stronger growth in AI datacenter chips than expected and more demand than production, therefore more ASML EUV machines are neceserry to fullfill production needs.
The chart analysis is in the lower range and lower P/E ~26 zone, very cheap for this company which is the monopolist in the EUV machines and therefore undervalued based on history.


TTE: Fundamental Analysis +56 %With 2024 revenue of 195,6 billions €, Total Energies ranks among the top 10 largest energy companies in the world. EverStock identifies a fundamental revaluation potential of + 56 %.
Valuation at 7.3x net earnings
Currently valued at 115,7 billions € in market capitalization, Total Energies posted a profit of 15,76 billions € in its latest fiscal year (2024).
Balance sheet and debt
In Total Energies annual report, tangible net asset value stood at 83,62 billions €, giving a market capitalization / tangible net asset value ratio of 1.38.
The gearing ratio is good, at 0.44. (Total financial debt / net tangible assets valuation)
Current share price : 51.46 €
Target price : 80,12 €
Upside potential : +56 %
Dividend : 3.30 € (per year)
Yield : 6.41 %

Adyen Margin ExpansionExpecting salary expenses to flatten more + payoffs from investments made in 2023-2024 to have a positive payout
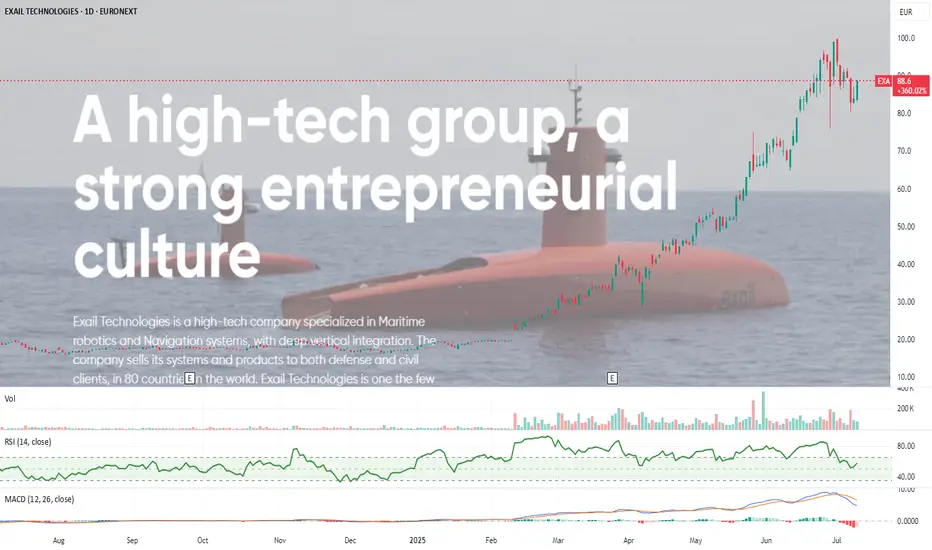
Exail Technologies European Drone Warfare and Robotics. Exail Technologies (previously Groupe Gorge S.A.) is a French tech company specializing in drones, robotics, and maritime autonomous systems, with growing exposure to defense and industrial markets.
It’s on a clear uptrend, sitting well above its 50 and 200-day EMAs with momentum firmly in play. Volume is steady, with recent trading activity picking up compared to its long-term averages, reflecting consistent investor interest.
If you’re looking for a high-growth, high-momentum play in the drone warfare / European tech space, Exail is showing strength. Just keep an eye out for a pullback, which could offer a cleaner entry without chasing the current highs.
Might be worth a watch.
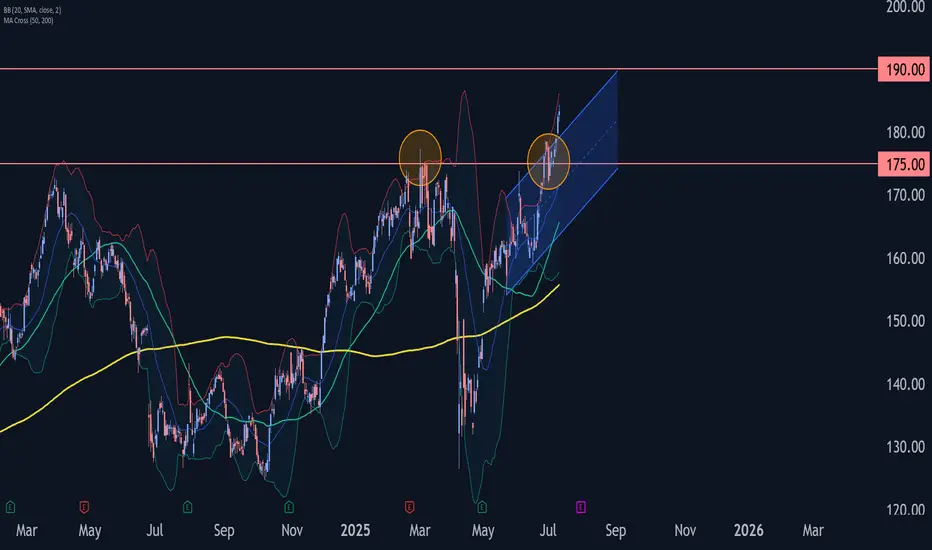
Airbus Wave Analysis – 10 July 2025- Airbus broke resistance zone
- Likely to rise to resistance level 190.00
Airbus recently broke the resistance zone lying between the resistance level 175.00 (which started the earlier sharp downward correction in March, as can be seen from the Airbus chart below) and the resistance trendline of the daily up channel from May.
The breakout of this resistance zone accelerated the active short-term impulse wave iii of the impulse 3 of the intermediate impulse wave (3) from April.
Given the clear daily uptrend, Airbus can be expected to rise to the next resistance level 190.00 (target for the completion of the active impulse wave iii).
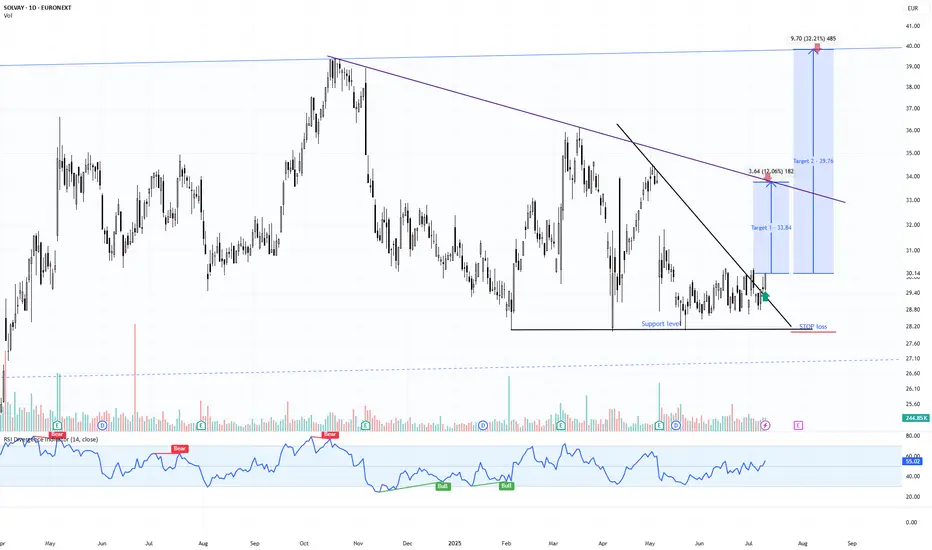
SOLB | Confirmed Descending Triangle Breakout – 32% Target📍 Ticker:
SOLB (Solvay SA – Euronext Brussels)
📆 Timeframe: 1D (Daily)
📉 Price: €30.14
📈 Pattern: Descending triangle breakout confirmed on daily close
📊 Breakout Probability estimation: ~73% (short-term triangle breakout upward)
🔍 Technical Setup (Updated on Daily Chart):
Solvay has now confirmed the breakout on the daily timeframe, closing above both the horizontal support and the descending trendline. This marks a multi-timeframe confluence breakout, increasing confidence in the projected move toward upper resistance levels.
✅ Daily candle close above descending resistance
✅ RSI breakout above 55, building momentum
📉 Stop clearly defined under €27.90 → optimal risk profile
📊 Volume expanding, validating move
🧠 Updated Trade Plan:
📥 Entry Zone: €29.90–€30.50 (daily confirmation)
⛔ Stop-Loss: Below €27.90
🔁 Hold while structure remains above descending trendline support
🎯 Upside Targets & Potential Return (from €30.14)
🎯 Target Price Return
Target 1 €33.84 +12.06%
Target 2 €39.76 +32.21%
📊 Pattern Probability – Daily Structure:
📐 Pattern: Descending Triangle Breakout
🔺 Upward breakout probability: ~73%
🎯 Full measured move supports Target 2 if buyers remain active
⚠️ Technical Signals to Watch:
🔎 Retest of descending line on lower volume = strong
✅ RSI > 55 with bullish structure
📈 Rising volume → growing institutional interest
📊 Price reclaiming structure from broader daily consolidation
💬 Solvay is transitioning from a textbook 4H breakout to a multi-day continuation setup. The alignment of pattern, structure, and momentum makes this one of the cleaner swing setups on the European market right now.
🔔 Follow @TargetTraders for high-probability technical trades.
#SOLB #BreakoutSetup #DescendingTriangle #TechnicalPattern #SwingTrade #Euronext #TargetTraders #VolumeBreakout #ChartAnalysis
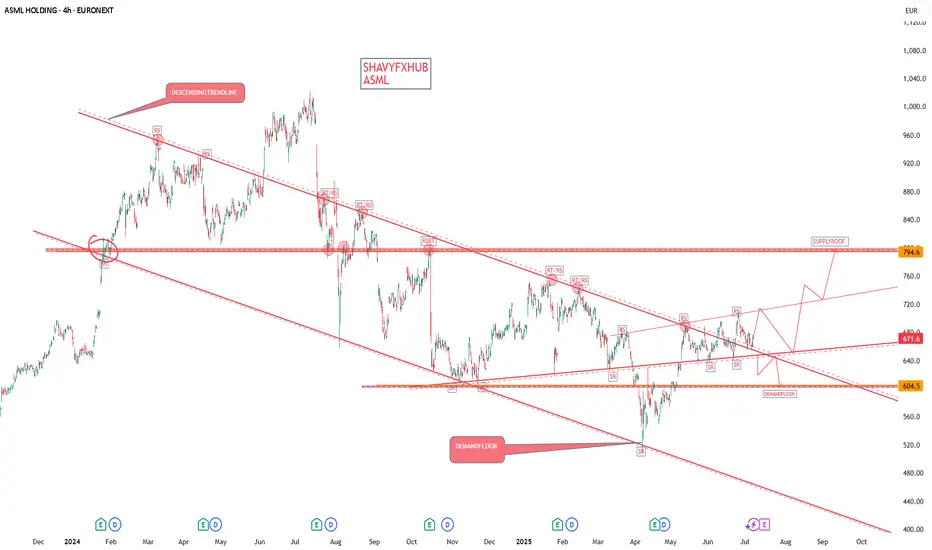
ASMLASML Holding
ASML closed at $671.6 on July 7, 2025.
Market Capitalization:
ASML's market cap is approximately $302–$314 billion as of early July 2025, making it one of the world’s 30 most valuable companies.
Key Financials and Outlook
Next Earnings Release:
Scheduled for July 16, 2025. The consensus estimate for Q2 2025 earnings per share is $5.94, with analysts expecting continued strong performance driven by demand for advanced lithography equipment
Recent Performance:
Q1 2025 EPS: $6.31 (beat consensus by $0.19)
Q1 2025 Revenue: $8.77 billion (above consensus)
Guidance for Q2 2025 Revenue: $7.6–$8.1 billion
Valuation Metrics:
P/E Ratio: Approximately 29.8–35.8, based on trailing earnings.
Dividend: ASML continues its capital return program, including dividends and share buybacks.
Recent Trend:
The stock is currently at a pullback reflecting demand and supply in semiconductor and its equities market
Industry Leadership:
ASML remains the world’s leading supplier of photolithography machines, essential for advanced semiconductor manufacturing. Its EUV (extreme ultraviolet) systems are critical for producing the most advanced chips.
Order Backlog:
The company maintains a robust order backlog, providing revenue visibility despite market volatility.
Global Demand:
Demand from Asia, especially China, continues to be a significant driver, alongside global investments in AI and advanced chip production.
ASML remains a global technology leader with a strong financial position and positive long-term outlook, despite recent share price volatility. The upcoming July 16 earnings report will be closely watched for updated guidance and demand trends in the semiconductor sector
#ASML #AI #STOCKS
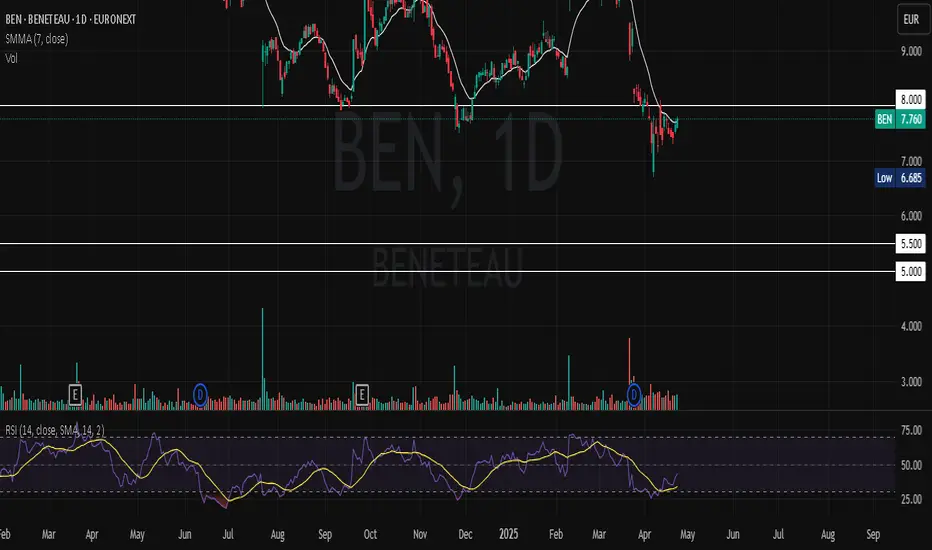
Short on BEN (EURONEXT:BENETEAU)High seller pressure with gaps during the march month
Some bad news: "Shares in Beneteau fall 12.3%, headed for their worst day since September 2023, after the motorboat manufacturer said it expects weaker 2025 sales amid a business slowdown"
Bearish until 5.50
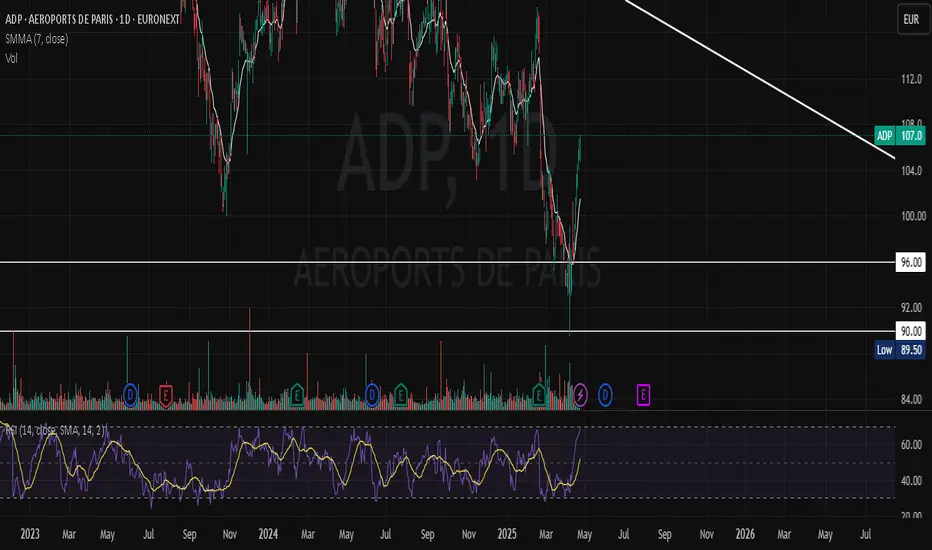
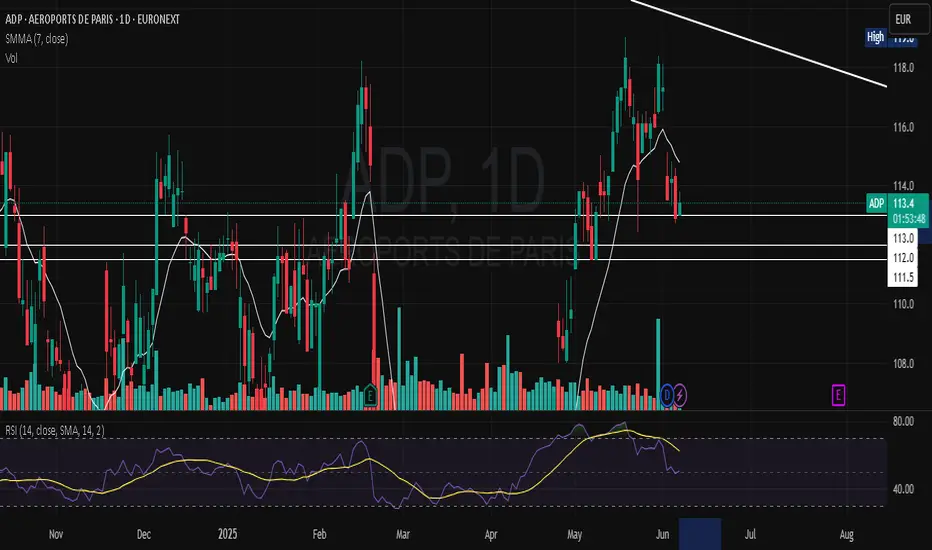
Short on ADP:EURONEXT (Aéroports de Paris)Oversold RSI + Resistance touched twice but never broken + Dividends already paid
Opening price: 113.50 today 06/06/2025
TP set at 112.0
Leverage: x4
Potential gain: 1,30% x 4 = 5,20%
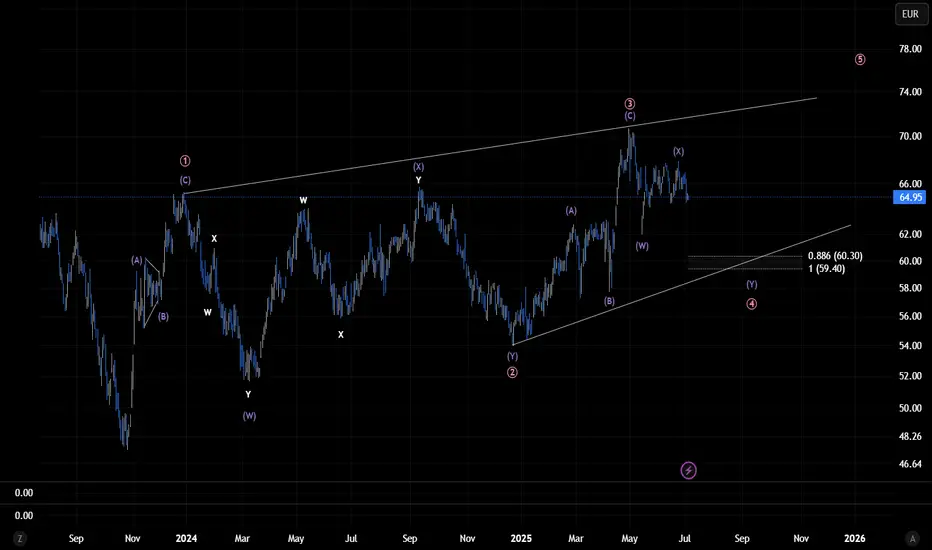
AEDIFICA - Alternative Medium Timeframe Elliot Wave analysisIn this scenario, I’m interpreting the larger Wave 1 as a potential leading contracting diagonal, where each subwave is unfolding as a zigzag (3-3-3-3-3) rather than the typical 5-3-5-3-5 structure.Currently, we appear to be in Wave 4 (Pink) of this diagonal, which seems to be in the final stages of its downward leg before starting Wave 5 the final move of the pattern. The decline in Wave 4 (Pink) may take the form of either a WXY or an ABC correction; continued price development will help validate the count.
I believe this interpretation aligns well with the recent price action, particularly because the market has been moving sideways for quite some time now without delivering a convincing impulsive move to the upside.
Disclaimer: This analysis is for informational and educational purposes only and should not be considered financial or investment advice. All trading involves risk, and you should perform your own due diligence before making any trading decisions. The author is not responsible for any losses that may arise from reliance on this content. Always trade at your own risk. #AED