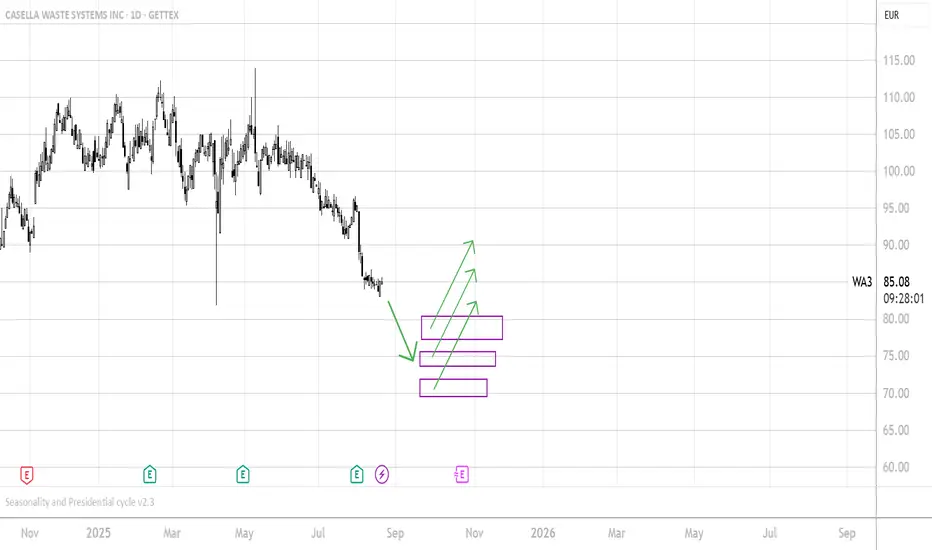
CASELA WASTE SYSTEMSHere are my Thought on Casela Waste Systems:
- from a seasonal perspective it should be bullish from early october until mid of january with an expected gain of median 8% and average 15%.
- from a fractals perspective i am not sure which of the three entry points will work out. maybe this is more a complete entry area.
feel free to contact me, leave a comment or/and support my idea by clicking that rocket.
cheers!
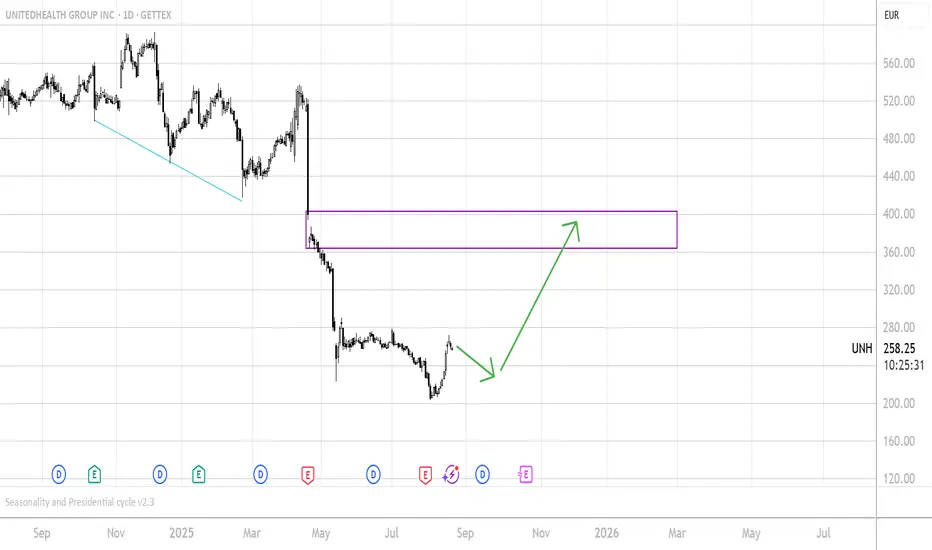
UNITEDHEALTH UNH Long Scenario based on Seasonality and FractalsFrom a fractals Perspective I expect a chance for around 30% gain from an upcoming upmove.
From a Seasonal Perspective I expect a retracement mode until End of Mid/September and then upside until early December.
I hope we make the bigger upmove in this time and complete that move otherwise this fractals target could take some time/moths/years.
Feel free to like / support the Idea, leave a comment or contact me in the chat.
Good luck to all
*this is not a trade call*
Cheers!
Renewables: The U.S. Opens the Door and Europe CelebratesBy Ion Jauregui – Analyst at ActivTrades
The energy transition has received an unexpected boost from the United States. Against restrictive forecasts, the Trump administration finally published the rules that define access for clean energy projects to tax credits. The outcome was surprising: far more lenient regulation than anticipated. What many expected to be a regulatory maze turned out to look more like a beginner’s sudoku.
The impact was quickly felt in Europe. Vestas Wind Systems A/S (CPH:VWS), a leader in wind turbines, experienced its best trading day since July 2022, soaring 18%. Optimism spread to other sector giants such as Siemens Energy AG (ETR:ENR) and GE Vernova, the renewables division of General Electric (NYSE:GE), which now see a clearer path ahead for rising orders.
U.S. Flexes, Europe Accelerates
In Europe, the development of clean energy has been driven by ambitious climate targets and a favorable regulatory environment, albeit with bureaucratic hurdles in permitting and grid connections. The U.S. decision—ironically under a government traditionally skeptical of green policies—puts the country in a competitive position: attractive tax credits, greater legal certainty for investors, and a framework that could draw European capital stateside.
Europe, however, still holds the advantage in industrial expertise and value chains. Manufacturers such as Vestas and Siemens Gamesa have spent years consolidating their global leadership. The new U.S. framework does not erase that advantage but does level the playing field, with transatlantic companies set to be the main beneficiaries.
Market Outlook
From a technical standpoint, Vestas is in a buying frenzy after breaking key resistance at 170 Danish crowns, with short-term potential to test 185. Siemens Energy, still grappling with financial issues, could use the momentum to stabilize above €20, while GE Vernova gains visibility within General Electric, whose immediate support stands at $147.
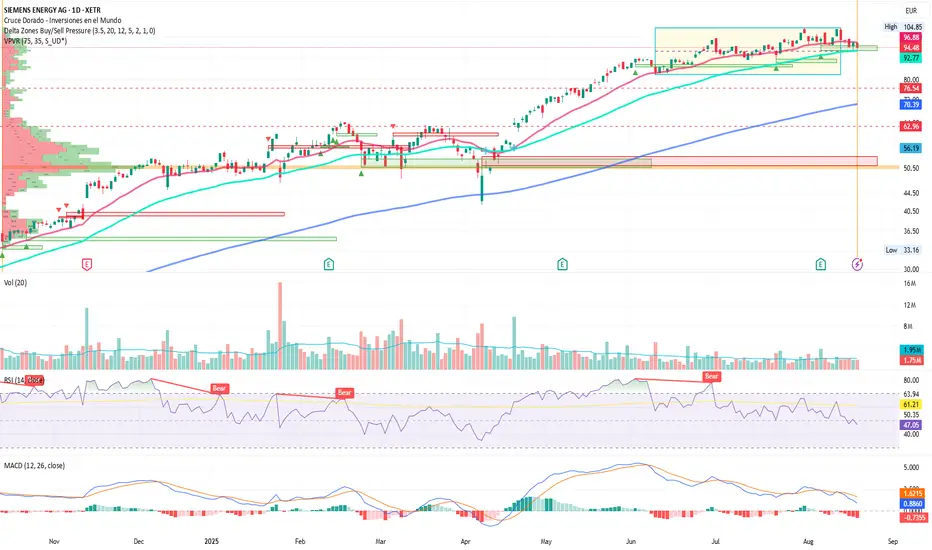
Siemens Energy Analysis
Advantage Regained with U.S. Support
Siemens Energy reported record orders of €16.6 billion in the second quarter alone, with a backlog reaching €136 billion, driven by strong U.S. demand, especially for data center power plants. Revenue rose 13.5% to €9.7 billion, while net profit hit €697 million, compared to a loss the year prior. Despite a €100 million tariff headwind, the company expects to reach the upper range of its guidance (13–15% sales growth, margin before special items at 4–6%), showcasing solid recovery and increasing investor confidence.
Medium-Term Bullish Trend
From a technical perspective, the trend since April has been bullish, supported by a golden cross that pushed prices to late-July highs, retested in early August. The price currently sits on the 100-day moving average, having lost the 50-day support. RSI is at 47.05%, and MACD shows a corrective move with the histogram trending downward into negative territory. Average volume holds at 1.95M. The strongest bearish pressure aligns with the Point of Control (POC) at €50.50, while bullish pressure zones coincide with the consolidation range between €104.85 and €82.34. The key level to watch is above €100: a breakout would confirm stronger upside momentum. Failure to hold current levels could see supports tested at €76.54 and €62.96.
Tailwind Effect
The renewed tailwind from the U.S. marks a significant shift: the energy transition is no longer a solely European effort but a global race where regulatory flexibility can accelerate investment. If Europe sustains its technological leadership while the U.S. offers a more attractive fiscal framework, the renewable sector may enter a new phase of synchronized growth on both sides of the Atlantic.
*******************************************************************************************
La información facilitada no constituye un análisis de inversiones. El material no se ha elaborado de conformidad con los requisitos legales destinados a promover la independencia de los informes de inversiones y, como tal, debe considerarse una comunicación comercial.
Toda la información ha sido preparada por ActivTrades ("AT"). La información no contiene un registro de los precios de AT, o una oferta o solicitud de una transacción en cualquier instrumento financiero. Ninguna representación o garantía se da en cuanto a la exactitud o integridad de esta información.
Cualquier material proporcionado no tiene en cuenta el objetivo específico de inversión y la situación financiera de cualquier persona que pueda recibirlo. La rentabilidad pasada y las estimaciones no sinónimo ni un indicador fiable de la rentabilidad futura. AT presta un servicio exclusivamente de ejecución. En consecuencia, toda persona que actúe sobre la base de la información facilitada lo hace por su cuenta y riesgo. Los tipos de interés pueden cambiar. El riesgo político es impredecible. Las acciones de los bancos centrales pueden variar. Las herramientas de las plataformas no garantizan el éxito.
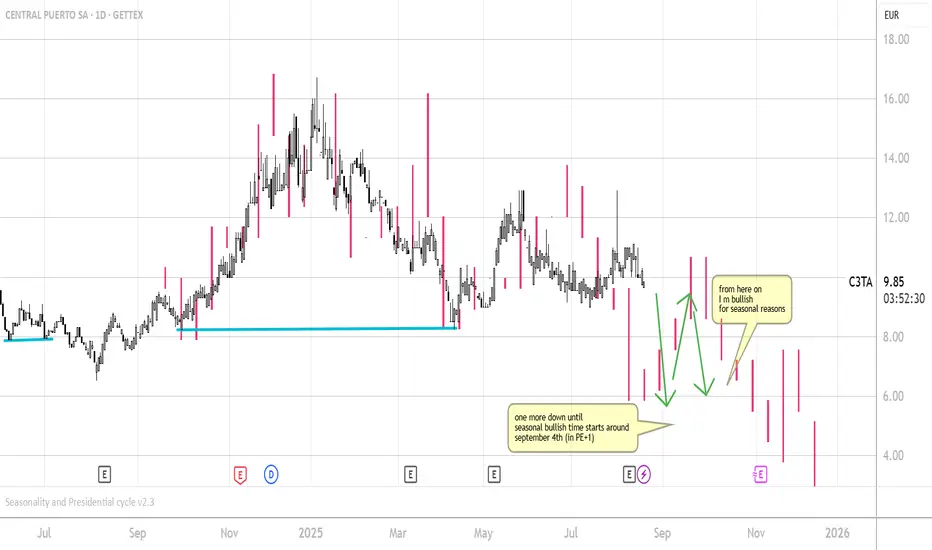
CEPU - CEENTRAL PUERTO - ForecastSee Describtion in the Chart.
From a fractals perspective I see one more down at least.
From a Seasonality standpoint and perspective
I am looking to get into a longerterm trade.
Bullish from Mid of October at latest.
Support my idea when you like it and find it valid.
Correct me in the comments or chat with me.
Cheers!
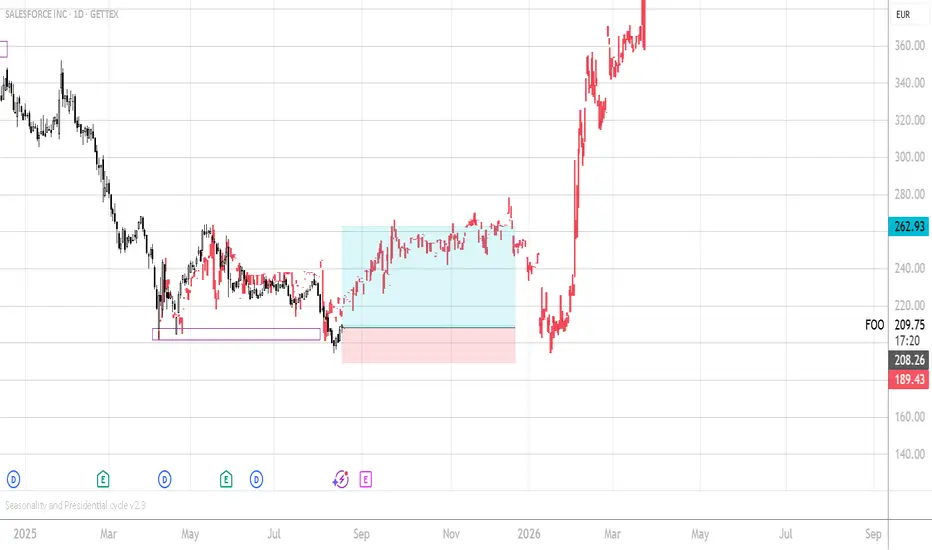
SALESFORCE - CRM - Fractal found and applied to the chart - LONGThis is not a trade call. I am new to fractals trading. ;-)
In addition to what I see a strong bullish move from a seasonal perspective.
Trade is active with a 7% stopploss which is historically the max drawdown for a CRM trade starting from today until early October.
Cheers and good luck!
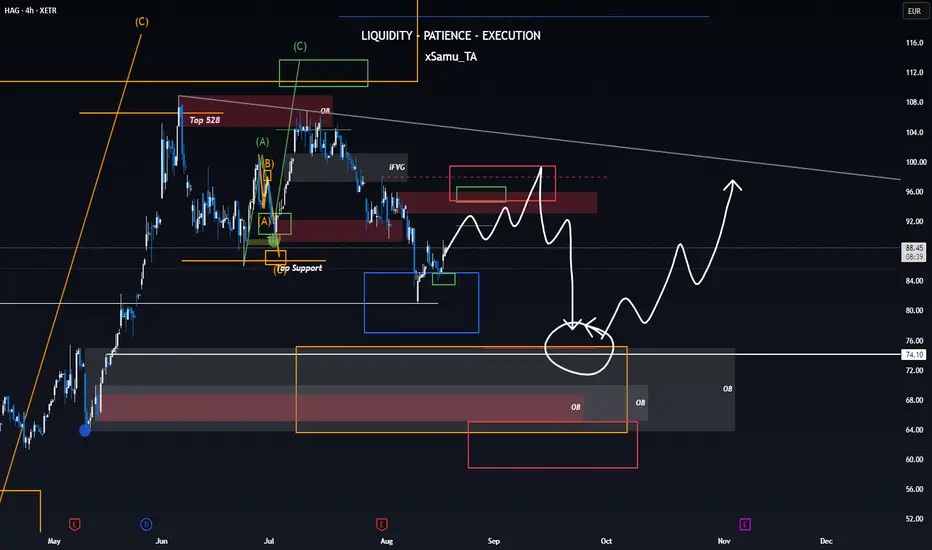
Hensoldt not done correctingIn my opinion, HAG isn’t done correcting on the higher timeframe. A small relief rally to the upside might come, but the spot where we gathered strength feels far too insignificant. I’m still waiting for the big levels—our orange correction zone—to pave the way for a healthy upside.
That’s why I’m looking for an SFP at the red dashed line before we continue lower.
Invalidation: a clean 12h close above the red dashed line, ideally backed by an attack on the topside trend.
Patience is key ⚔️ the chart will tell us when it’s ready. Watch. Wait. Win. 🧙
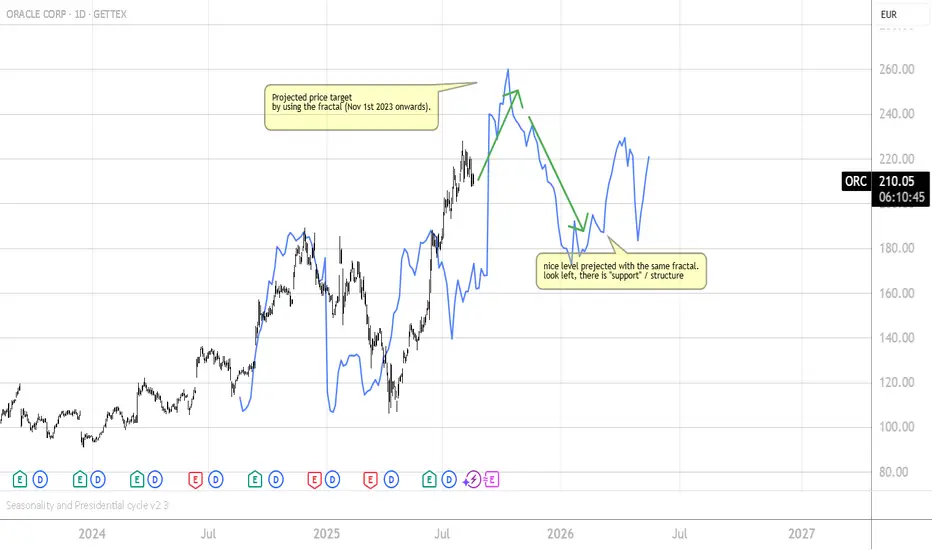
ORACLE ORCL Fractal ProjectionI applied fractal analysis and this worked out nicely on the chart.
the projection suggests, that there might be a last upmove to the level mentioned in the chart. afterwards a correction to the stracture level noticeable to the left side.
what did I do right? what did I do wrong? I am new to using fractals on the chart while knowing for a long time that -everything- is growing, decaying, going, moving,.... in factals.
leave a like or comment or say hello in the privat chat!
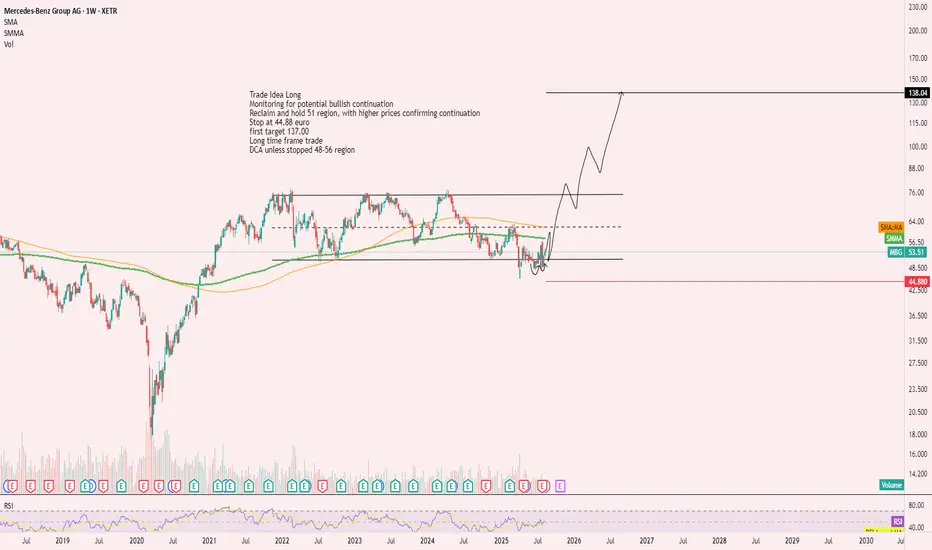
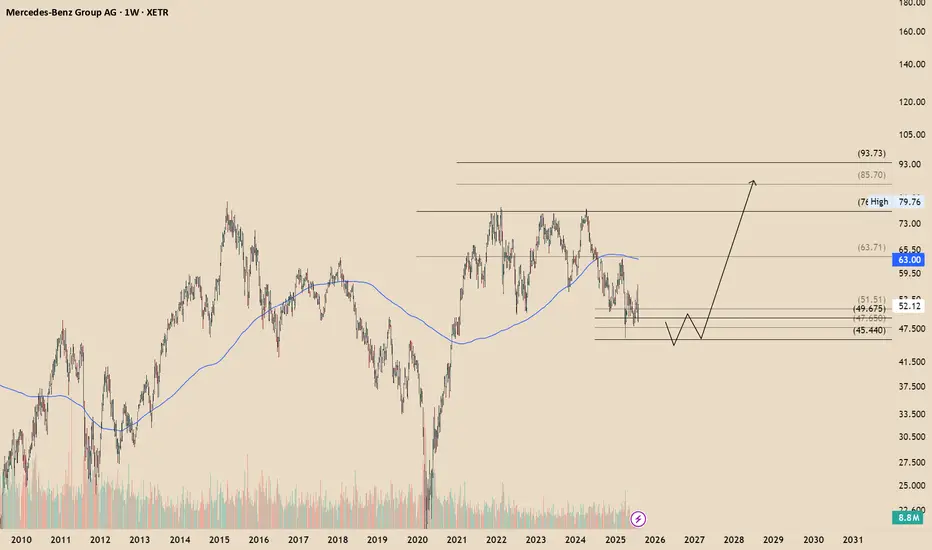
Trade Idea Long MBGMonitoring for potential bullish continuation
Weekly Timframe
Reclaim and hold 51 region, with higher prices confirming continuation
Stop at 44.88 euro
first target 137.00
Long time frame trade
DCA unless stopped 48-56 region
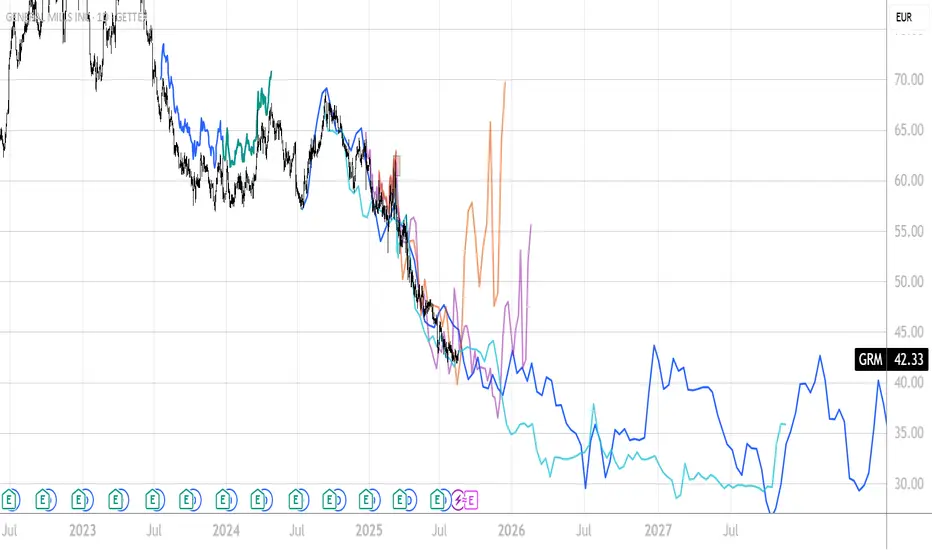
GENERAL MILLS - GIS - MY PROBLEM WITH FRACTALS - EDUCATIONAL... The Markets are definitly fractal.
But at the moment I can't decide...
Maybe someone can help me out?
All in all GIS dropped a huge lot and might present a good entry price for a medium to long term investor / trader...
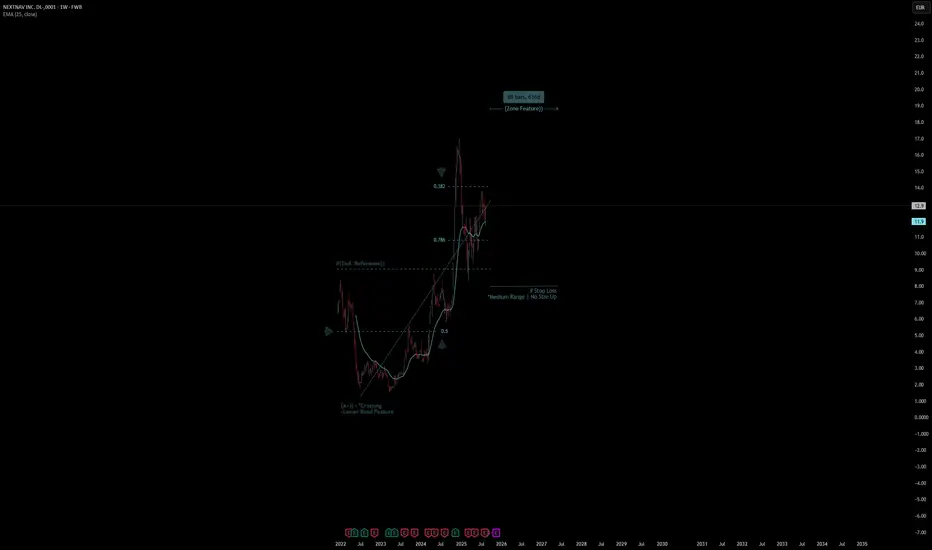
NEXTNAV INC | Chart & Forecast SummaryKey Indicators On Trade Set Up In General
1. Push Set Up
2. Range Set Up
3. Break & Retest Set Up
Notes On Session
# NEXTNAV INC
- Double Formation
* (A+)) - *Crossing - Lower Band Feature - *Retest Entry - *25EMA | Subdivision 1
* #(2nd. Reference)) | No Size Up | Completed Survey
* 88 bars, 616d | Date Range Method - *(Uptrend Argument))
- Triple Formation
* (P1)) / (P2)) & (P3)) | Subdivision 2
* Weekly Time Frame | Trend Settings Condition | Subdivision 3
- (Hypothesis On Entry Bias)) | Regular Settings
* Stop Loss Feature Varies Regarding To Main Entry And Can Occur Unevenly
- Position On A 1.5RR
* Stop Loss At 8.00 EUR
* Entry At 11.00 EUR
* Take Profit At 16.00 EUR
* (Uptrend Argument)) & No Pattern Confirmation
- Continuation Pattern | Not Valid
- Reversal Pattern | Not Valid
* Ongoing Entry & (Neutral Area))
Active Sessions On Relevant Range & Elemented Probabilities;
European-Session(Upwards) - East Coast-Session(Downwards) - Asian-Session(Ranging)
Conclusion | Trade Plan Execution & Risk Management On Demand;
Overall Consensus | Buy
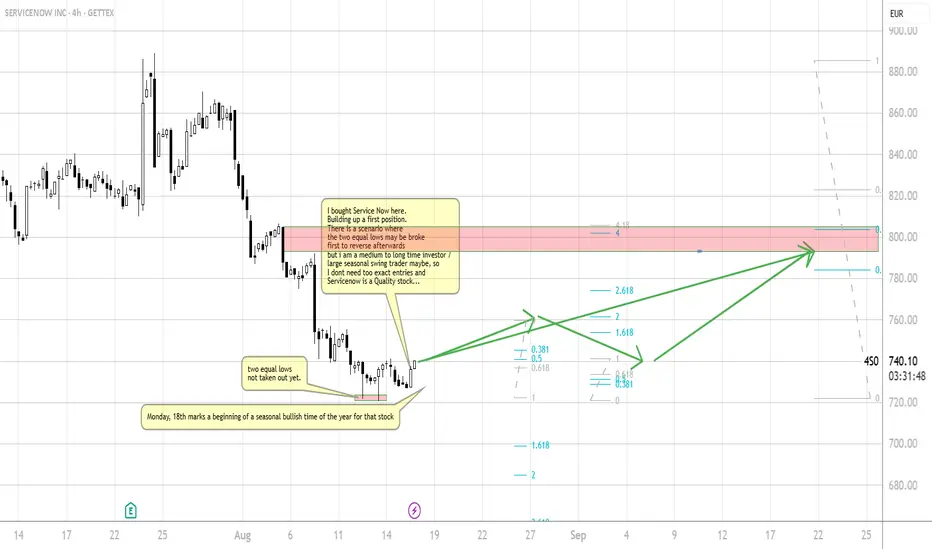
NOW Servicenow Service Now - Long scenarioI bought Service Now here.
Building up a first position.
There is a scenario where
the two equal lows may be broke
first to reverse afterwards
but i am a medium to long time investor /
large seasonal swing trader maybe, so
I dont need too exact entries and
Servicenow is a Quality stock...
this is not a trade call, no financial advice. for educational purpose only....
I d be happy about a like/rocket or comment and a chat with you guys!
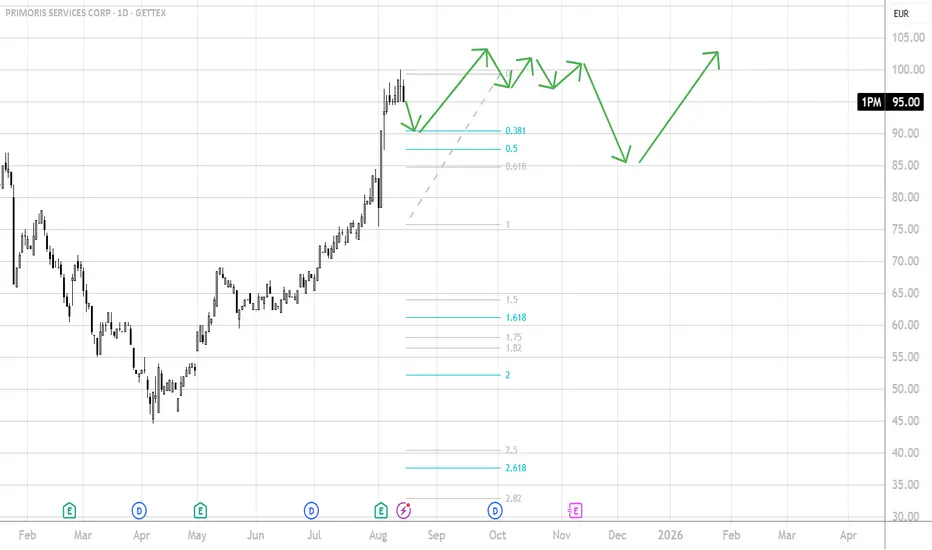
PRIMORIS SERVICES - Seasonal forecastbased on the seasonal data for that stock plotted onto the chart what I believe is likely to happen.
This ins not ment as a trade call. It is for education purpose only.
Comment and/ or chat and please hit the rocket ( like!
Good Luck, Cheers!
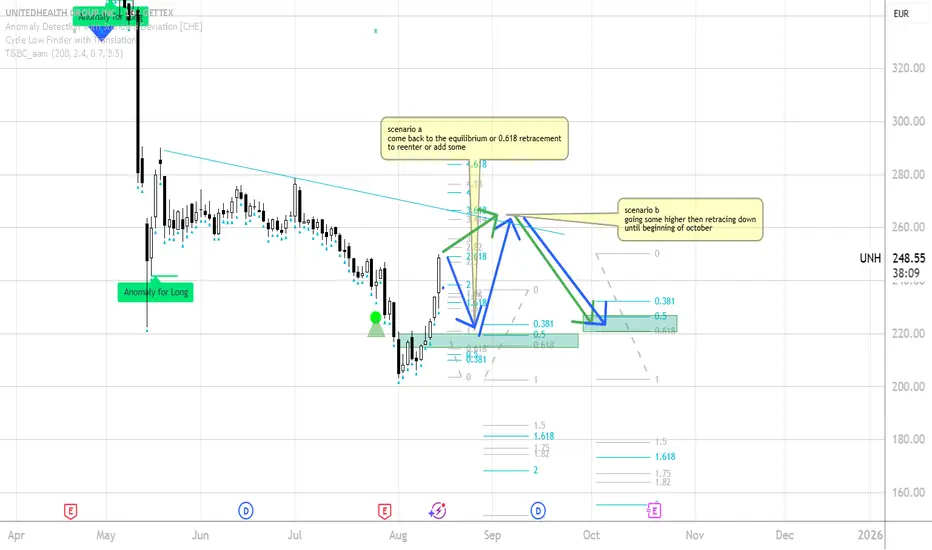
UNITED HEALTH UNH - Two scenarios based on my understanding a sescenario a:
coming back to the 50% or 0.618 retracement then up, then in a typical seasonal bearish period down until beginning of october
scenario b:
First target could be at the descrending trendline then retracement until beginning of october
to the 50% or 0.618
this is of course not a trade call or advide. for educational purpose only...
please comment or chat with me about it!
cheers!
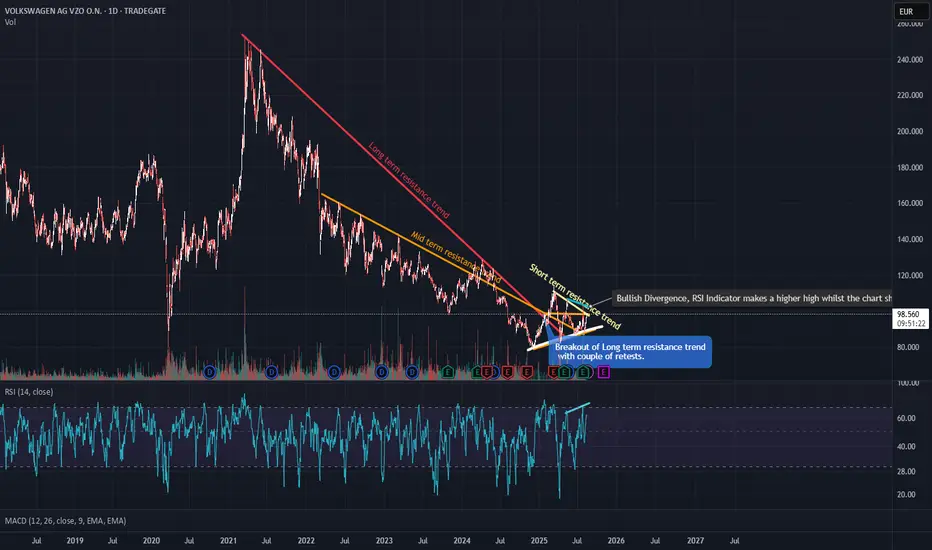
VOW3 Bullish Current price at the moment of the idea: 98.50
Levels like 117 and 134 are interesting levels to take profits and repurchase on corrections of -10%
Earnings surprise was 42% which is pretty high for a big company in the automobile sector.
The chart speaks for itself, please read my comments, happy to discuss.
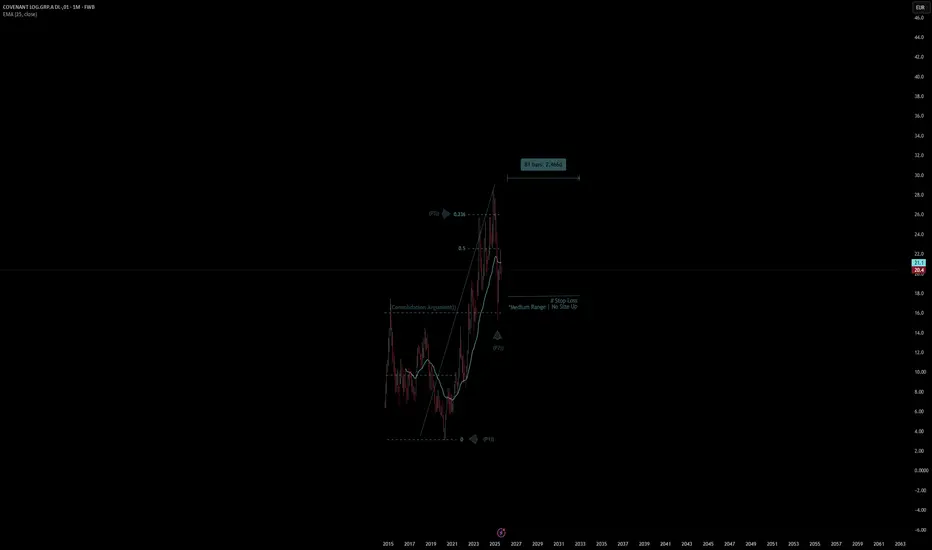
Covenant Log Quote | Chart & Forecast SummaryKey Indicators On Trade Set Up In General
1. Push Set Up
2. Range Set Up
3. Break & Retest Set Up
Notes On Session
# Covenant Log Quote
- Double Formation
* Stop Loss - *Medium Range | No Size Up | Subdivision 1
* (Consolidation Argument)) - *0.5 Retracement Area | Completed Survey
* 81 bars, 2466d | Date Range Method - *(Uptrend Argument))
- Triple Formation
* (P1)) / (P2)) & (P3)) | Subdivision 2
* Monthly Time Frame | Trend Settings Condition | Subdivision 3
- (Hypothesis On Entry Bias)) | Regular Settings
* Stop Loss Feature Varies Regarding To Main Entry And Can Occur Unevenly
- Position On A 1.5RR
* Stop Loss At 15.00 EUR
* Entry At 20.00 EUR
* Take Profit At 28.00 EUR
* (Uptrend Argument)) & No Pattern Confirmation
- Continuation Pattern | Not Valid
- Reversal Pattern | Not Valid
* Ongoing Entry & (Neutral Area))
Active Sessions On Relevant Range & Elemented Probabilities;
European-Session(Upwards) - East Coast-Session(Downwards) - Asian-Session(Ranging)
Conclusion | Trade Plan Execution & Risk Management On Demand;
Overall Consensus | Buy
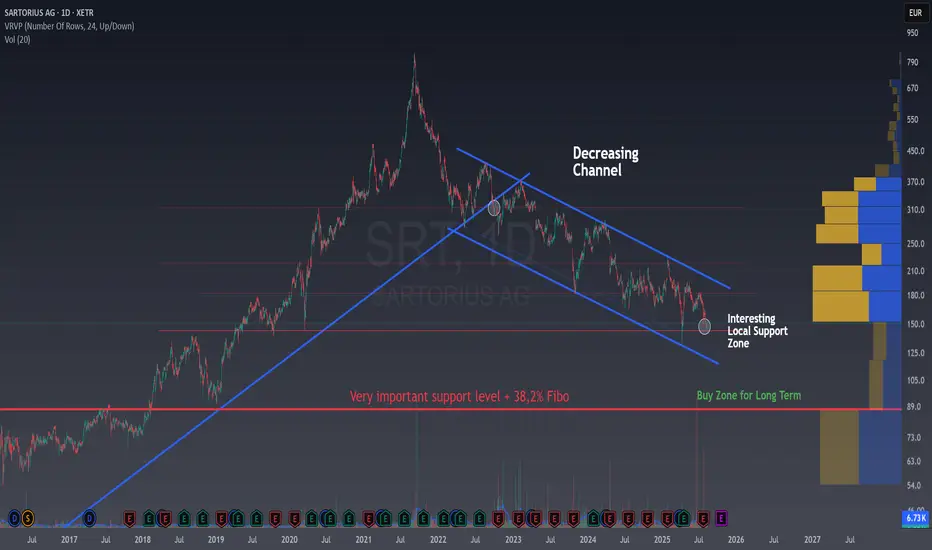
Sartorius: When Opportunities Are Hidden in Lower TimeframesSartorius: When Opportunities Are Hidden in Lower Timeframes
Sartorius is a German company that has delivered an astonishing 30,000% return since 2008.
Yes, you read that right, investing €10,000 back in 2008 would have turned into €3,000,000 by 2021 , thanks in part to a final surge fueled by the COVID-19 boom.
Looking at the long-term weekly chart, we can clearly see a major trendline that was broken, sending the stock into a prolonged downtrend. So far, Sartorius has dropped 80% from its peak, and there might still be room for further declines before reaching key support areas, such as the 38.2% Fibonacci retracement and the pre-COVID highs.
Are we witnessing the last leg down before a major reversal? Or is there more pain to come?
Bounce at Key Local Support — Short-Term Opportunity
Right now, the price is bouncing off a very interesting local support, the same area that previously created a sharp V-shaped bottom . This pattern suggests buyers are stepping in aggressively, seeing these levels as a bargain .
Revisiting this area gives us a potential long entry .
It’s true we could aim for the upper boundary of the current channel for a +30% gain, but placing the stop loss would be tricky, it would need to be relatively wide and against the prevailing trend, which I’m not a fan of.
In situations like this, I zoom into lower timeframes to see if a more precise, short-term setup makes sense.
In this case, we can see that, in the very short term, the price has formed a base and broken above a resistance today. That breakout opens the door for a long trade aiming for a +3.5% return in 2–3 days , with a tight stop loss that still gives plenty of room for price action to breathe.
Based on my analysis of similar historical patterns, the odds of success are over 70%. With probability and risk/reward on our side, let’s go for it!
By first studying the higher timeframe trend and then zooming into the lower timeframes , traders can identify short-term opportunities that align with the broader market direction.
This alignment increases the probability of success, as trades are placed in harmony with the stock’s long-term momentum rather than against it.
💬 Does this setup align with your view on XETR:SRT ?
🚀 Hit the rocket if this helped you spot the opportunity and follow for more easy, educational trade ideas!
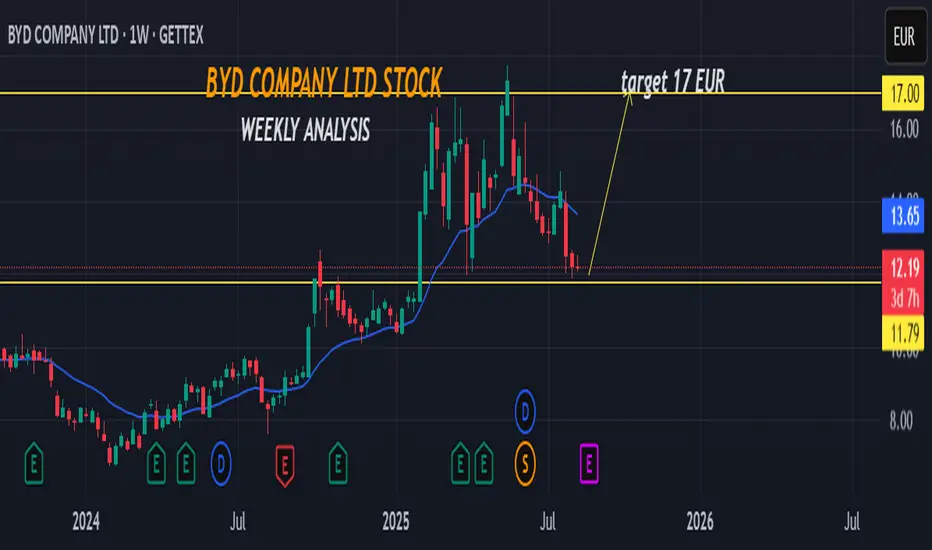
BYD COMPANY LTD STOCK.WEEKLY ANALYSISHello ladies and gentleman.The intrinsic value of one BY6A stock under the base case scenario is 22.15 EUR. Compared to the current market price of 12.1 EUR, BYD Co Ltd is undervalued by 45%.so the is a great probability long to 17 EUR.
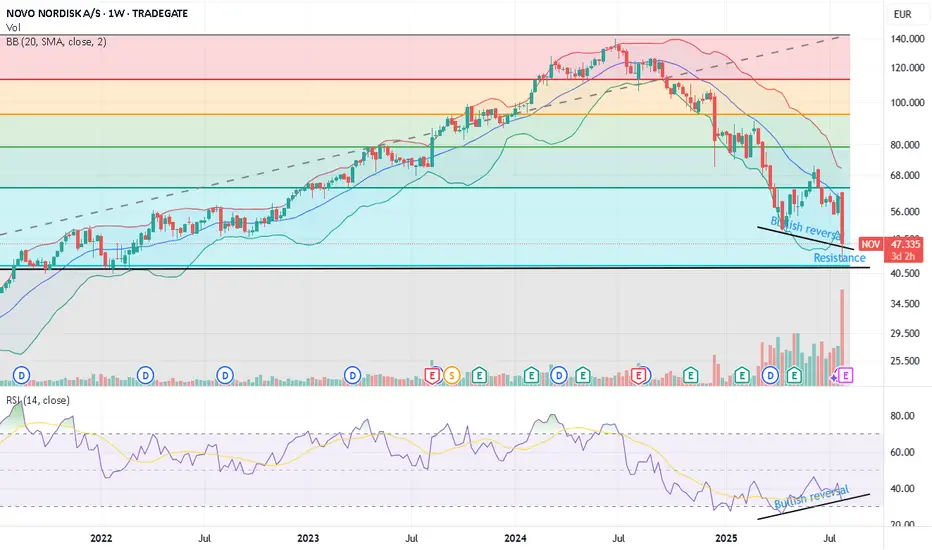
Fib resistance + RSI bullish reversal After the bearish news earlier today, it seems like Novo has had its final capitulation.
There's a fib resistance + historical resistance dating back to '21-'22.
On the weekly, the RSI is also presenting a bullish divergence - although we may want to await the closing of this week to confirm this.
Taking into account strong fundamentals, analyst consensus, it seems like this stock is a BUY!
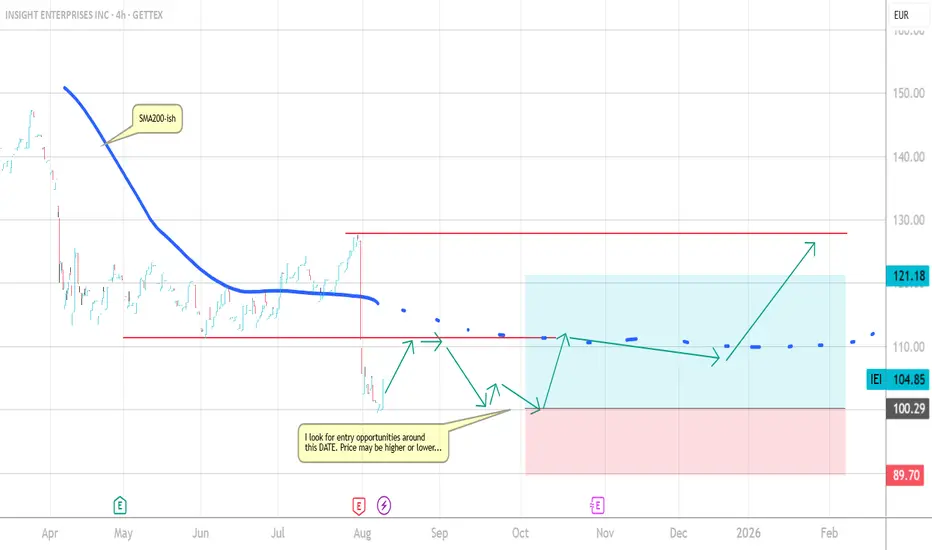
NSIT Insight Enterprises Forecast until early 2026Pretty bad year for NSIT but I see a chance for a rebound coming from early October 2025 with a participation in the x-mas / end of year ralley.
my forecast is shown as arrows in the chart. please feel free to contact me for some
seasonality chat and to get further ideas on that or maybe discuss.
leave a comment. what do you think?
MBG at Support: A Tactical Setup for Bullish ContinuationMBG is currently holding at key algorithmic relevance levels, with its structural setup resting on a well-defined support zone. This positioning indicates latent bullish potential, as price action consolidates above critical thresholds. A move to the upside could serve to mitigate outstanding algorithmic exposures, potentially triggering a cascade of reactive flows and restoring directional bias.
Clinuvel Trend Reversal?EWT: Since the crash caused by the pandemic, there could be a huge ABC correction ongoing. It seems the chart has now broken out of the ascending triangle and above some key moving averages. A hold here could indicate a trend reversal. Open to other opinions!

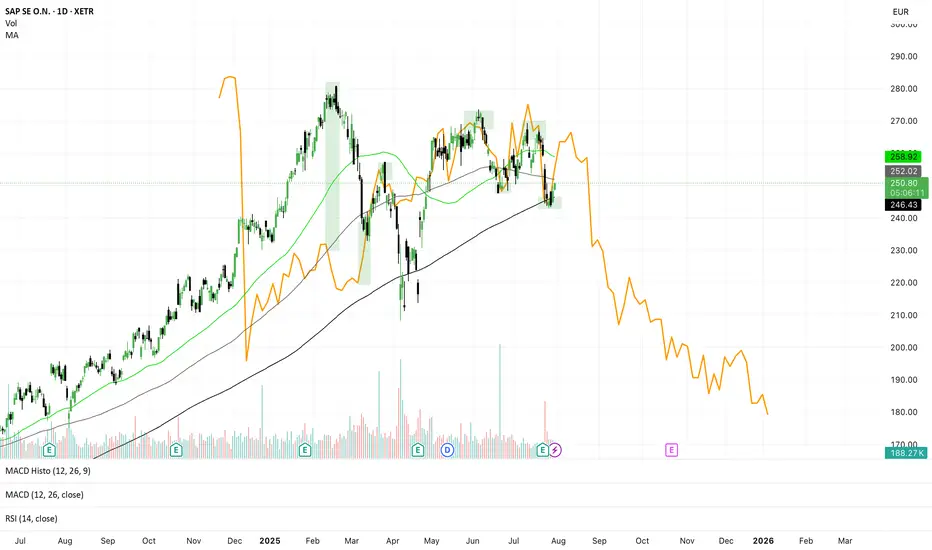
SAP Gann-Method... down potential📈 SAP SE – Gann Projection Signals Major Downside Risk
📅 July 30, 2025 | TF: Daily | Ticker: SAP.XETR
🧠 Concept
Using a historical correction (orange line) from SAP’s past — projected into the future using Gann symmetry — we might be witnessing a repeating time-price pattern. This method suggests the current market is rhyme-repeating a prior bearish phase.
🔍 Technical Highlights
🟢 Current Price: €250.60
📉 Bearish Projection (orange): suggests steep decline into Q4 2025, possibly toward €180
📊 Price reacting near MA200 (~€258) and MA50 (~€246) → tight squeeze zone
📉 MACD bearish, RSI neutral/slightly weak (~44)
📐 Gann Interpretation
The orange fractal projects an accelerated downtrend starting from this level — mirroring the structure of a previous correction in SAP.
Gann symmetry often aligns time and price harmonics, and right now:
📅 Time match: We're at a comparable point in the cycle
💶 Price zone match: Similar resistance/consolidation structure
🧭 Trade Setup
🟥 Short Bias if Breakdown Confirmed
Entry: Below €246
Targets:
▸ €225
▸ €210
▸ €185 (end of fractal projection)
Stop: above €258 (or trendline resistance)
🟩 Invalidation / Bullish Breakout
Close above €258 with strong volume
Watch for Gann failure → possible breakout to €268–€280
🧊 Risk Note
This is a fractal-based idea — not guaranteed, but supported by price structure and momentum. Confirmation from volume, RSI breakdowns, or macro catalysts is key.
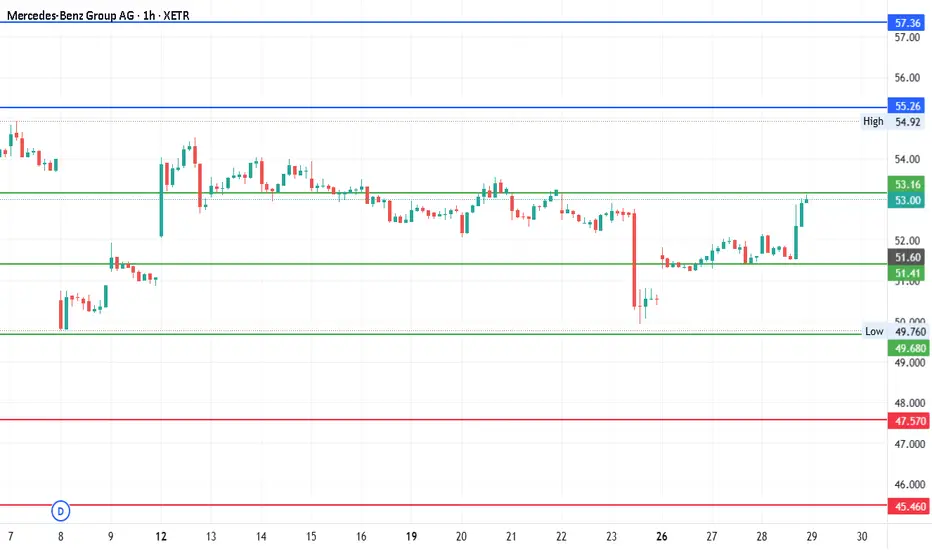
#Mercedes Benz Group AG - Pivot is 51.41Date: 28-05-25
#Mercedes Benz Group AG
Current Price: 53
Pivot Point: 51.41
Upside Target: 55.26, 57.36, 59.59 and 61.83
Downside Targets: 47.5745,46, 43.23 and 41.00
Support: 49.68
Resistance: 53.16