Infineon wave 3 to 62€ Gann-Methode🧠 Infineon (IFX.DE) - Massive Wave 3 in Progress 🚀 | Long-Term Elliott Wave Setup
Ticker: XETR:IFX
Exchange: XETRA 🇩🇪
Chart: Weekly (W1)
Technical Framework: Elliott Wave + Fibonacci + MA + RSI + MACD
🧩 Context:
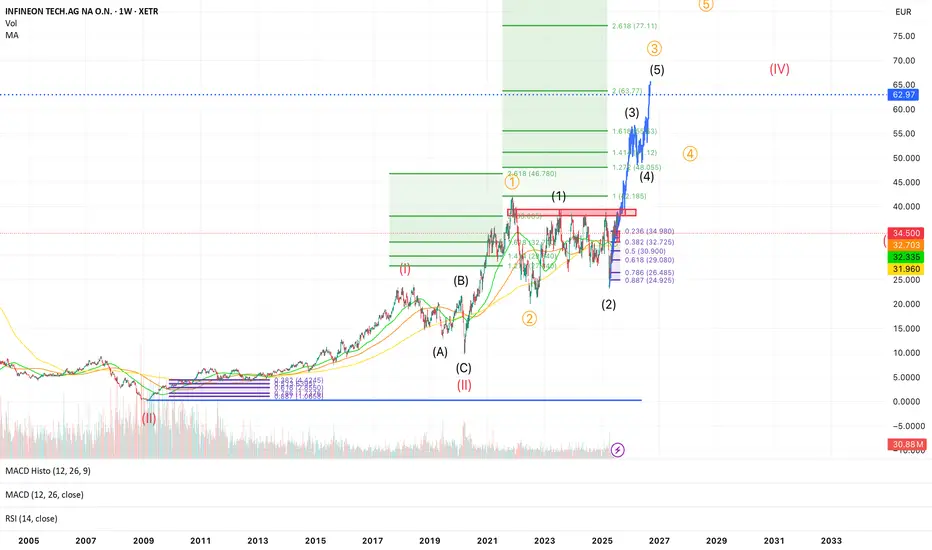
Infineon has completed a massive corrective wave II (labelled in red) and is now in the early stages of a multi-year impulsive wave III. The price recently rejected at the 0.236 retracement (~35€) and is currently back-testing key moving averages. This zone could represent a wave (2) low of the internal (1)-(2)-(3)-(4)-(5) structure of orange wave ③.
🔎 Structure Breakdown:
✅ Wave (II) (in red) ended as a WXY-Flat-Correction, possibly in 2020
✅ Wave 1 and 2 of wave (III) are complete
✅ Current projection: we are in blue wave (3) of orange wave ③
📈 Fibonacci extensions suggest:
1.618x of wave (1) = ~53.83 €
2.0x = ~63.77 €
2.618x = ~77.11 € – ultimate long-term target for wave ③
🟦 Major resistance: 35–36 €, now acting as support
🟢 Key Moving Averages:
MA (32.7), MA (32.3), MA (31.96) are clustered — strong support zone
📊 Indicators:
MACD: Turning bullish, histogram just crossed above 0
RSI: Neutral (51), still lots of upside potential
Volume: Recent spike suggests accumulation during pullback
🔔 Key Levels:
Level Description
32.7 € Strong support (Fib 0.382 + MA)
39 € Fib 0.5 retracement
46.78 € 2.618x extension of orange wave ①
53.83 € Target: 1.618x of current wave (1)
63.77 € Major resistance / Wave (3) top?
77.11 € 2.618x extension of wave ③
🧠 Thesis:
If the recent low was wave (2), Infineon could be entering a parabolic wave (3) move with +50–100% upside potential over the next 12–18 months. The setup is supported by Elliott Wave structure, MA support, and volume confirmation.
⚠️ Risks:
Breakdown below ~30 € (0.5 Fib) would challenge this count
Macro events (e.g., chip cycle, geopolitics) may affect the timing
✅ Strategy:
I’m watching for confirmation of the local low around 32 €, and then adding during retracements. Targets are scaled into at 46 €, 54 €, and 63 €. Final wave (5) of ③ may push up to 77 €.
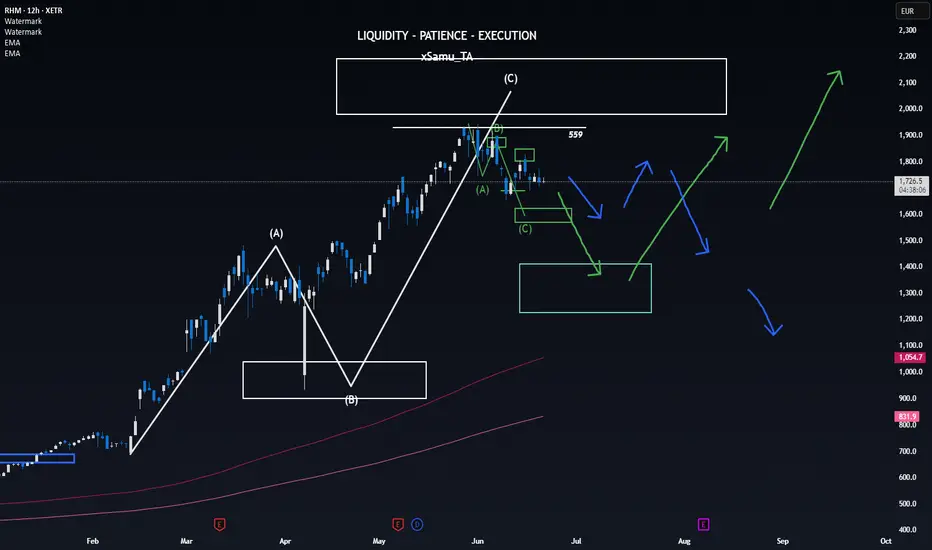
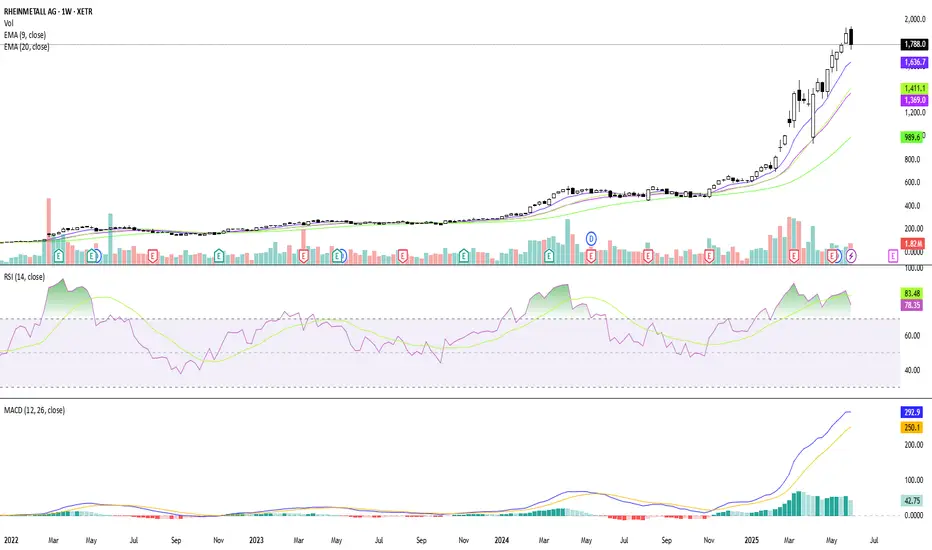
Rheinmetall now faces a crucial testWill it continue to dominate as Germany’s biggest defence player—or is the soaring rally over, giving smaller names in the sector a chance to gain strength?
🟢 The green scenario outlines what I see as the healthiest outcome: a controlled correction to absorb parts of the massive rally, allowing the market to reset before pushing to new highs.
🔵 The blue path would be less ideal. It suggests a shift into a bearish structure, which could trigger a deeper retracement—potentially even breaking below Point B of our overarching white sequence.
For now, I’ve locked in some profits and will sit back.
No clear buy. No clear sell.
Stay sharp, friends—and remember: the chart speaks before the headlines.
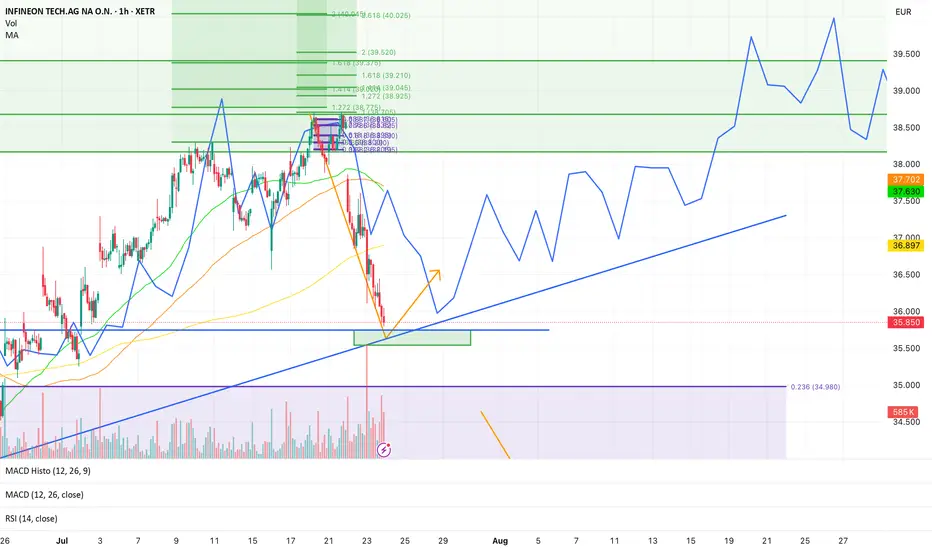
Infineon next big moveInfineon (IFX) – Potential Reversal at Trendline Support
Price has sharply corrected from the local highs around 38.7–39.0 EUR, reaching the major ascending trendline support in the 35.5–36.0 EUR demand zone.
🔹 Key points:
Strong upward trendline (blue) acting as dynamic support.
Price has reached a green demand box with confluence from previous structure.
MACD is bearish but momentum is oversold.
RSI at ~25 indicates oversold conditions with potential for a bounce.
Projected path: Possible short-term consolidation or retest of the trendline, followed by a bullish continuation towards 38.9, 39.2, and 39.5 EUR Fibonacci levels.
Targets: Fibonacci extensions at 1.272 (38.92 EUR), 1.618 (39.21 EUR), and the psychological 40 EUR zone if bullish momentum continues.
🔻 Invalidation: Clear breakdown below 34.98 EUR support (0.236 retracement) with volume confirmation could invalidate this reversal setup.
Porsche Break-out! Porsche finally broke out of the long resistance trendline with a strong 7% push. Will the stock finally flip its downtrend?
Alot of EMA's crossed, as well as squeese indicators.
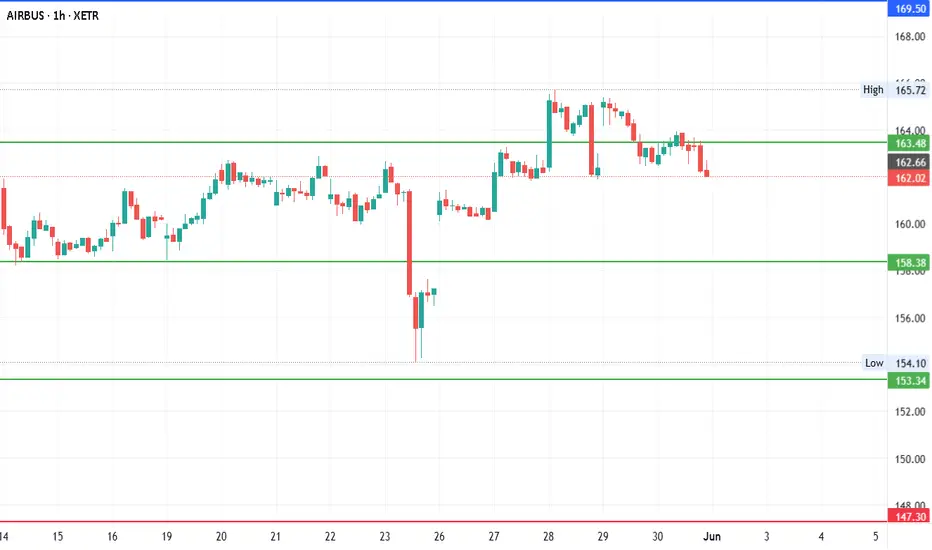
#AIRBUS Group - Pivot Point is 158.38Date: 01-06-2025
#AIRBUS Group
Pivot Point: 158.38 Support: 153.33 Resistance: 163.47
Upside Targets:
Target 1: 169.49
Target 2: 175.50
Target 3: 181.92
Downside Targets:
Target 1: 147.29
Target 2: 141.26
Target 3: 134.84
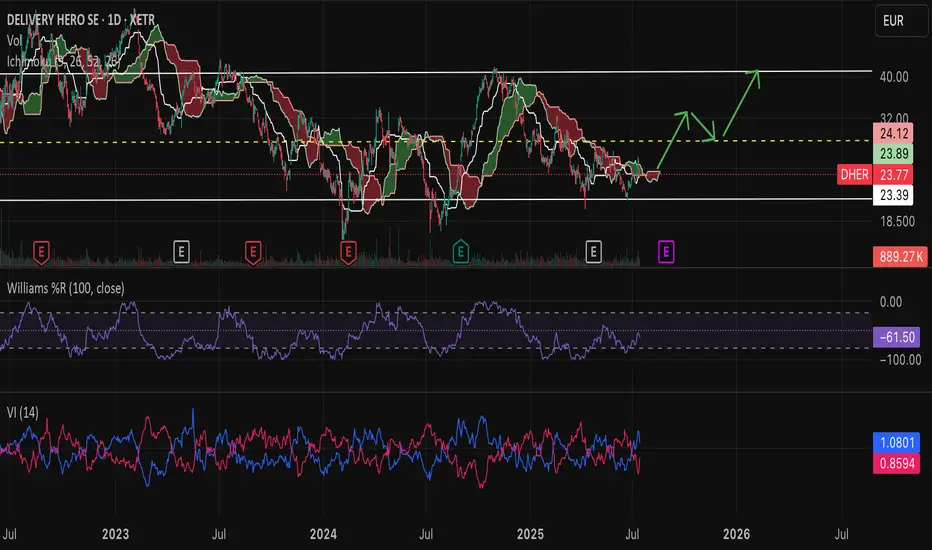
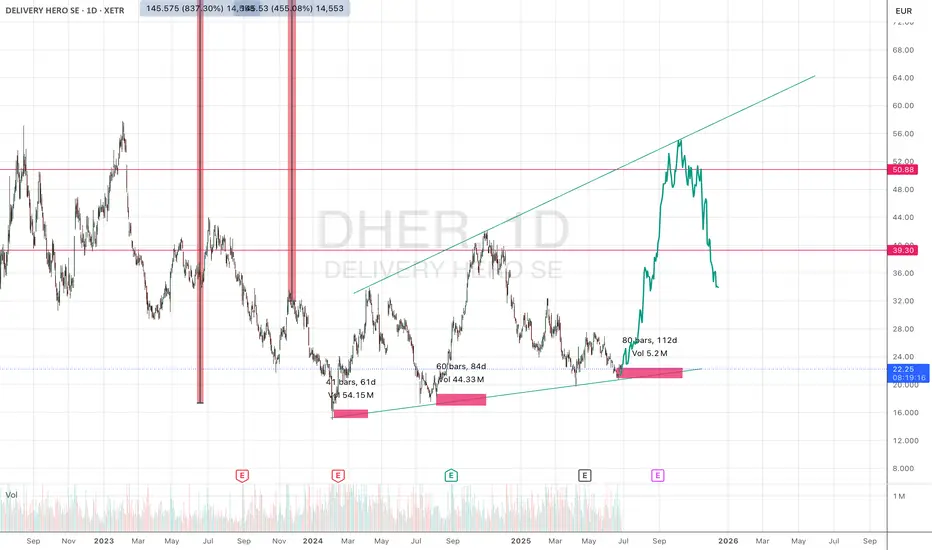
$DHER to $40- XETR:DHER i.e Delivery Hero is working towards profitability and exiting markets where it doesn't want to burn on operations.
- Company is becoming leaner, meaner and strategic in areas where it operates and dominates.
- Region MENA is growing (31% YoY)
- It has nice free cash flow per share growth. XETR:DHER posted ~227% YoY growth in free cash flow, putting it in the top 10% of its peers, well above its 3‑year average of ~32% .
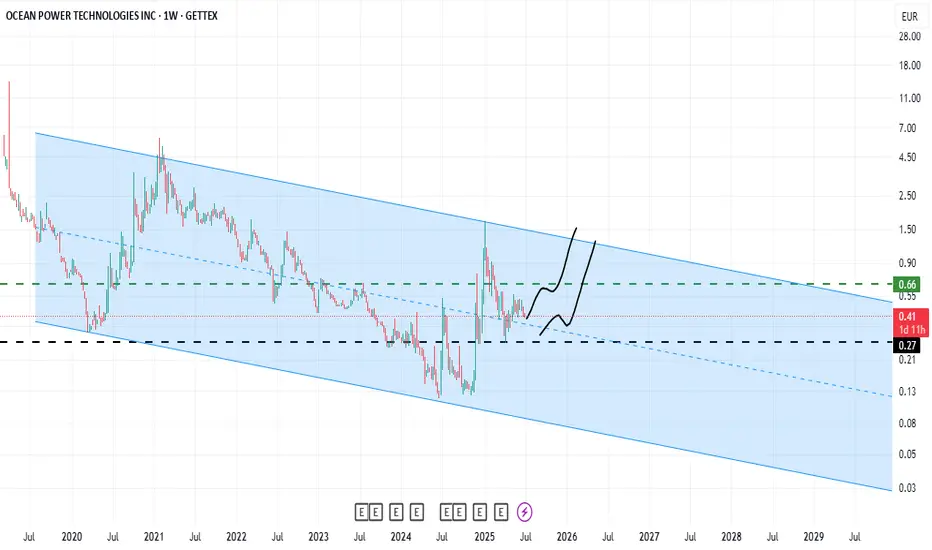
#RUOCThe success of #Ocean_Power in registering an innovative patent has provided a good opportunity for these stocks to exit the downward channel and grow, although from a technical perspective, some corrections seem necessary.
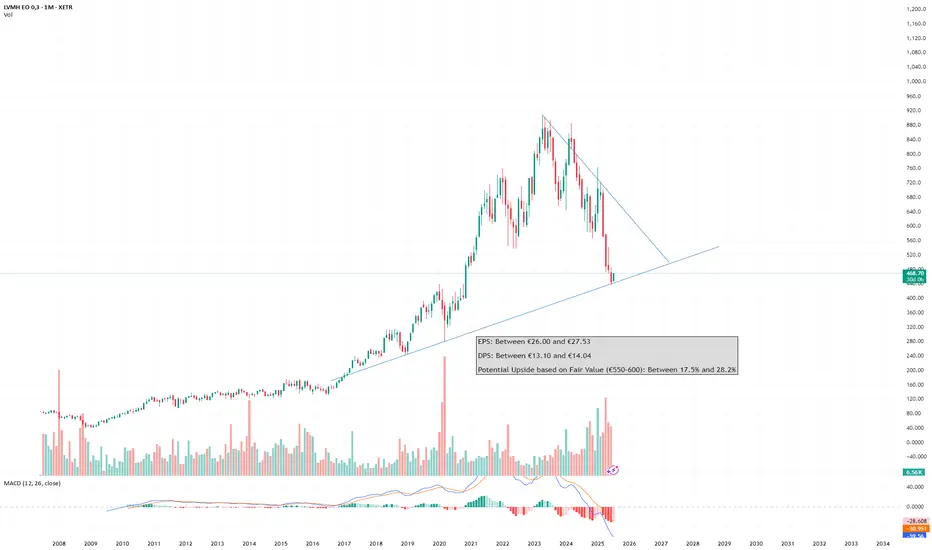
LVMH BUYLVMH is trading at around €468, well below its 2023 highs and at a significant discount to historical valuation multiples. The forward P/E is approximately 17x, versus a 5-year average of 24x. EV/EBITDA is under 10x, and the dividend yield is near 3%.
Fundamentals remain strong. LVMH continues to generate high free cash flow, maintains operating margins above 25%, and has one of the most powerful brand portfolios in the world. Weakness in Wines & Spirits and soft consumer demand in China have driven the stock lower, but long-term structural growth remains intact.
Recent developments include a 10-year partnership with Formula 1 through Glenmorangie, new retail leadership at Rimowa, and expansion of flagship stores in Asia focused on experience. These signal continued strategic positioning, not retreat.
With fair value estimates in the €550–600 range, LVMH currently offers 17–28% upside. A staged buy strategy between €455–470 appears well-supported. Short-term traders may use €430 as a technical stop.
LVMH offers long-term quality at a temporary discount.
Rheinmetall Ag - Micro Timeframe EW-analysisI have two possible short-term scenarios for Rheinmetall. Both share the same structure on the higher degrees, but they differ slightly in the short term. Despite the difference in micro-counts, both scenarios remain bullish in the near term. As shown here, in this scenario, Wave 5 (yellow) is unfolding as an ending expanding diagonal, with each subwave in orange forming either a zigzag or a double zigzag. One small issue in this count is that Wave 4 (orange) hasn’t yet moved into the price territory of Wave 1 (orange), which is typically expected in an expanding diagonal. However, this is a guideline, not a rule so the count remains valid. Wave 4 (orange) may not be completed yet, and a break below the previous low would indicate that it's still in progress. For now, though, the structure suggests that Wave 5 (orange) has already begun and is expected to lead to a new all-time high. To validate this scenario, Wave 5 (orange) should unfold as a single zigzag (ABC) or a double zigzag (WXY). If instead it develops as a five-wave impulse, this count would be invalidated, and my second scenario would take over. The completion of this ending expanding diagonal would not only finish Wave 5 (yellow), but also mark the end of the larger Wave 3, (two degrees higher), which began on November 20, 2008.
With NATO recently announcing that nearly every European country except Spain will allocate 5% of GDP to defense, I expect that the correction following this major wave 3 impulse may be relatively shallow. More likely, we could see a broad distribution phase take shape, possibly in the form of a triangle rather than a sharp retracement.
Disclaimer: This analysis is for informational and educational purposes only and should not be considered financial or investment advice. All trading involves risk, and you should perform your own due diligence before making any trading decisions. The author is not responsible for any losses that may arise from reliance on this content. Always trade at your own risk.
Retro Editors' picks 2021Going further in our retro EP selection , we present to you a collection of additional scripts from 2021 that have earned a spot in our Editors' picks. These retrospective selections reflect our continued commitment to honoring outstanding contributions in our community, regardless of when they were published. To the authors of these highlighted scripts: our sincere thanks, on behalf of all TradingViewers. Congrats!
Circular Candlestick Chart - alexgrover
Dominance Pie Chart - fikira
Tape - LucF
ta (library) - TradingView
MathConstants (library) - RicardoSantos
MathStatisticsKernelFunctions (library) - RicardoSantos
Zigzag Candles - Trendoscope
Over the next three months, in the last week of each month, we will share retro Editors' picks for subsequent years:
July: retro EPs for 2022
August: retro EPs for 2023
September: retro EPs for 2024
They will be visible in the Editors' picks feed.
Previously published retro Editors' picks:
May: retro EPs for 2020
█ What are Editors' picks?
The Editors' picks showcase the best open-source script publications selected by our PineCoders team. Many of these scripts are original and only available on TradingView. These picks are not recommendations to buy or sell anything or use a specific indicator. We aim to highlight the most interesting publications to encourage learning and sharing in our community.
Any open-source script publication in the Community Scripts can be picked if it is original, provides good potential value to traders, includes a helpful description, and complies with the House Rules.
— The PineCoders team
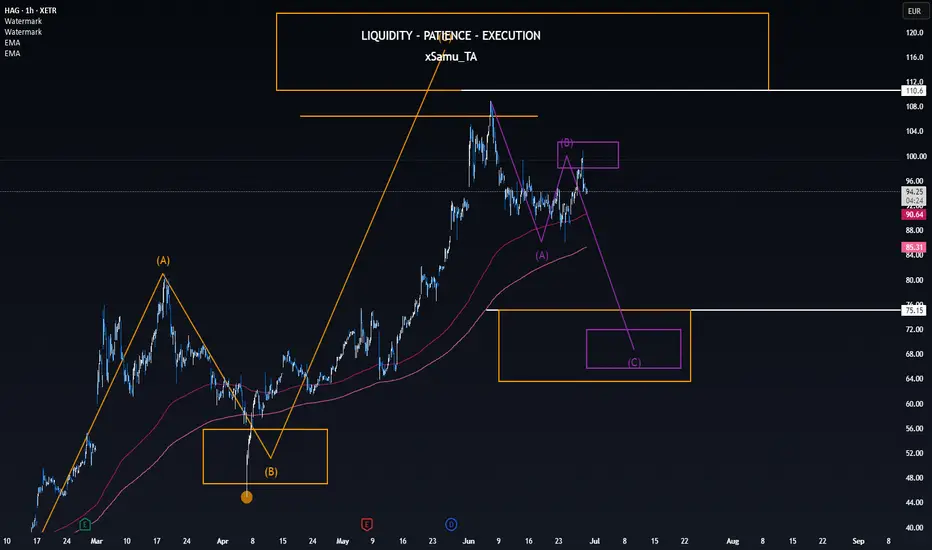
HAG investors should prepare for downsideHensoldt AG topped out a bit early—unfortunate, but no real drama.
The broader idea of higher highs remains fully intact.
To fuel the next leg up, I could very well see the violet structure playing out, guiding us directly into the bullish rebound zone. But for that to unfold, we first need a clean break below point A.
Should that happen, investors should prepare for roughly 25% downside before the real opportunity begins.
Stay focused. Don’t fear the dip - embrace the setup.
DHER: higher low higher high ?most likely next jump (53 region) ahead. most undervalued stock in europe and a long term buy
#ADIDAS - Pivot is 217.75Date: 03-06-2025
#ADIDAS
Pivot Point: 217.75 Support: 212.83 Resistance: 222.71
Upside Targets:
Target 1: 227.93
Target 2: 233.15
Target 3: 238.93
Downside Targets:
Target 1: 207.59
Target 2: 202.35
Target 3: 196.575

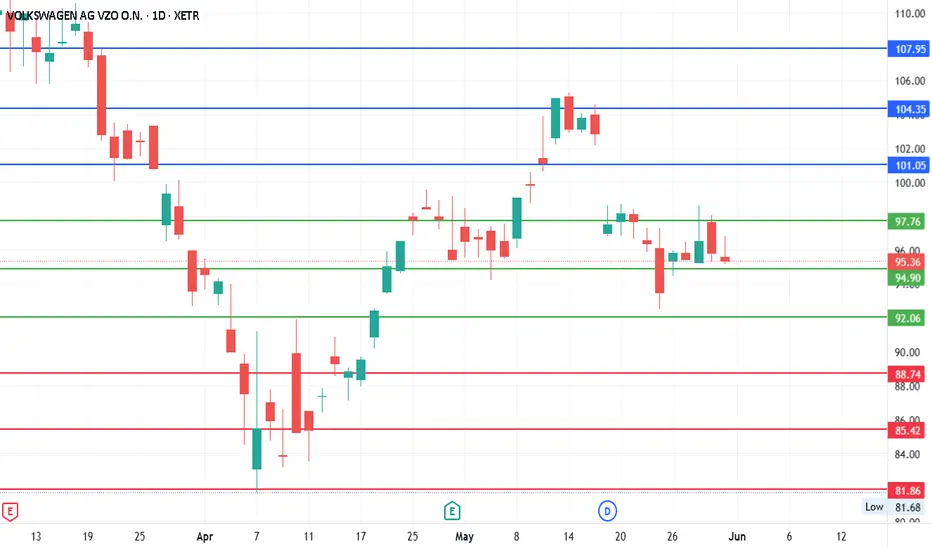
#Volkswagen - Pivot Point is 94.89Date: 01-06-2025
Pivot Point: 94.89 Support: 92.06 Resistance: 97.75
Upside Targets:
Target 1: 101.06
Target 2: 104.37
Target 3: 107.93
Downside Targets:
Target 1: 88.73
Target 2: 85.41
Target 3: 81.855
#Volkswagen
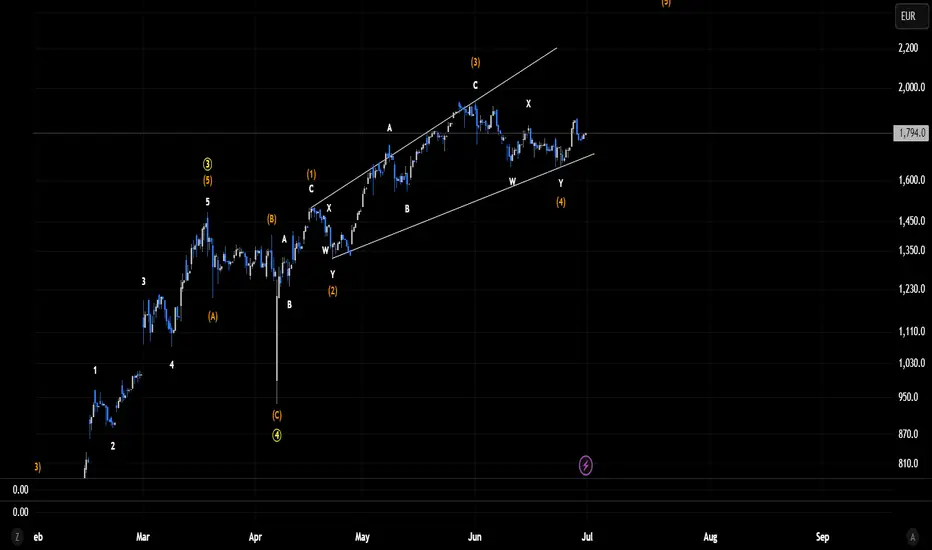
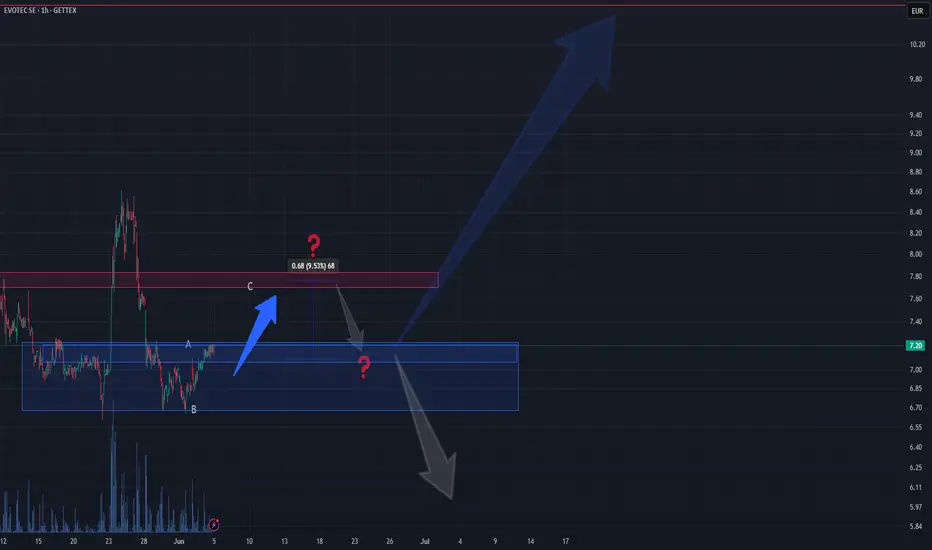
EVT 1h – Elliott Wave view After the sharp rejection from 8.50 EUR, price printed a three-leg corrective
move that bottomed at 6.50 EUR. The climb from 6.70 EUR is unfolding as an
A-B-C zigzag rather than an impulsive five-wave rally.
Wave map
• Wave A: 6.70 → 7.20 EUR
• Wave B: 7.20 → 6.90 EUR (deep, time-consuming pullback)
• Wave C: now advancing toward 7.70 – 7.80 EUR (first supply)
Key zones
• **Buy box (demand)** 7.05 – 7.25 EUR ↳ ideal entry for wave-C continuation
• **Sell box (supply)** 7.70 – 7.80 EUR ↳ completion area of the zigzag
• Extension target 11.00 EUR ↳ only if 7.80 EUR clears on high momentum
Expectations
The pair of gray arrows on the chart illustrate two scenarios:
1. **Fast resolution** – price tags 7.70 – 7.80 EUR, exhausts wave C, and rolls
back into the 7.20 / 6.90 EUR pocket to start a larger-degree decline.
2. **Time burn** – price drifts sideways inside the blue range, building
structure before a final wave C pop; result is the same retest of demand.
Bias remains bullish toward 7.70 EUR while the 7.05 EUR floor holds, but the
move is classified as corrective, not impulsive; once complete, a return to
range-low support is favored.
Idea for RHMThis chart is part of my active trading analysis on Rheinmetall (RHM.DE), focusing on both intraday movements and short-term trends (2–5 days).
Included Indicators:
EMA (9, 20, 50) – to assess momentum and dynamic support/resistance
RSI (14) – for overbought/oversold levels
MACD – to detect potential trend reversals
Volume – for confirmation of breakouts or fading moves
RHM.DE 1 hourThis chart is part of my active trading analysis on Rheinmetall (RHM.DE), focusing on both intraday movements and short-term trends (2–5 days).
Included Indicators for 1 hour:
EMA (9, 20, 50) – to assess momentum and dynamic support/resistance
RSI (14) – for overbought/oversold levels
MACD – to detect potential trend reversals
Volume – for confirmation of breakouts or fading moves
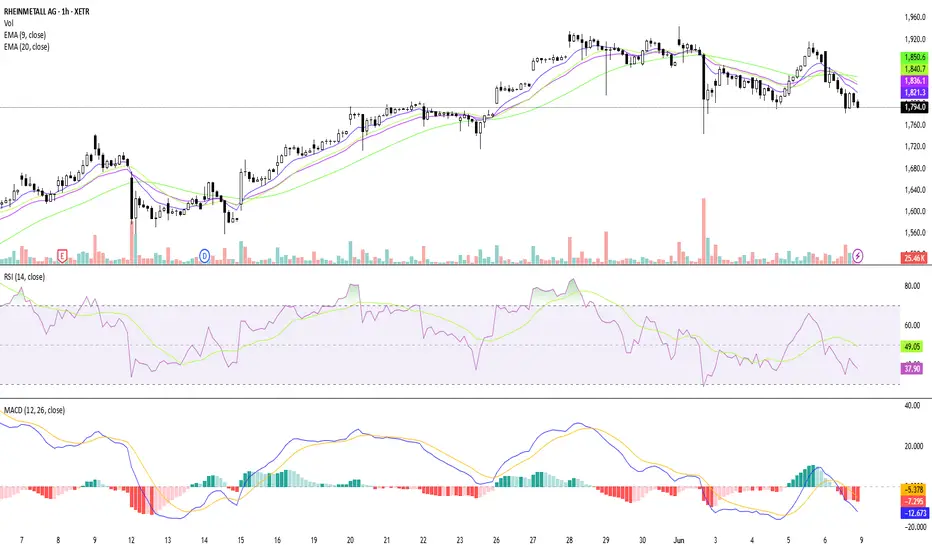
RHM.DEThis chart is part of my active trading analysis on Rheinmetall (RHM.DE), focusing on both intraday movements and short-term trends (2–5 days).
Included Indicators:
EMA (9, 20, 50) – to assess momentum and dynamic support/resistance
RSI (14) – for overbought/oversold levels
MACD – to detect potential trend reversals
Volume – for confirmation of breakouts or fading moves

Rolls-Royce – Alarm Bells Ringing: Ending Diagonal Risk3-Day Chart
PATTERN
• The rise from 6.58 € is unfolding as a corrective wave,
sketching a classic five-leg **Ending Diagonal**.
• Overlapping candles, slowing momentum and converging
trendlines confirm the terminal nature of the move.
KEY GUIDELINES
1. **White rising trendline** = last line of bullish defence.
2. A clean break of that line can launch a volatile,
stop-hunting **B-wave**—often beginning with either
a gap or a single long bar.
3. Precise prices on the sketch are **place-holders**;
the diagram shows structure only, not actionable levels.
TRADER NOTES
• While the trendline holds, the diagonal may extend a bit
higher, but reward-to-risk shrinks fast.
• Once support snaps, expect sharp whipsaws before any
sustained decline; size down and avoid heavy leverage
in this zone.

TKA Up only soonMarked out my next major buy level at €7.3.
If we break trend while hitting that zone, expect an explosive move to the upside—think back to the breakout from €3. Same setup, same energy. TKA could rocket from there.
Invalidation? Simple: a clear structure break, meaning a new low in the pink sequence. Until then, this level is locked and loaded.

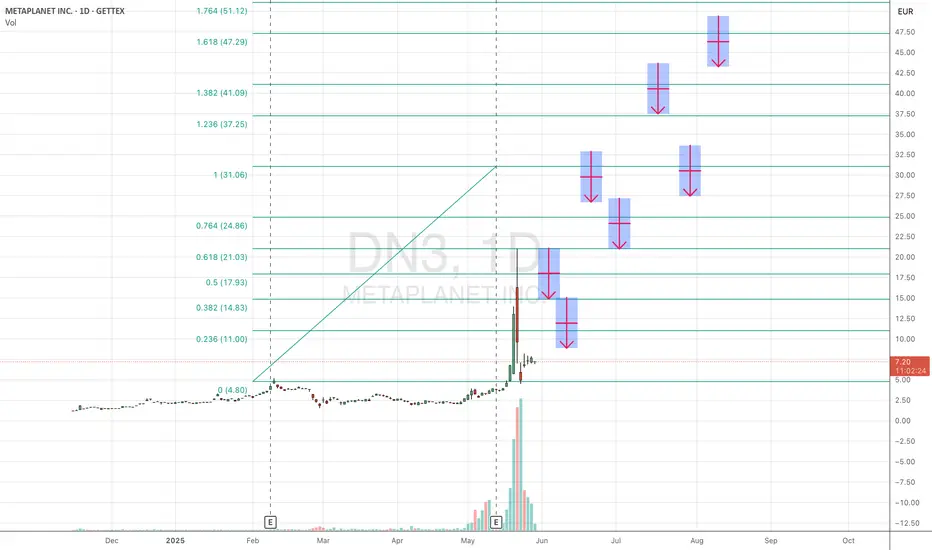
Breakout on high VolumeIf you want a leverage on BTCUSD and think MSTR is already to big, try Metaplanet. Next Fib. targets shown. Guess a 10-30x within this year possible
Is a 100% increase in the value of social trading stocks?The IPO market is buzzing with excitement following the hugely successful listing of eToro Group Ltd (ETOR).
This article will analyze how to identify stocks in the social trading sector and the criteria for assessing whether their market value is undervalued and offers significant growth prospects.
Social trading is one of the most significant innovations in the world of financial investment. This practice allows investors to connect, share strategies, and even replicate the trades of more experienced traders through dedicated platforms. In an era where technology is transforming every aspect of our lives, social trading offers an accessible and collaborative way to navigate the financial markets.
The boom in social trading
Social trading is an investment method based on collaboration between traders through online platforms. These platforms, such as eToro or NAGA, serve as digital spaces where users can observe the activities of other investors, discuss strategies, and, in many cases, copy the trades of experienced traders. The main goal is to make the investment process more transparent and accessible, even for those who do not have in-depth knowledge of the markets.
Understanding the social trading industry
The fundamental principle of social trading is information sharing. More experienced traders make their portfolios and trades available, allowing others to monitor their movements on the markets in real time. Users can choose to copy the strategies of these professionals, which means that every trade made by the expert will be automatically replicated in the copier's portfolio. This process, called “copy trading,” is ideal for those who want to participate in the markets but don't have the time or expertise to analyze them in depth.
The two most interesting publicly traded companies in the social trading sector are EToro and NAGA Group AG (N4G).
I decided not to invest in E Toro, as IPOs tend to drive the share price above its actual value. Statistically, out of 10 IPOs, 8 times the value of the shares decreases in the first year. As shown in the image, TW flags two warnings: the price is currently correct, indicating limited growth potential, and profit margins are low.
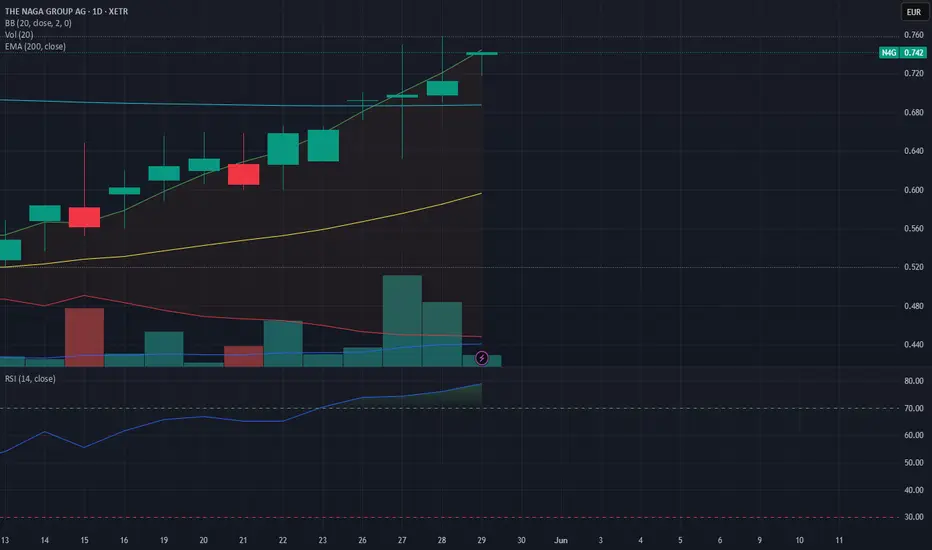
Why NAGA Group AG excels
NAGA Group AG is a German company that develops and markets applications in the financial technology sector. The company's main product is NAGA TRADER, a social trading application that allows users to trade foreign currencies, indices, equities, and cryptocurrencies via Contracts for Difference, copying the trades of other traders.
A notable feature of NAGA TRADER is its dual exchange function, which allows users to replicate the strategies of other crypto investors and trade cryptocurrencies.
I decided to invest in this technology company, NAGA Group AG (N4G), based on my analysis, which coincides
The stock is also very interesting from a technical point of view, as prices are rising with above-average volumes and are about to cross the 200 moving average, with prices that I believe will reach 1.50 in 2026, with a potential upside of over 100%.
If you would like to receive a notification every time I publish a new article, just click on “FOLLOW” at the top. Also, if you would like to explore a particular topic in more depth or need some advice, please comment below the article and I will be happy to help.
What is Happening to Puma?Puma's stock has experienced a significant decline, dropping nearly 50% year-to-date and reaching its lowest levels in almost a decade . This downturn is attributed to several factors, including underwhelming financial performance, escalating competition, and macroeconomic challenges.
Financial Performance:
In 2024, Puma reported a 4.4% currency-adjusted increase in sales, totaling €8.82 billion . However, profitability did not keep pace; net income declined by 7.5% to €282 million, and EBIT remained flat at €622 million, falling short of analyst expectations . The company's P/E ratio stands at 17, which some analysts consider high given the current earnings yield of 2.8% .
Debt and Balance Sheet:
Puma's financial health shows a debt-to-equity ratio of approximately 48.2%, with total debt at €1.3 billion and shareholder equity at €2.7 billion . While the company has a solid capital base, increased interest payments have impacted income .
Competitive Landscape:
Puma faces intense competition from industry giants like Nike and Adidas. Nike holds a significant market share, while Adidas has recently increased its share to 8.9% . Puma's market share stands at approximately 4.94% . The company's efforts to boost sales through new product lines, such as the Speedcat trainers, have yet to yield significant results .
Macroeconomic Challenges:
Global economic factors have also played a role in Puma's struggles. Trade disputes and currency volatility have negatively impacted sales, particularly in key markets like the U.S. and China . Additionally, new U.S. tariffs on imports from China, where Puma sources 28% of its products, have created further uncertainty.
Strategic Response:
In response to these challenges, Puma has announced plans to cut 500 corporate positions globally by the end of the second quarter of 2025 to reduce costs . The company has also appointed former Adidas executive Arthur Hoeld as its new CEO, effective July 1, 2025, aiming to revitalize its performance .
In summary, Puma's recent stock decline reflects a combination of internal financial challenges and external market pressures. While the company is taking steps to address these issues, including leadership changes and cost-cutting measures, it remains to be seen how effectively Puma can navigate the competitive and economic landscape moving forward.
- *Disclaimer: This is just my personal opinion and not financial advice. I am not a professional financial advisor. Please do your own research before making any investment decisions. Any losses incurred are solely at your own risk.The figures that i found might not all be correct, as I do sometimes make mistakes, so do your own due diligence.*
