
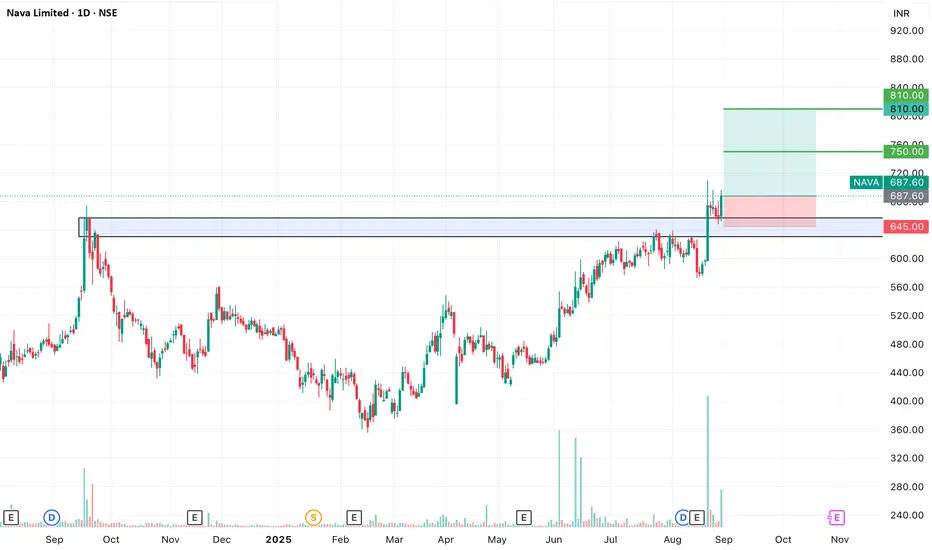
SWING IDEA - NAVA Nava Ltd , a diversified natural resources and energy company, is showing a promising swing opportunity with a breakout backed by strong technical signals.
Reasons are listed below :
Cup and Handle breakout, a strong bullish continuation pattern
Confirmed bullish price action post breakout
Bul
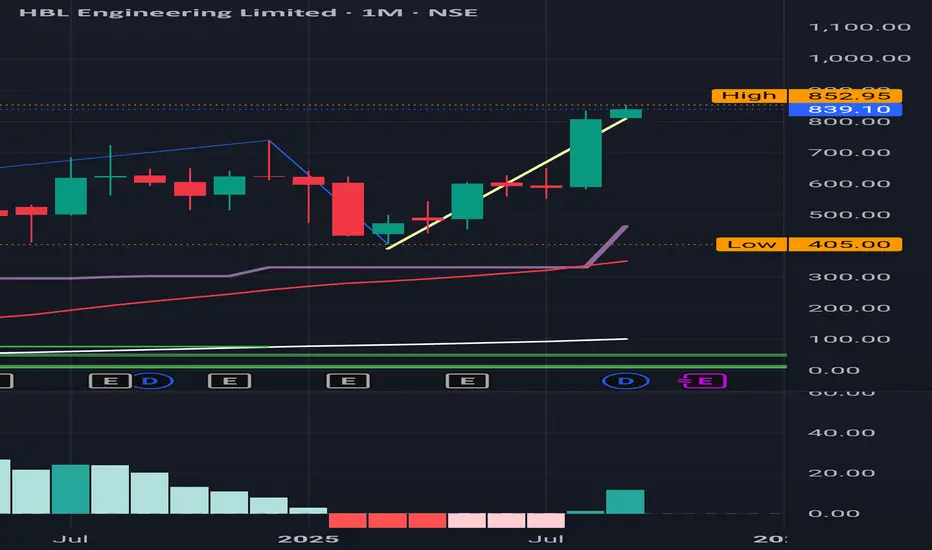
HBL Engineering: More than Doubled in 6 months HBL Engineering: More than Doubled in 6 months , March 2025 to Sept 2025, ATH
Monthly Time Frame
( Not a Buy / Sell Recommendation
Do your own due diligence ,Market is subject to risks, This is my own view and for learning only .)
Review and plan for 2nd September 2025 Nifty future and banknifty future analysis and intraday plan.
This video is for information/education purpose only. you are 100% responsible for any actions you take by reading/viewing this post.
please consult your financial advisor before taking any action.
----Vinaykumar hiremath, CMT

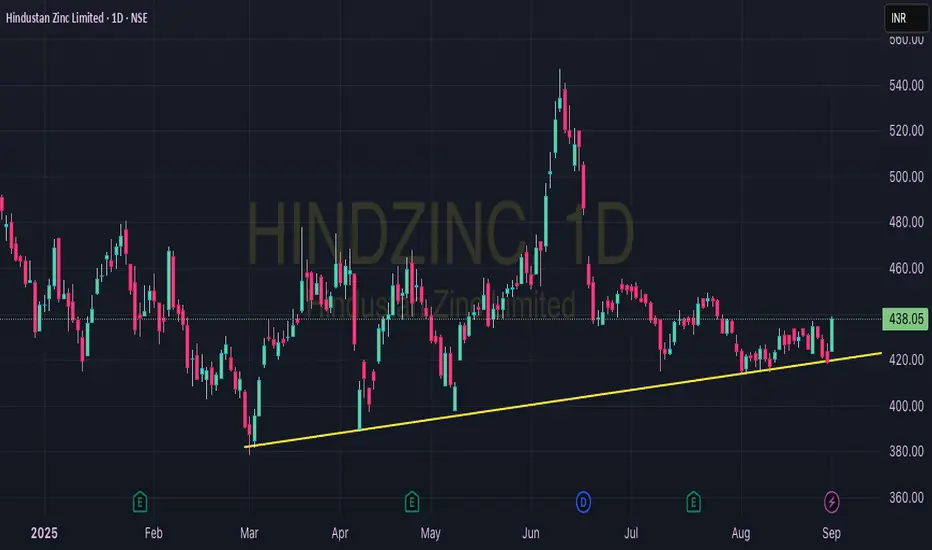
HINDZINC a Closer Look 1. Hindustan Zinc stands tall as a global low-cost zinc producer with decades of reserves, making it a structural play in the commodities cycle.
2. The company’s FY25 results showed revenue up 18% and PAT up 33%, highlighting its ability to grow even in volatile markets.
3. With a PEG ratio under
KAYNES | Buy if close above 6440 | SL below 6000KAYNES | Buy if close above 6440 | SL below 6000 | 1st Targets 7590 2nd 9150
Disclaimer:
This is not financial advice. Please do your own research or consult with a financial advisor before making any investment decisions. Investments in stocks can be risky and may result in loss of capital.

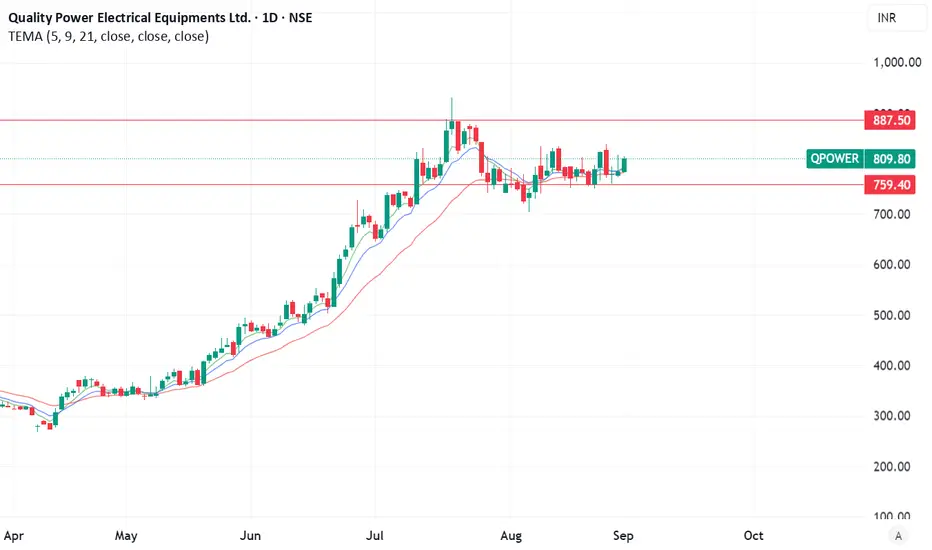
Positional setup for Quality Power Electrical Equipments Ltd. (QTechnical Analysis (Daily Chart)
Trend Structure: The stock is riding a steady uptrend, with price comfortably above the 5-, 9-, and 21-period EMAs—signaling robust momentum.
Consolidation Base: A plateau formed around ₹780–820, anchoring a clear base from which a potential breakout may emerge.
K
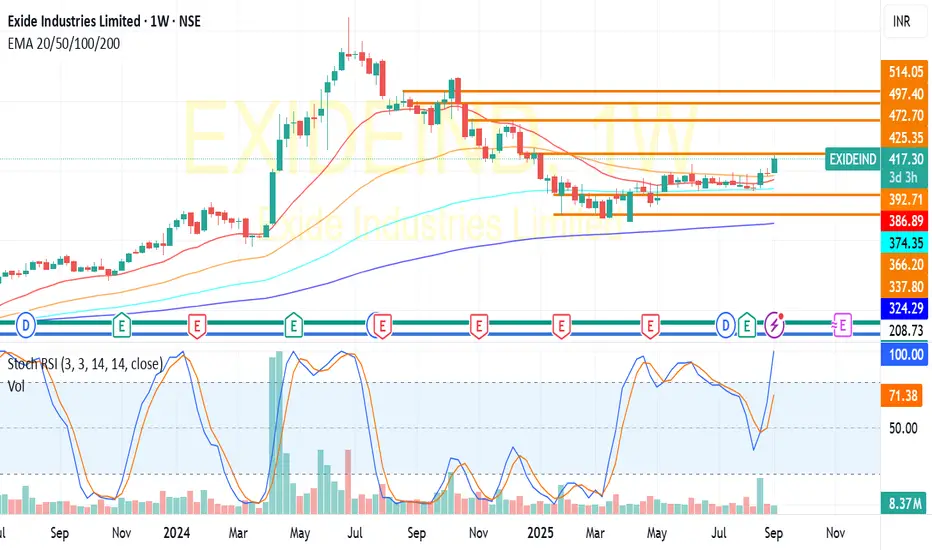
EXIDE INDUSTRIES-EMA GOLDEN CROSS OVER-DAILY&WEEKLY CHARTEXIDE IND:Trading above all its Moving average in daily and weekly charts.Golden cross over of DEMA in long term suggests a move towards 450,If it holds above 425 levels,my short term tgt would be 425 and mid term tgt is 450(for educational purpose only)
possible garam chai Cup & Handle formation in Zydus WellnessZydus Wellness is showing signs of a classic cup and handle formation on the monthly timeframe, with price consolidating just above the breakout zone near ₹2,427. A clean handle structure is forming after a multi-year rounded base, suggesting accumulation and breakout readiness.
The projected targe

Britannia - Daily - fresh buy triggeredBritannia has triggered a fresh buy signal on the daily
Past instances are highlighted. It is a beneficiary of the recent GST rate cuts and likely Govt moves to spur consumption

See all popular ideas
Community trends
Stock collections
All stocksTop gainersBiggest losersLarge-capSmall-capLargest employersHigh-dividendHighest net incomeHighest cashHighest profit per employeeHighest revenue per employeeMost activeUnusual volumeMost volatileHigh betaBest performingHighest revenueMost expensivePenny stocksOverboughtOversoldAll-time highAll-time low52-week high52-week lowSee all
Sector 10 matches | Today | 1 week | 1 month | 6 months | Year to date | 1 year | 5 years | 10 years |
|---|---|---|---|---|---|---|---|---|
| Finance | ||||||||
| Technology Services | ||||||||
| Producer Manufacturing | ||||||||
| Energy Minerals | ||||||||
| Consumer Non-Durables | ||||||||
| Consumer Durables | ||||||||
| Non-Energy Minerals | ||||||||
| Communications | ||||||||
| Process Industries | ||||||||
| Health Technology |