LVMHHello everyone,
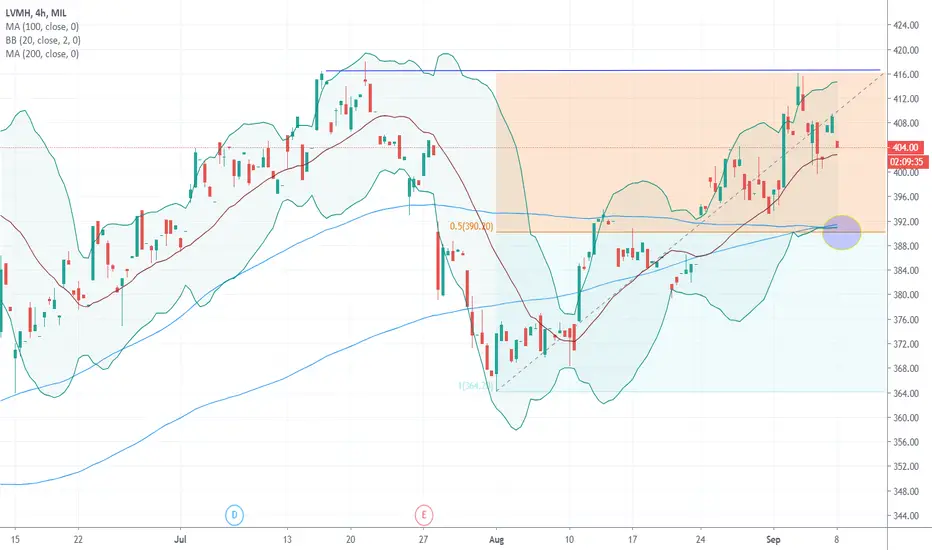
A good opportunity has been detected on the LVMH stock.
After strong upward movement on the LVMH stock, the price
found resistance on a strong resistance level, pulled back and
is currently correcting to the downside.
We are expecting the price to reach approximately the 390.500 price
area, where we have a 50.0% Fibonacci retracement level, a support
point, as well as the 100 Moving Average and the 200 Moving Average.
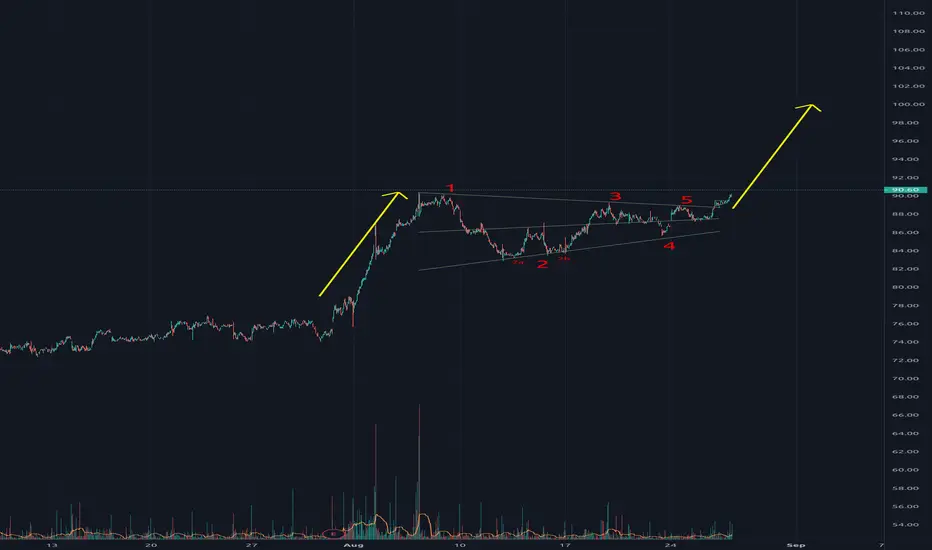
What is a pennant?A pennant is a continuation pattern.
Statistics of pennant patterns
- In 75% of cases: a pennant’s continues in the same direction.
- In 15% of cases: a pennant’s continues tries to continue in the same direction but pulls back.
- In 55% of cases, a pennant continues in the same direction and reaches his target.
Notes on pennant patterns
- pennants with a narrow base perform better
- A pennant is stronger if there are no false breaks (false pattern exits).
- If their are pullbacks after exit from the pennant: its bad for its performance.
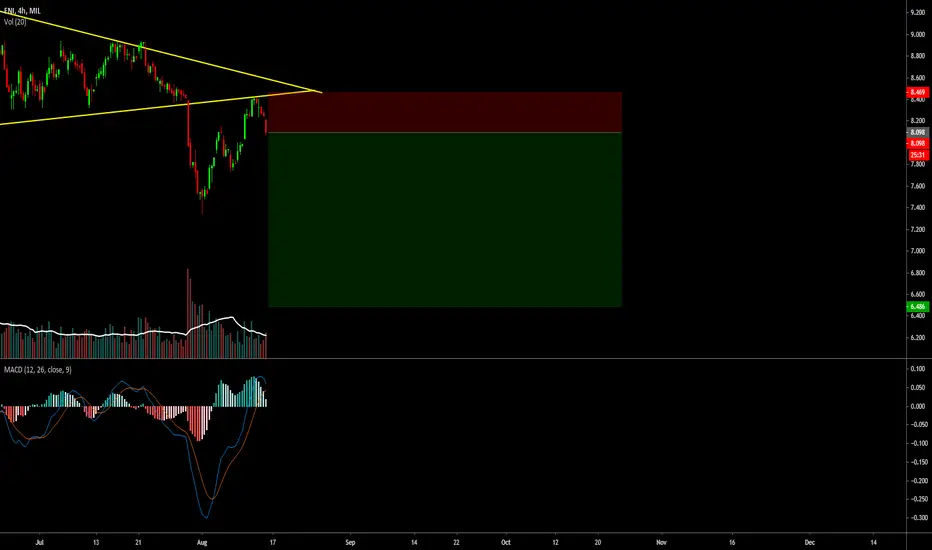
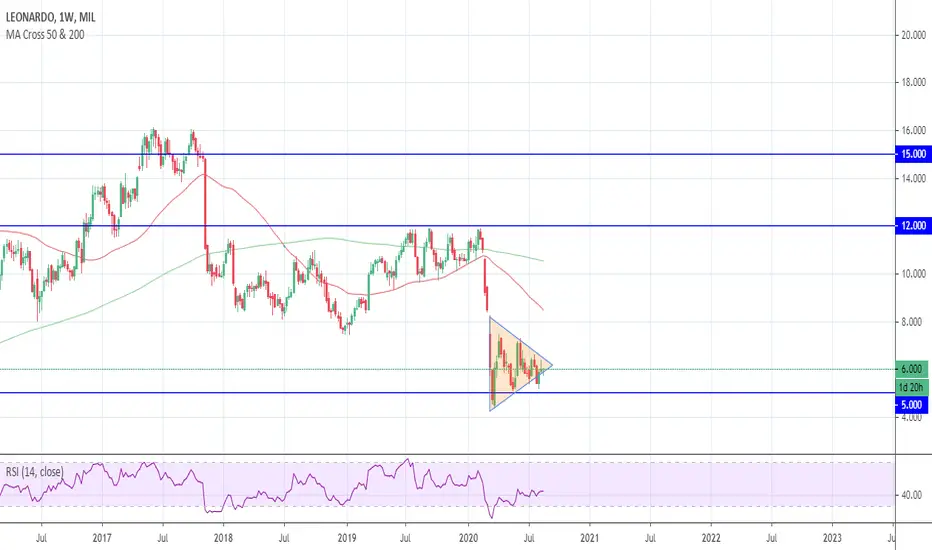
LONG LDOGood structore here. The title is recharging, it seems to be ready to the pull-back. Target price on the medium term 7,5. A retest on the support line at 5 is likely. Due to fundamental analysis, LDO have bright prospective on the long run, now, we are in a very low price zone: best moment to buy for a long term portfolio. LDO has low variance: the risk is very low. Perfect moment and perfect stock to buy.
BNP Elliott Wave Perspective + Monthly Chart AnalysisDo not ever Forget the content on all of our analysis are subject to change at any time without notice, and is provided for the sole purpose of assisting traders to make independent investment decisions.
Nothing on this video constitutes a personal recommendation. Seek independent financial advice from licensed professionals If you need it.
Please support us to help more people..

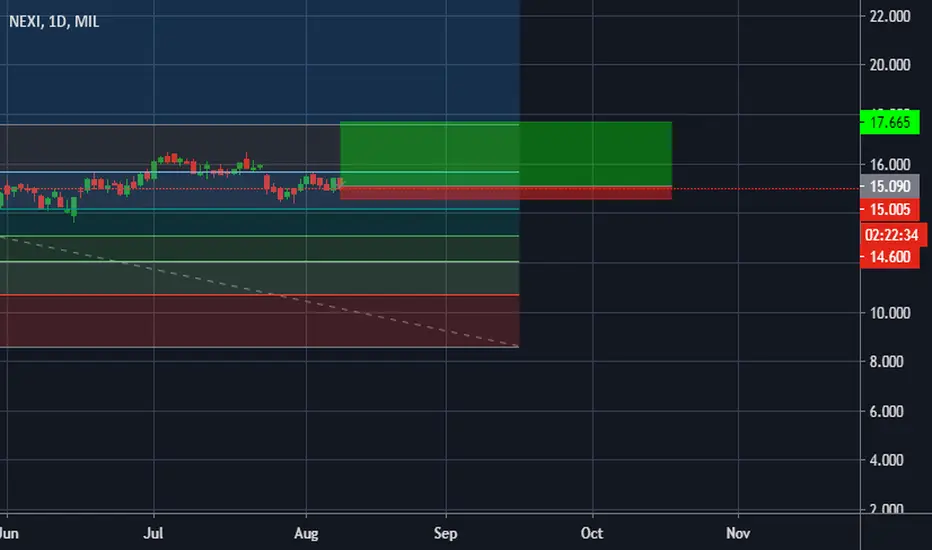
daily analysis NEXIHi friends
the daily chart of this market shows that it will experience an uptrend in the coming days with a high probability but at the same time you have to be vigilant of the change from the direction to the opposite
please subscribe to receive more analyzes
daily analysis TELECOM ITALIAHi friends
the daily chart of this market shows that it will experience a downtrend in the coming days with a high probability but at the same time you have to be vigilant of the change from the direction to the opposite
please subscribe to receive more analyzes


Bullish weekly divergence+Bullish weekly divergence
+13 July: Saras, which owns Italy's Sarroch refinery, which has been running at around 70% of its capacity since March and had only two of its three CDUs operational, has restarted its T1 topping plant and is currently in the process of restarting its FCC unit.

GOOGL, BUY SETUPNASDAQ:GOOGL
Hey traders, please support my idea with LIKE or comment if you agree!
GOOD LUCK!
IFX, ROAD TO 23,4 ?SWB:IFX
Hey traders, please support my idea with LIKE or comment if you agree!
GOOD LUCK!

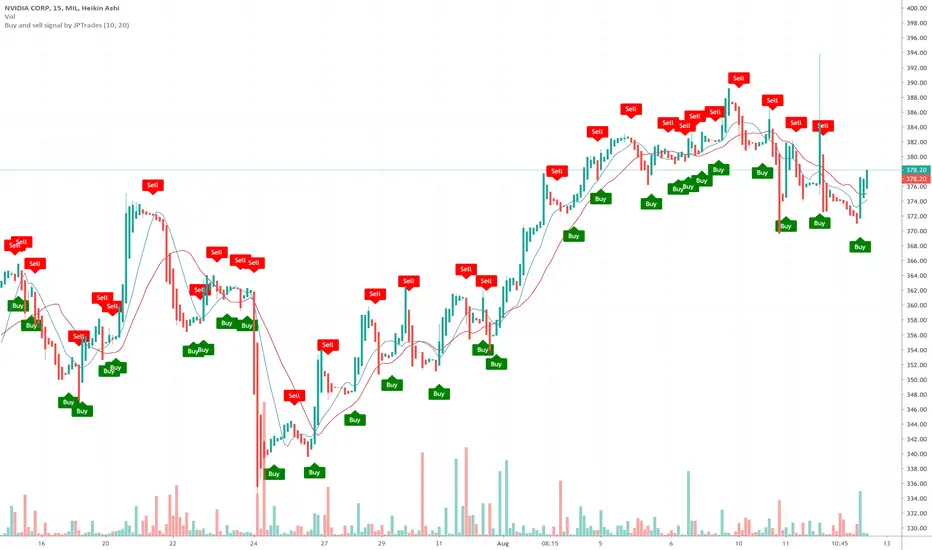
Overbought to Oversold: The Crucial Addition!Here's why most algorithms fail. They don't take into account the context you needed it to.
Here's why it's hard to correct that: you need something OUTSIDE of the raw number-crunching that you're doing in order to understand what's happening. If you're very good at that, you're already a profitable trader to begin with! In that case, it can be discouraging to move to a different platform where, at least to begin with, you don't see yourself making any move into profitable territory any time soon.
In this example, I used a raw "overbought to oversold" strategy that looks at RSI crossing from overbought/oversold to fair value to time exits and entries. The problem is, results vary widely. Sometimes, it is right 95% of the time for hundreds and hundreds of bars. Other times, it stops you out thirty times in a row. Whenever you see this type of erratic behavior, you know something outside of the stochastic nature of asset prices is playing its part.
This is why you need to understand what you're doing; what you're coding, and why the results are what they are. What kind of indicator is RSI? When does it work, and when does it fail? When you realize RSI is an oscillating momentum indicator, it's not hard to figure out it does well when a stock is ranging, and does poorly if it's strongly trending. RSI can be seen hitting overbought a dozen times during a strong bull run without the price action showing more than a few small pull-backs along the way. Makes sense: it is essentially built to analyze what it thinks of price action if you'd assume that the price will stay within the same range, or is given time to consolidate after having broken out of a previous range. When you understand this, the answer to our erratic algorithm becomes clear.
We need a trend indicator that stays flat enough when a stock is showing certain types of ranging behavior, but steep enough when it rallies for long enough or ranges so wildly during an erratic time that RSI won't measure it correctly. If we try to do this with a simple moving average, the problem you'll encounter is that it's either too reactive or too sluggish. You want to have some indication on the slope of the moving average, which indicates trend rather than momentum. The difference in slopes in the near term could be read as a form of "MACD", which is obviously momentum, but if you take it day-over-day, it more or less indicates the general trend direction.
Now, we can see on the chart below how we're not trading when RSI is misrepresenting the "overbought" and "oversold" states because it failed to take into account price action and trend, while trading very accurately when the stock is ranging. That's a home run algorithm waiting to enter the next stages: adding optional functionalities, optimization, and a battery of backtests.
Whether you want to build an algo, or trade manually, simply understanding how indicators can complement one another and how you can quantify your pre-existing intuition for "ranging" and "trending" without using complex variables and indicators beyond simple differences of moving averages can be hugely beneficial to your development as a trader.
Hope you learned something and happy trading!

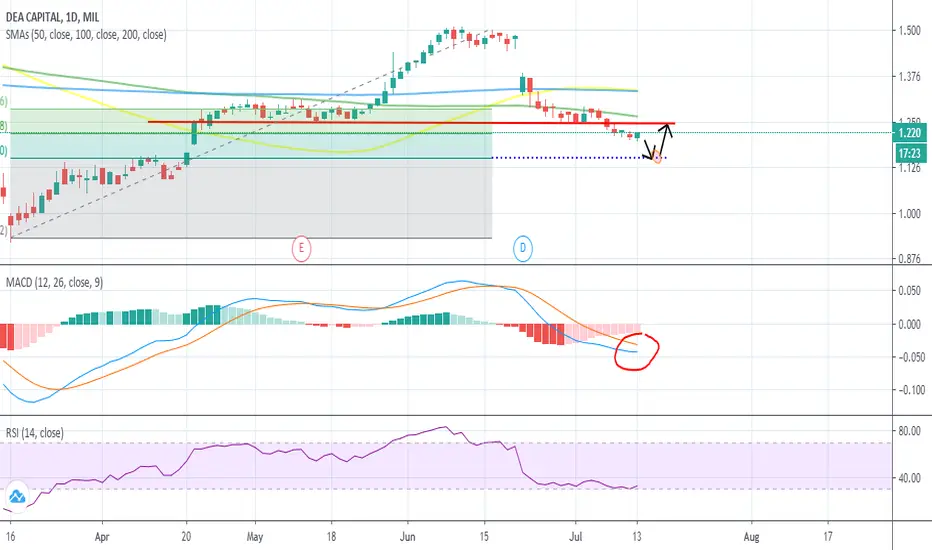
DEA: END OF A RETRACEMENT?Hello traders!
As you can see from the chat above, the BEARISH MOMENTUM is getting weaker and weaker, the MACD LINE is about to overtake the SIGNAL LINE and the RSI is OVERSOLD.
My idea is to wait for DEA to reach the 61.8 FIBONACCCI LEVEL and then going long until the target!
Remember to put a stop loss in order to secure your capital!
Not a financial advice.
Enjoy your trade!
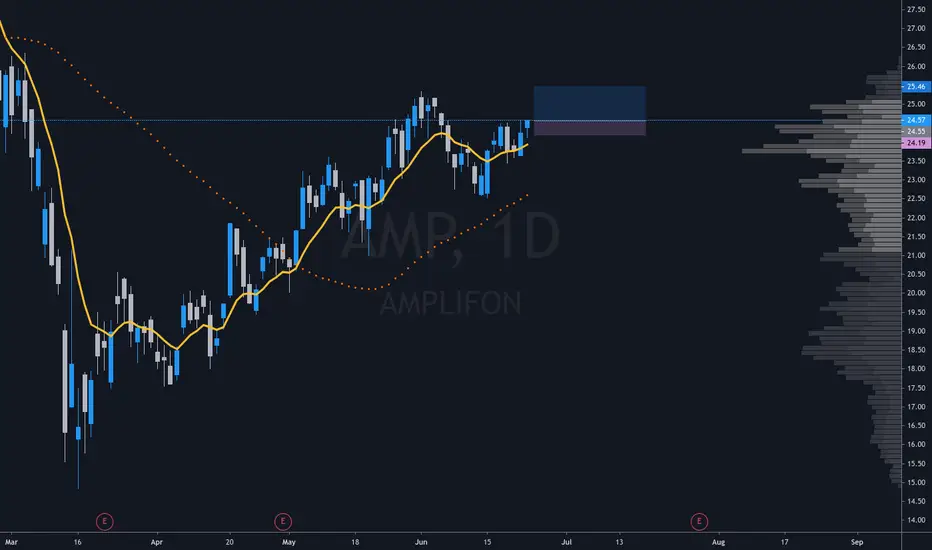
MONCLER Investment opportunityWith the chart stuck in a range and a bullish triangle in the lower time frame, I believe a breakout may be imminent. I also believe that an increase in consumer spending post lock down will benefit the luxury brand.

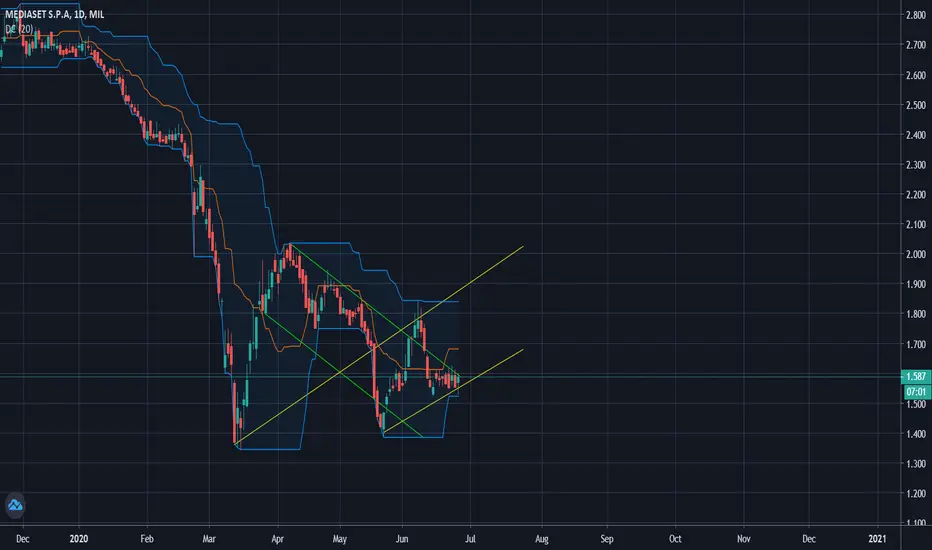
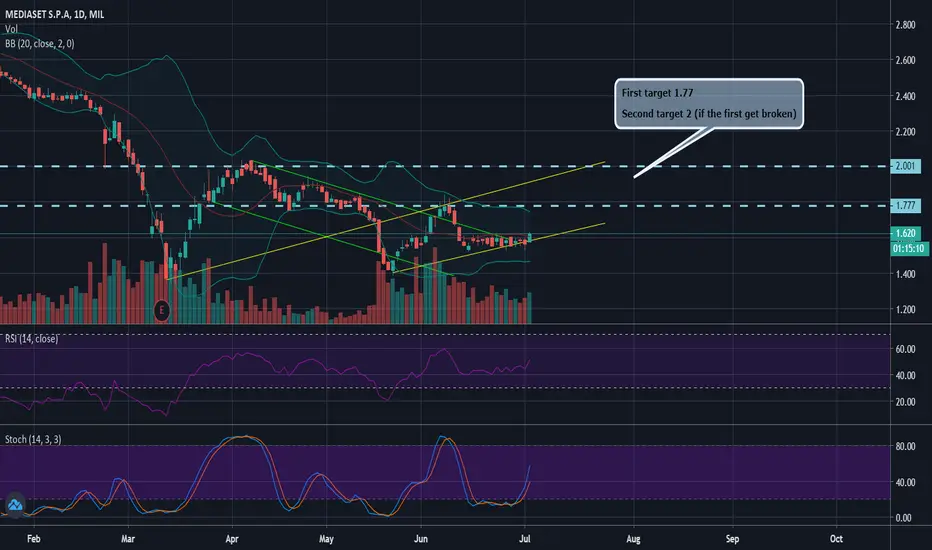
MEDIASET IS BACKthis isn't a financial advice but i like this company ...
very undervalued , probably expansion in EU and more news push MS to the moon soon !!!
Stay tuned and share with friends ;)
MESIASET PREPARE A BULLISH TRENDHi guys i'm back after a long time here ;)
I' m particullary focused on stock market .
This is an italian television and i will monitoring really good.
Soon i will publishing more idea's stay tuned ;)