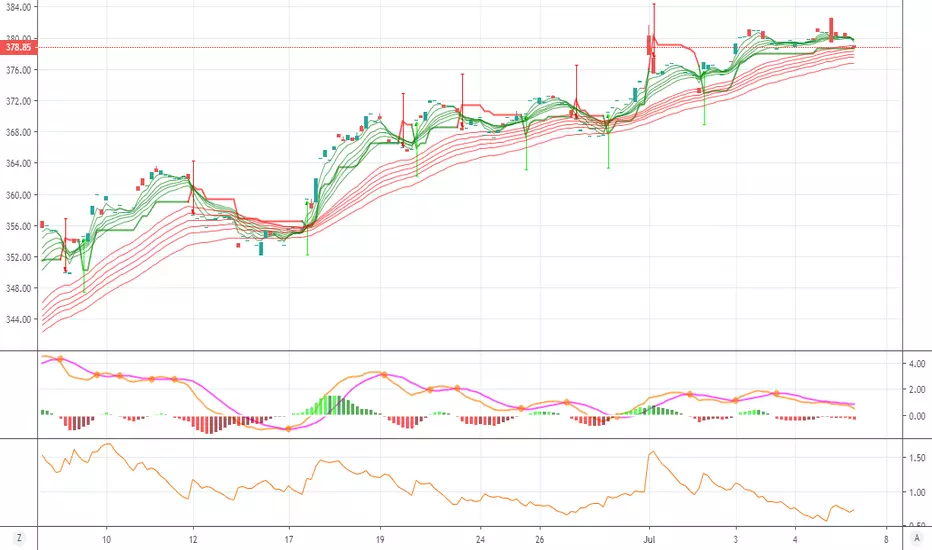
GLOBAL FINANCIAL ENGINEERING SWING TRADING STRATEGY FOR LVMH MoeOur Proprietary Trading System indicates the following:
The Primary Trend (PT) given by the Global Monthly TIME BAR (GMTB) is currently Bullish
The Secondary Trend (ST), given by the Global Weekly TIME BAR (GWTB) is currently Bullish
The Medium Term Trend (MTT), given by the Global Daily TIME BAR (GDTB) is currently Bullish
The Short Term Trend (STT), given by the Global Four Hour TIME BAR (GFHTB) is currently Bullish
We were hoping for a pullback to $343.75, but we might never see this level again within the medium term
In light of the above trend analysis we have started a bullish trade on LVMH Moet Hennessy Louis Vuitton SE using Global Trading Strategy #3 on the Global Automated Trading System #3 which trade in the direction of the Global Daily Time Bars (GDTB).
Global Entry Signal For Trade #1: Buy @ $381.75
Global Trailing Stop Loss Trade #1: @ $354.42
Global Target Profit Trade #1 : @ $600.00
Global Trade Management Strategy: We applied the Global Trailing Stop System for Global Trading Strategy #3.
Check updates
---------
The analysis in this material is provided for information only and is not and should not be construed as an offer to sell or the solicitation of an offer to buy any security.
To the extent that this material discusses general market activity, industry or sector trends or other broad-based economic or political conditions, it should not be construed as research or investment advice.
To the extent that it includes references to specific securities, commodities , currencies, or other instruments, those references do not constitute a recommendation by Global Financial Engineering,Inc. to buy, sell or hold such investments.
This material does not and is not intended to take into account the particular financial conditions, investment objectives or requirements of individual customers.
Before acting on this material, you should consider whether it is suitable for your particular circumstances and, as necessary, seek professional advice.
WAVE 3 ON GOING WITH TARGET 250€Ferrari is winning is race with this spectacular wave 3 on going. The first Fibonacci target of this wave is around 250€

Is Bayer Going To Need Aspirin For Their Roundup Issues?Bayer is a descending Triangle Chart Pattern
Strong support level has been re-tested several times
Continually lower highs puts pressure on this support level
Best patterns have dropping volume and volatility/ATR
Fewer traders are interested in this consolidatation
At some point expect an explosive breakout
Trade Plan
Wait for a close below the support level
Full trade size if volume is at average atr line
1/2 trade size as long as bar has 75% of average volume
Enter two trade
Both trades SL is 1.5xATR
1st trade TP is 1xATR
2nd trade no TP let profit run
When price hits 1st TP move 2nd trade AL to breakeven
Let profit run
If breakout candle is more than 1 ATR wait for price to retrace back towards 1 ATR level to enter

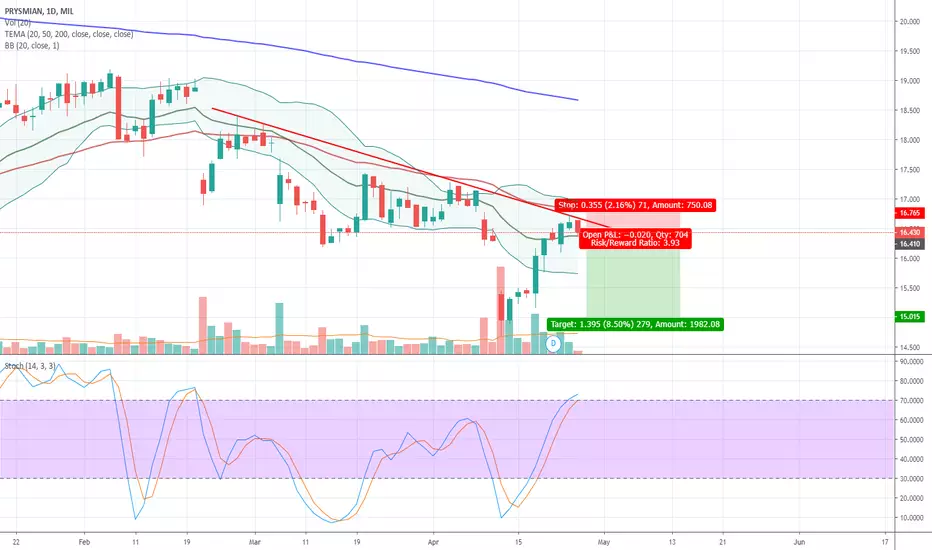
Telecom Italia - SHORT Telecom Italia is a short - target at 0.49 - 11 percent down from the actual level.
This trade has a good risk/reward ratio.
Regards,
Simone

predictable at least until nowthis was very predictable in the past , the channel it was inside has been broken on last days so I'm short here


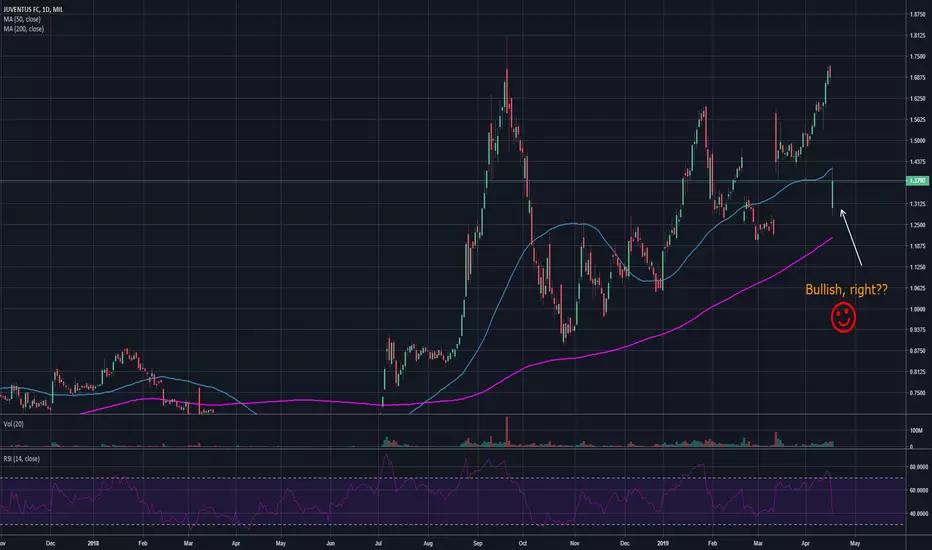
Who's gonna win the match?(***DISCLAIMER: I'm not a professional trader, this is not financial advise, you shouldn't make any trade based on this idea***)
Hello everyone!
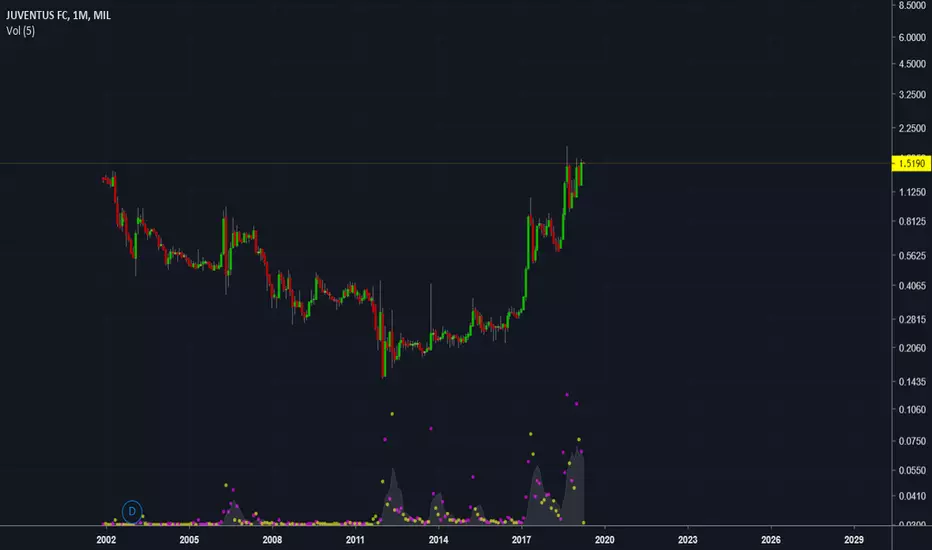
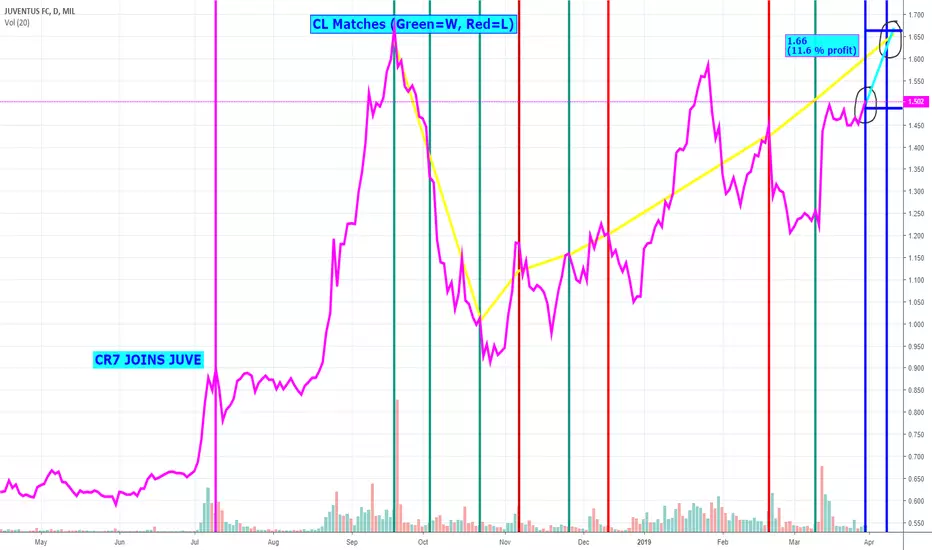
It seems like JUVE broke out of a triangle formation and could easily reach its previous ATH, around 1.80€ range, if it's going
to win tomorrow's match against AJAX FC.
On the fundamental side sentiment (and expectations) are pretty high, especially after Juventus FC last game,
as it is one of the favourite UCL teams.
Let's see how this will play out!

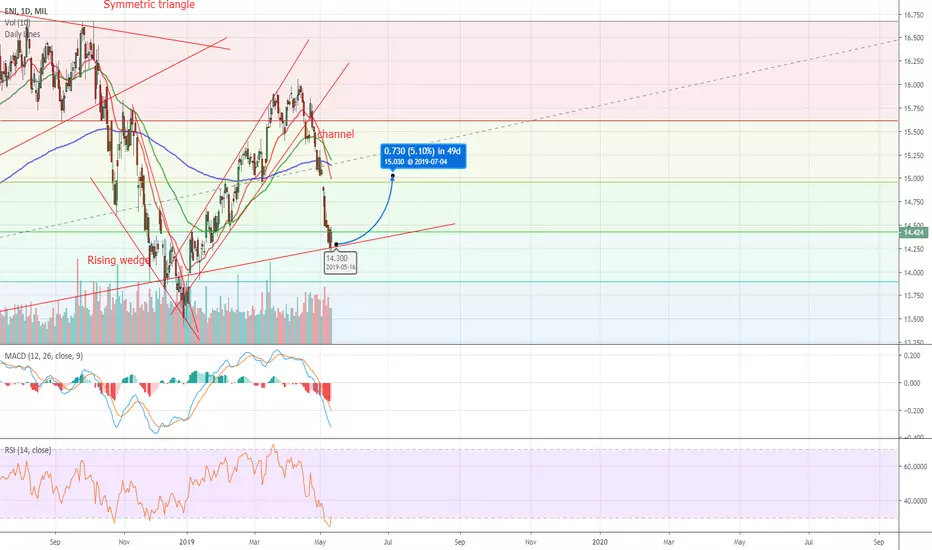
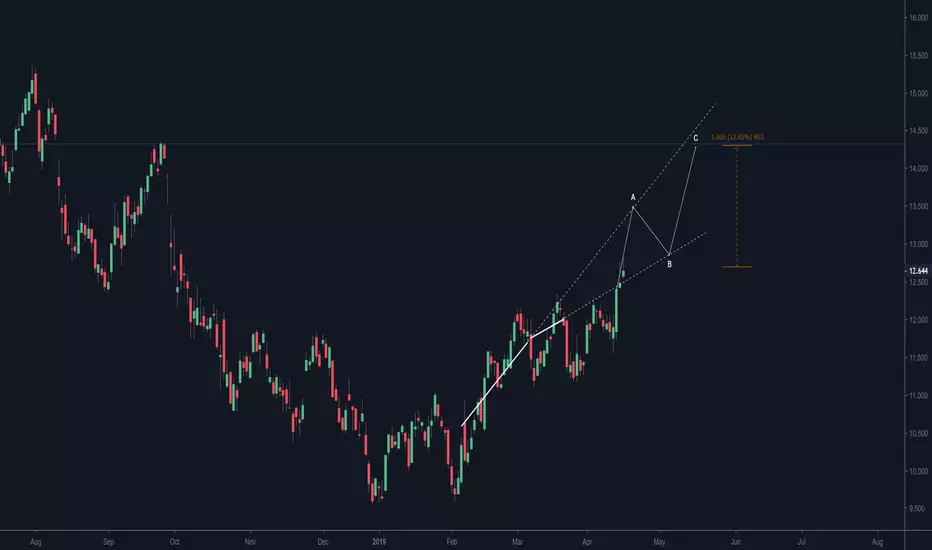
UCG before 13% rise. The ATR's second ATR axis became flatter. Probably, this exchange rate axis may be the wave of the next wave motion wave. As shown. I assume the construction of the double wave structure is further. The target price is 14.31 usd.
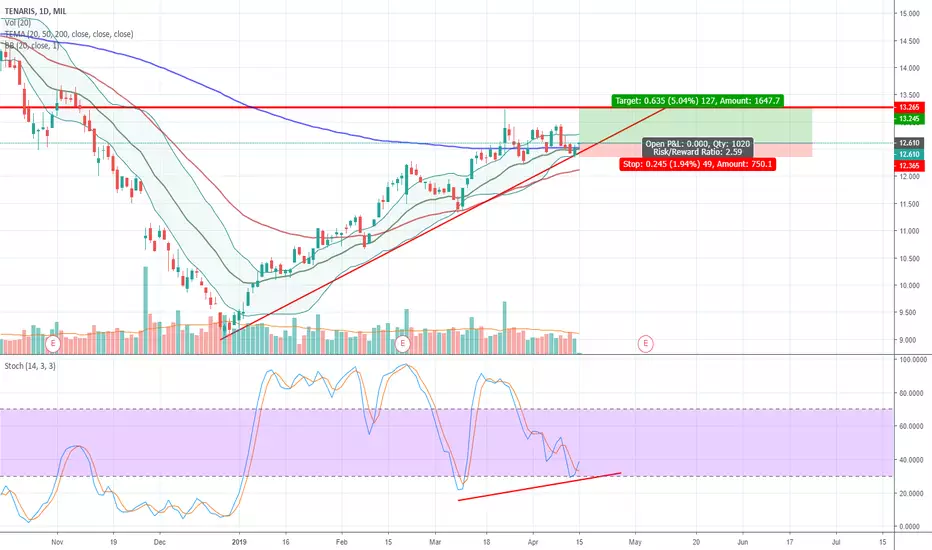
Possibile long su tenarisTrend line rispettata in pieno, si punta sulle primissime resistenze. Se superate, tenere il titolo per altri giorni/mesi. Il titolo ha dei ottimi fondamentali.

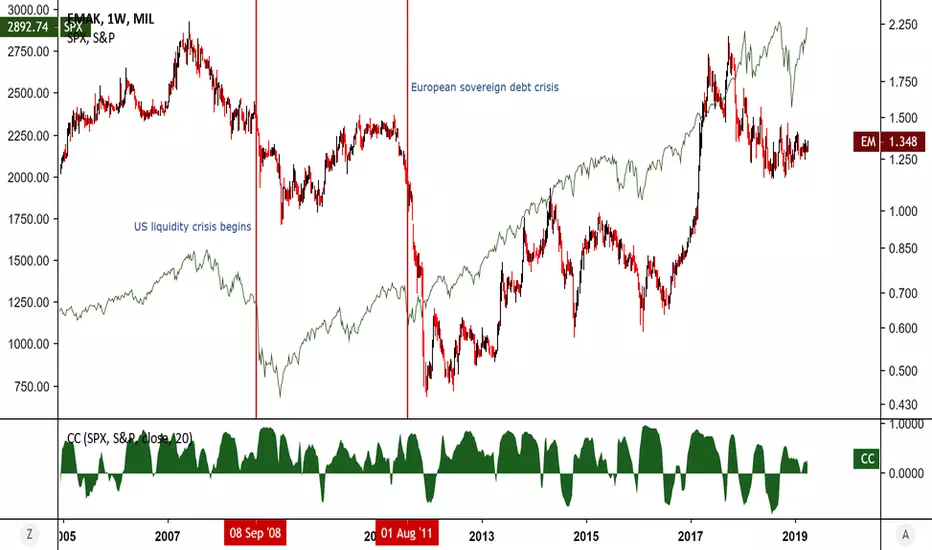
Expect a Downturn in EM If you Expect a Downturn in the USIts not quite a great idea to invest in EM if one is expecting a downturn as EM will be significantly hit from drying up liquidity via outward capital flows and lower investment. Happened in 2008 with the liquidity crisis and again in 2011 with the EU sovereign debt crisis. We can see this relationship between developed markets and emerging markets through a correlation coefficient between the S&P 500 and the most liquid emerging markets ETF in the world EM. Moreover, EM is vulnerable to a Chinese financial crisis as well if the Chinese can't figure out how to lower their debt levels which they really havn't yet. Either way, I would avoid EM at these price levels.
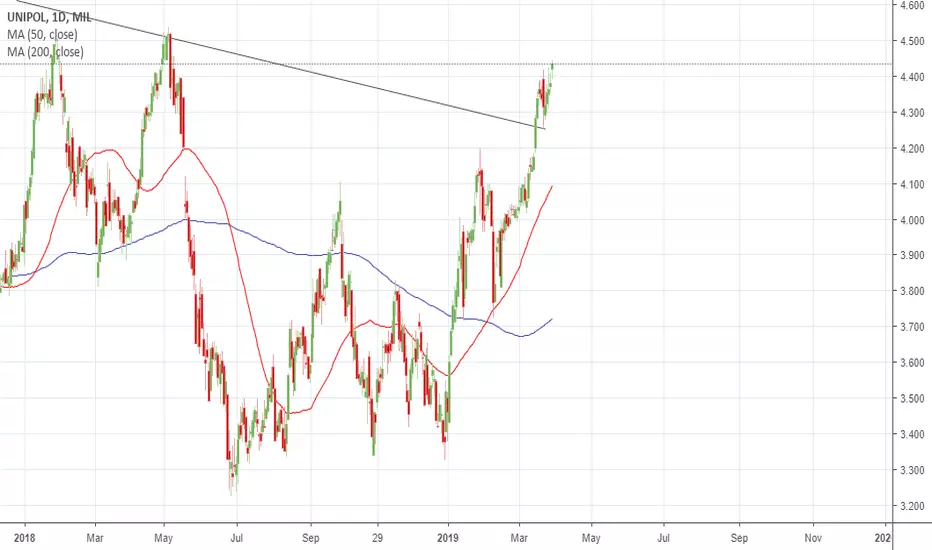
Take-off!Breakout deciso di Unipol con tanto di retest. Entro in chiusura e la seguirò con ansia dal prossimo Lunedi. Il fine settimana sarà comunque
sereno..

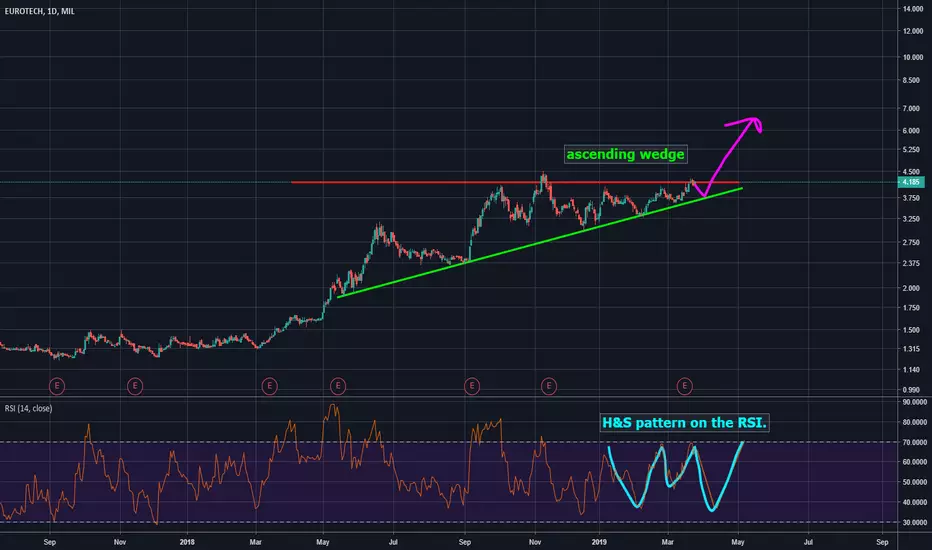
Eurotech SpA ready for an upwards breakoutqThe end of an ascending triangle is nearing and with a head and shoulders pattern forming in the RSI it is poised to break upwards.