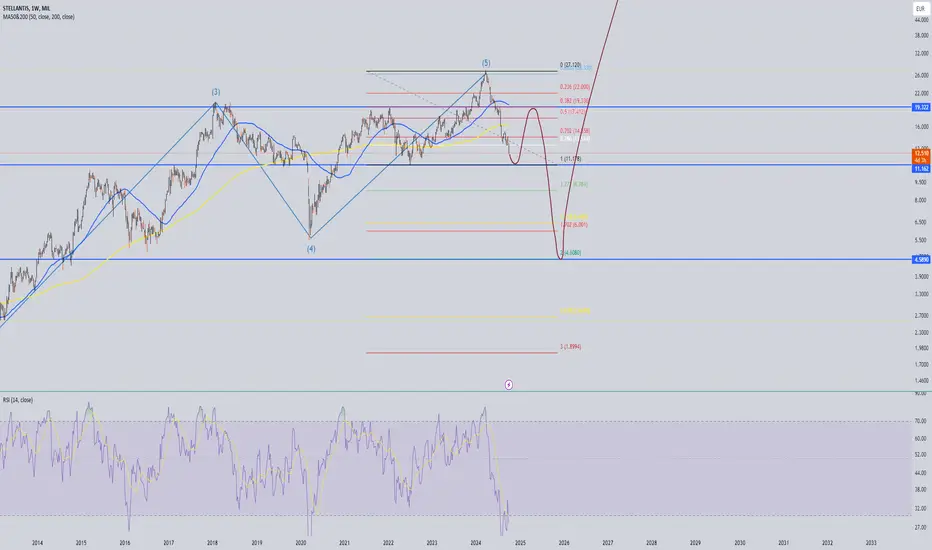
STELLANTISCorrection incomming
Hope to see a perfect H&S. So first a strong buy to the upside and then 5 waves down to the 4.58 area. Lets see what will happen.
BGN - 5 months RECTANGLE══════════════════════════════
Since 2014, my markets approach is to spot
trading opportunities based solely on the
development of
CLASSICAL CHART PATTERNS
🤝Let’s learn and grow together 🤝
══════════════════════════════
Hello Traders ✌
After a careful consideration I came to the conclusion that:
- it is crucial to be quick in alerting you with all the opportunities I spot and often I don't post a good pattern because I don't have the opportunity to write down a proper didactical comment;
- since my parameters to identify a Classical Pattern and its scenario are very well defined, many of my comments were and would be redundant;
- the information that I think is important is very simple and can easily be understood just by looking at charts;
For these reasons and hoping to give you a better help, I decided to write comments only when something very specific or interesting shows up, otherwise all the information is shown on the chart.
Thank you all for your support
🔎🔎🔎 ALWAYS REMEMBER
"A pattern IS NOT a Pattern until the breakout is completed. Before that moment it is just a bunch of colorful candlesticks on a chart of your watchlist"
═════════════════════════════
⚠ DISCLAIMER ⚠
Breakout Area, Target, Levels, each line drawn on this chart and any other content represent just The Art Of Charting’s personal opinion and it is posted purely for educational purposes. Therefore it must not be taken as a direct or indirect investing recommendations or advices. Entry Point, Initial Stop Loss and Targets depend on your personal and unique Trading Plan Tactics and Money Management rules, Any action taken upon these information is at your own risk.
═════════════════════════════

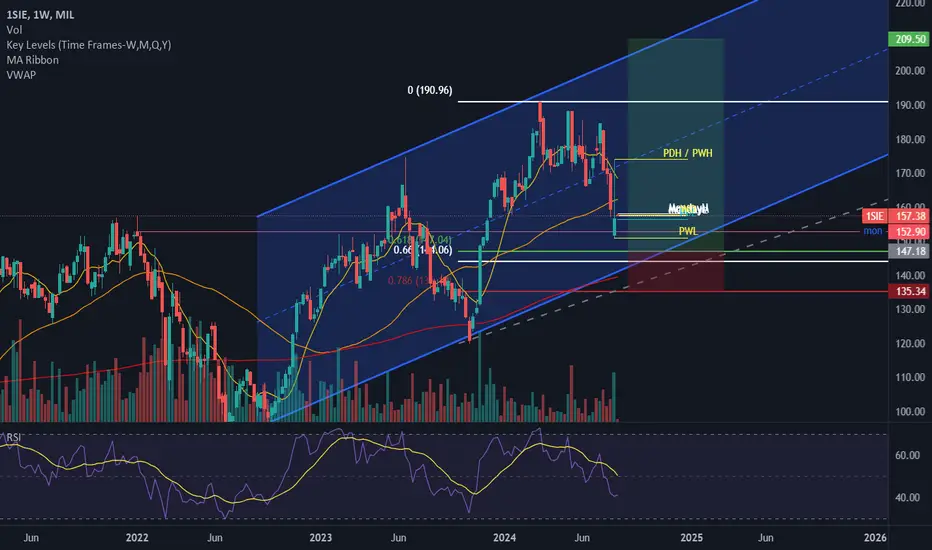
parallelChannel+Fib0.61: Siemensnice HH-HL forming at monthly level, curent price level is close to HL, 0.61 fib level and at monthly support. seems nice setup to trade with good R:R
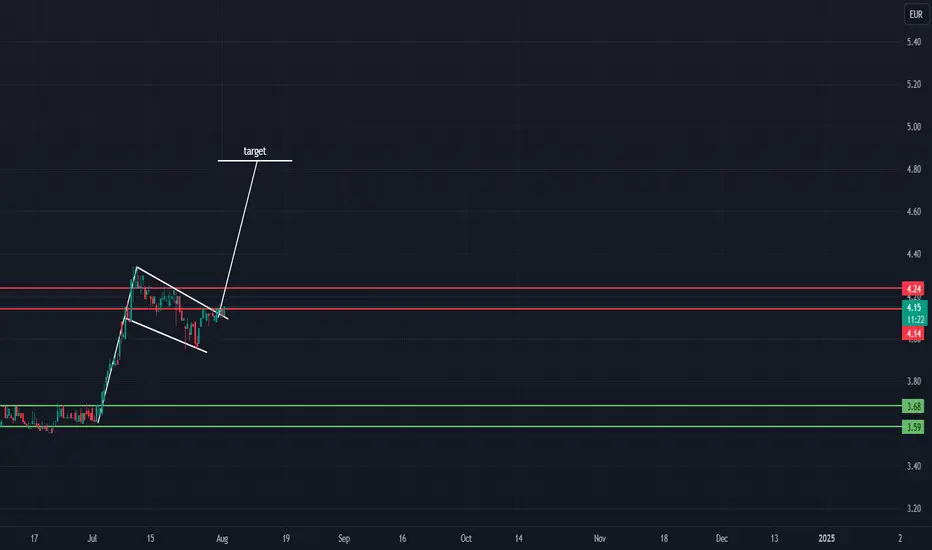
BFG bull flagHi traders. On the chart we can see a bull flag, a good strategy would be taking a long position as the breakout is just occurring. If it is not a fake out we are expecting explosives more to the upside, with a technical target at 4.84$.
Good luck!
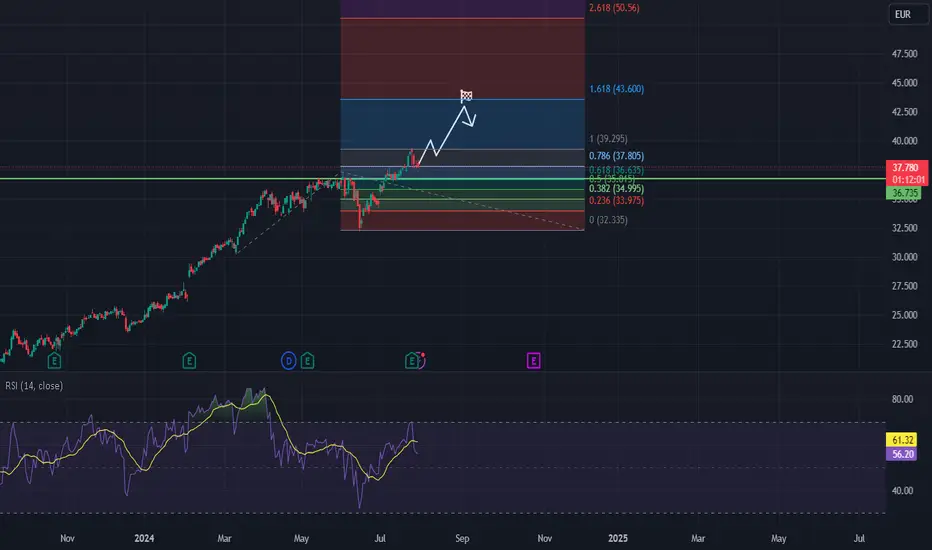
UCG longUCG is in the long term uptrend, the price recently broke the previous a ATH and retested previous resistance and confirmed it as a support. Our strategy is to take a long position and play trend continuation, long position can be taken now. Our target is at 43,450.
Good luck
lets make it simple with price actionSince the good entry in the second week of March 2023 price action is respecting the trend line. On friday 29 Sept our position could have been closed if we had a take profit under the volatility stop level (10 lenght 1.5 multiplier) but we should have bought again on Oct 4 2023.
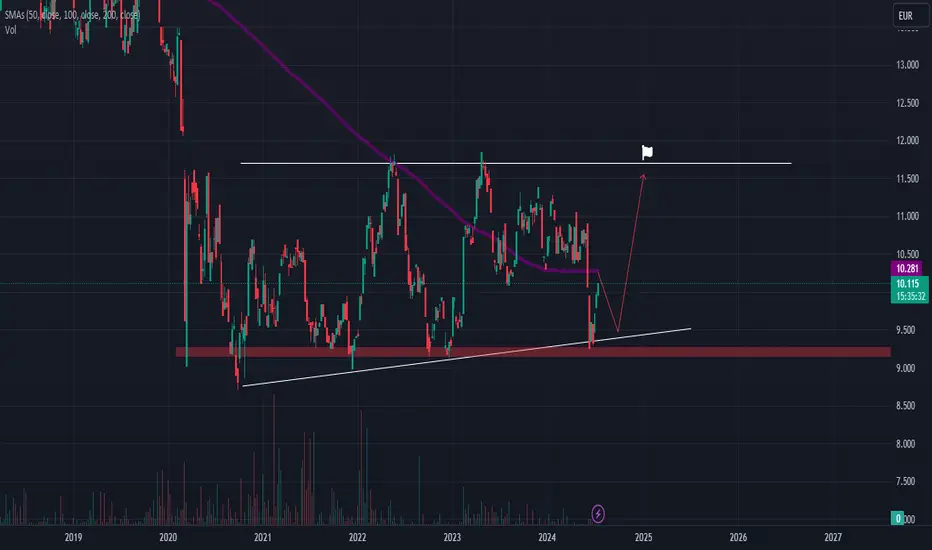
Orange may be bullish soonThe Orange looks pretty good and the chart shows several bullish signals indicating a potential buy opportunity at the current level (or wait for a pullback if the price gets rejected by 200 SMA), emphasizing the quality of this investment. The chart displays a broad trading range between approximately 9.20 (support, RED zone) and 11.70 (resistance zone). This consolidation zone indicates price stability within this range since 2020. The key support level at 9.20 has acted as a strong support multiple times, showing significant demand at this level. The current price is close to this support, offering a
potentially good buying opportunity. The key resistance level at 11.70 (red line) is
significant; a breakout above this level with high volumes would be a strong bullish signal.
The 200-day moving average (SMA 200, purple line) is currently at 10.200, While the price is below this average, a move towards it could indicate a bullish recovery. Volume analysis shows stable activity without significant spikes, indicating consistent investor interest and suggesting a stable zone before a potential rise. These factors combined
suggest a strong potential for price appreciation at the current level. The confluence of
strong support, well-defined trading range, reference from the SMA 200, and stable volumes
highlights the dossier's high quality, making it an attractive entry point for investors seeking a
reliable and rewarding investment opportunity.
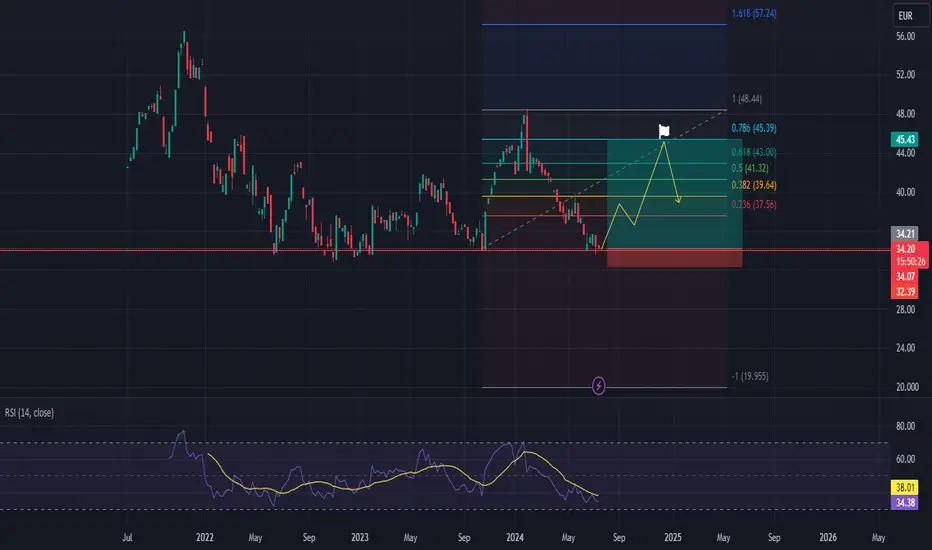
Dassault Systèmes - make or breakhi traders,
The Dassault Systèmes chart doesn't look bad as the price is at the key support now.
In the past, we saw a significant demand and investor confidence at this price point.
Volume analysis reveals increased trading activity around support levels, suggesting that
investors are accumulating shares at this price.
Our final target is at the 0,786 fib level (around 45 $).
Stoploss: 32,40
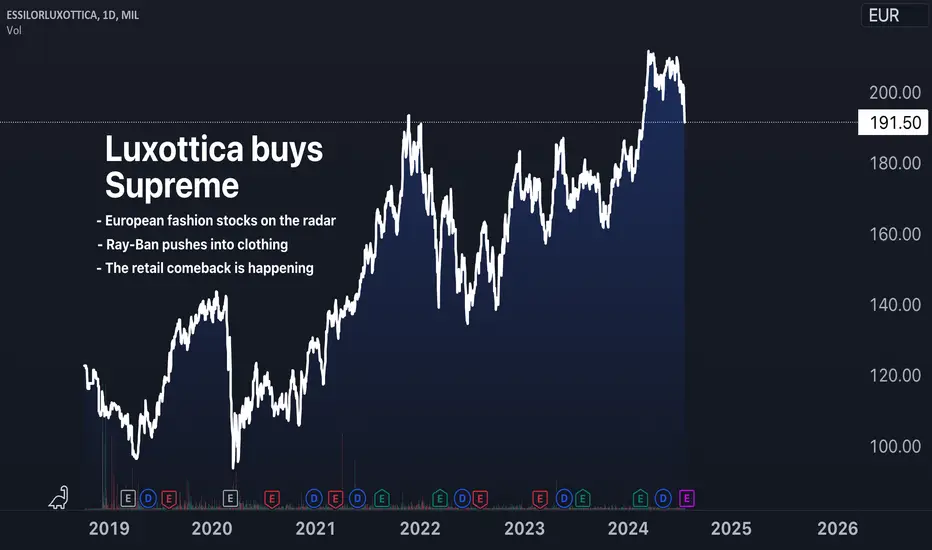
Supreme is now European: The World's Fashion Capital ExpandsA certain acquisition caught my attention this week. The company sunglass company Ray-Ban (owned by EssilorLuxottica) has just acquired Supreme for $1.5 billion in their first push into clothing. For those of you who know the street wear brand Supreme, this should come as a rather interesting acquisition, specifically that Supreme is considered a significant brand in the fashion arena.
I have a few thoughts on this:
1. This acquisition underscores the immense value that a strong brand can command in the market. Supreme is known primarily for its simple yet highly coveted logo. There's a valuable lesson here.
2. Ray-Ban is owned by EssilorLuxottica, a European conglomerate, which is traded as an American Depositary Receipt (ADR) under the ticker OTC:ESLOY and on the Milan exchange as shown in the chart above $MIL:1EL.
3. In a future post, I am going to compile a list of interesting European fashion stocks to keep your eyes on. One stock in particular has my CLOSE attention. More on this later.
What I'm saying here is that EssilorLuxottica's ownership of Ray-Ban, and now Supreme, highlights the influence of European companies in the global fashion industry considering all of the other European fashion brands. It's safe to say that Europe, quite literally, the capital of fashion.
I must say, there is more to this story as well. I've previously written about On Cloud as well and its threat to Nike. I linked that idea below.
Something to think about...
Also, well done Europe!
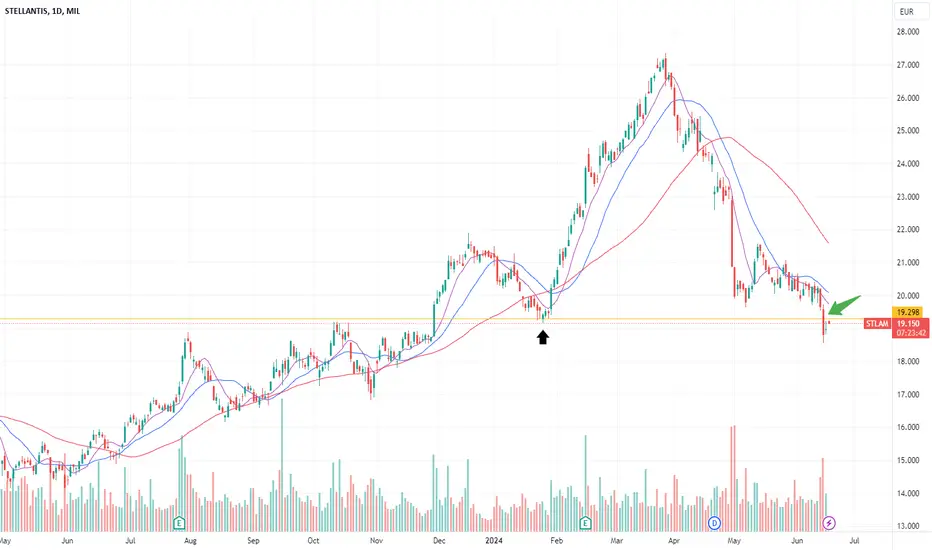
Trend change confirmationStellantis (STLAM) confirmed a change of trend. This could present a shorting opportunity.

Trend change confirmationStellantis (STLAM) Milan market, just confirmed a change of trend by breaking the last significant low. This could present a shorting opportunity.
New clean green and meanI checked the budget last year and noticed a increase in spending on energy - I do this every couple of years but this year we can see room is being made for the new industries we are evolving...IBM as always takes a high percentage of THIS money, I have watched this game for many years... Ive taken entry @8.6-7 and recently reduced looking to reenter in this area obviously Im not sharing exact entry here - DYOR

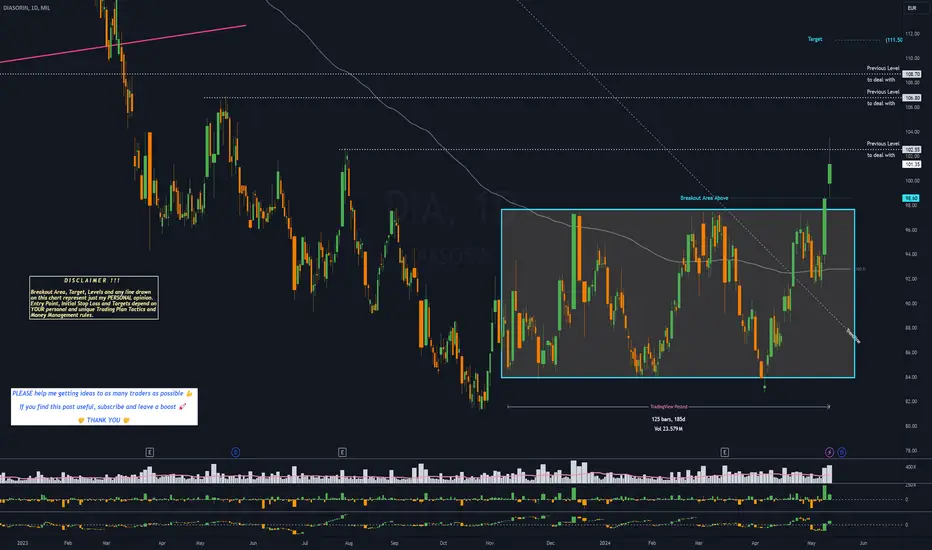
DIA - 6 months RECTANGLE══════════════════════════════
Since 2014, my markets approach is to spot
trading opportunities based solely on the
development of
CLASSICAL CHART PATTERNS
🤝Let’s learn and grow together 🤝
══════════════════════════════
Hello Traders ✌
After a careful consideration I came to the conclusion that:
- it is crucial to be quick in alerting you with all the opportunities I spot and often I don't post a good pattern because I don't have the opportunity to write down a proper didactical comment;
- since my parameters to identify a Classical Pattern and its scenario are very well defined, many of my comments were and would be redundant;
- the information that I think is important is very simple and can easily be understood just by looking at charts;
For these reasons and hoping to give you a better help, I decided to write comments only when something very specific or interesting shows up, otherwise all the information is shown on the chart.
Thank you all for your support
🔎🔎🔎 ALWAYS REMEMBER
"A pattern IS NOT a Pattern until the breakout is completed. Before that moment it is just a bunch of colorful candlesticks on a chart of your watchlist"
═════════════════════════════
⚠ DISCLAIMER ⚠
The content is The Art Of Charting's personal opinion and it is posted purely for educational purpose and therefore it must not be taken as a direct or indirect investing recommendations or advices. Any action taken upon these information is at your own risk.
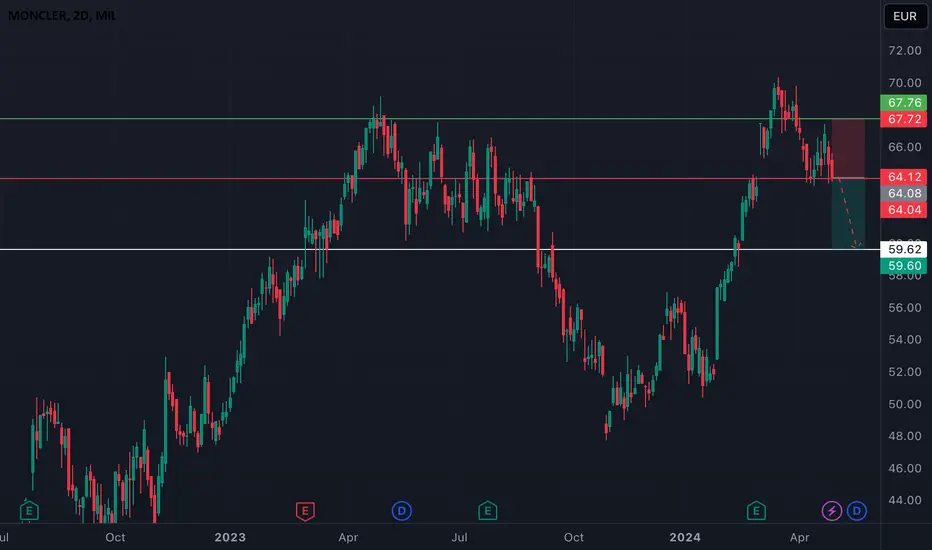
ITALY-MILAN STOCK > ( MONCE ) short ! Based on my graphic analysis I observe a bearish projection reaching minus 7% in the price of this corporation, that is; from € 64 it will drop to € 60. With a buy exit emerging at € 68, it is worth remembering that the exact time the decline will take is unpredictable, the market will simply do its job. We can mention that it will happen within the next 15-20 days from this post!
REFERENCES:
* Green line: emergency exit price: € 68 = -5,7%
* Red line: selling price (position) € 64
* White line: profit €60 = +7%
However, it is important to remember that these marked lines must be respected. If the price goes up 2 to 3% after you execute the position, don't try to improvise and change everything. The movement could return to the initial direction and you will be left frustrated!
"Sitting quietly and waiting for the operation to develop most of the time will allow you to earn much more money. That is, sit in the stands and enjoy the spectacle that the bull will present to you, control your emotions, since the biggest enemy of "The time to invest is yourself"
As for capital management, I leave it to my personal discretion knowing that we must always have money flowing and remain firm in the market.
Greetings and I hope you take advantage of this good negotiation opportunity!
> Josias Baltazar.n
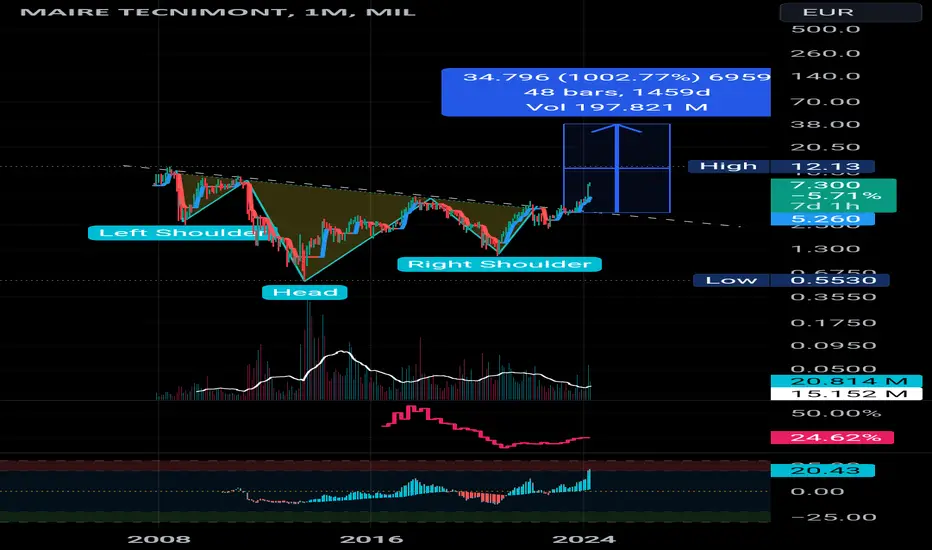
Yearly breakout HEAD AND SHOULDER The technical pattern is fantastic.
Multi year breakout and huge improvement in fundamentals.
Note : Study for educational purposes only
INFINEON TECHInfineon Technologies is not only the largest semiconductor manufacturer in Germany, but it also holds the record for the world's smallest safety chip. This tiny chip, measuring just 0.6 square millimeters, is used in airbags and other critical safety systems in cars. Its small size allows for more compact and efficient designs in vehicles.
Infineon Technologies is a major supplier of semiconductor components and systems to a wide range of leading companies across various industries. Some of the well-known companies they supply include:
1. Automotive: Bosch, Continental, Denso, Valeo
2. Industrial: Siemens, Schneider Electric, ABB, STMicroelectronics
3. Consumer Electronics: Apple, Samsung, Sony, LG Electronics
4. Data & Telecommunications: Cisco Systems, Huawei, Ericsson, Nokia
We will be looking for small entries along the trend line. If the price breaks and remains below the trend line, we will be looking at our accumulation zone.

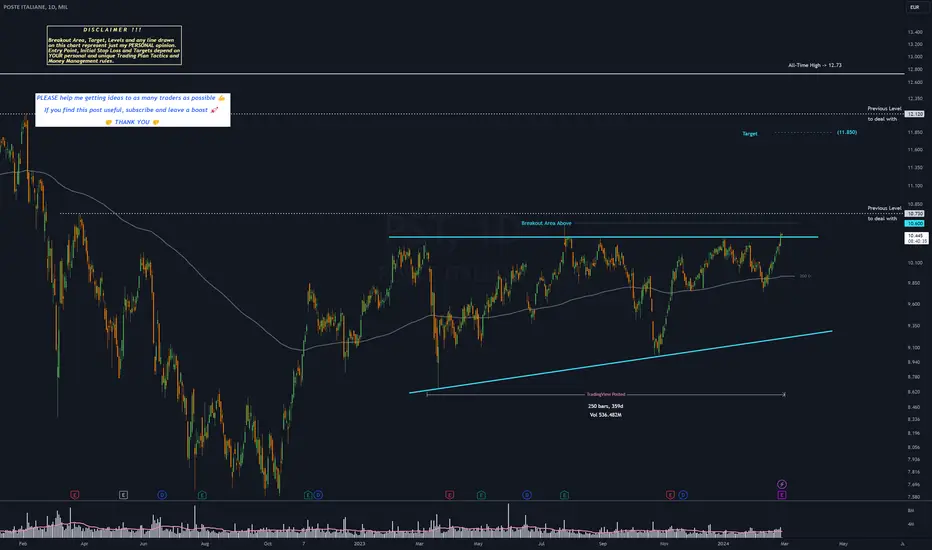
PST - 1 year ASCENDING TRIANGLE══════════════════════════════
Since 2014, my markets approach is to spot
trading opportunities based solely on the
development of
CLASSICAL CHART PATTERNS
🤝Let’s learn and grow together 🤝
══════════════════════════════
Hello Traders ✌
After a careful consideration I came to the conclusion that:
- it is crucial to be quick in alerting you with all the opportunities I spot and often I don't post a good pattern because I don't have the opportunity to write down a proper didactical comment;
- since my parameters to identify a Classical Pattern and its scenario are very well defined, many of my comments were and would be redundant;
- the information that I think is important is very simple and can easily be understood just by looking at charts;
For these reasons and hoping to give you a better help, I decided to write comments only when something very specific or interesting shows up, otherwise all the information is shown on the chart.
Thank you all for your support
🔎🔎🔎 ALWAYS REMEMBER
"A pattern IS NOT a Pattern until the breakout is completed. Before that moment it is just a bunch of colorful candlesticks on a chart of your watchlist"
═════════════════════════════
⚠ DISCLAIMER ⚠
The content is The Art Of Charting's personal opinion and it is posted purely for educational purpose and therefore it must not be taken as a direct or indirect investing recommendations or advices. Any action taken upon these information is at your own risk.


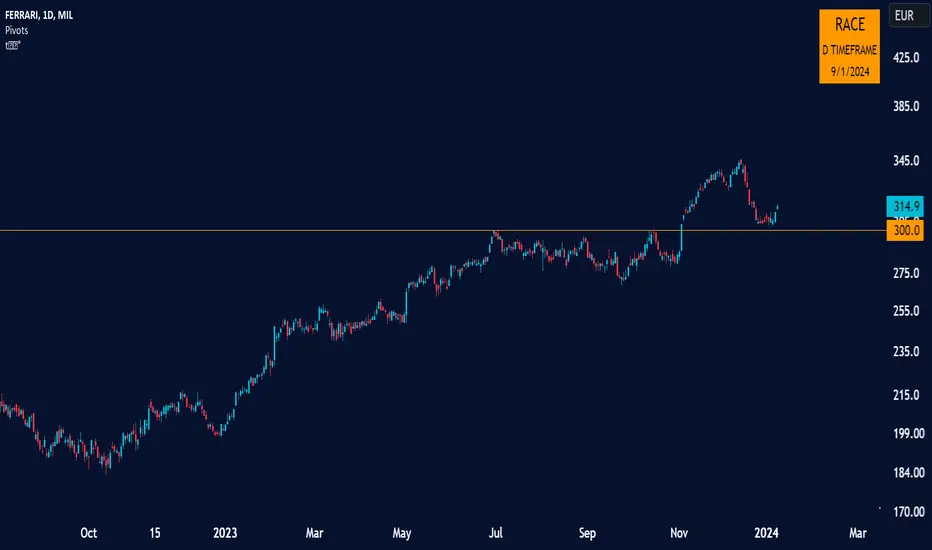
FERRARI: GARTLEY detected + Monitor GapsFERRARI: GARTLEY detected + Monitor Gaps
On the rise:
-possible rebound on the GAP around 327
On the decline :
-return to the EMA.50 around 314
-Then Gap, around 311
-and then EMA.200 around 288.
Pay attention to the GAP at the bottom, around 208

RACEFerrari S.p.A. is an Italian luxury sports car manufacturer based in Maranello, Italy. Founded in 1939 by Enzo Ferrari, the company built its first car in 1940, adopted its current name in 1945, and began to produce its current line of road cars in 1947.
Re-testing the breakout level.