ENEL - 21 months HEAD & SHOULDERS══════════════════════════════
Since 2014, my markets approach is to spot
trading opportunities based solely on the
development of
CLASSICAL CHART PATTERNS
🤝Let’s learn and grow together 🤝
══════════════════════════════
Hello Traders ✌
After a careful consideration I came to the conclusion that:
- it is crucial to be quick in alerting you with all the opportunities I spot and often I don't post a good pattern because I don't have the opportunity to write down a proper didactical comment;
- since my parameters to identify a Classical Pattern and its scenario are very well defined, many of my comments were and would be redundant;
- the information that I think is important is very simple and can easily be understood just by looking at charts;
For these reasons and hoping to give you a better help, I decided to write comments only when something very specific or interesting shows up, otherwise all the information is shown on the chart.
Thank you all for your support
🔎🔎🔎 ALWAYS REMEMBER
"A pattern IS NOT a Pattern until the breakout is completed. Before that moment it is just a bunch of colorful candlesticks on a chart of your watchlist"
═════════════════════════════
⚠ DISCLAIMER ⚠
The content is The Art Of Charting's personal opinion and it is posted purely for educational purpose and therefore it must not be taken as a direct or indirect investing recommendations or advices. Any action taken upon these information is at your own risk.
BMPS - 1 year ASCENDING TRIANGLE══════════════════════════════
Since 2014, my markets approach is to spot
trading opportunities based solely on the
development of
CLASSICAL CHART PATTERNS
🤝Let’s learn and grow together 🤝
══════════════════════════════
Hello Traders ✌
After a careful consideration I came to the conclusion that:
- it is crucial to be quick in alerting you with all the opportunities I spot and often I don't post a good pattern because I don't have the opportunity to write down a proper didactical comment;
- since my parameters to identify a Classical Pattern and its scenario are very well defined, many of my comments were and would be redundant;
- the information that I think is important is very simple and can easily be understood just by looking at charts;
For these reasons and hoping to give you a better help, I decided to write comments only when something very specific or interesting shows up, otherwise all the information is shown on the chart.
Thank you all for your support
🔎🔎🔎 ALWAYS REMEMBER
"A pattern IS NOT a Pattern until the breakout is completed. Before that moment it is just a bunch of colorful candlesticks on a chart of your watchlist"
═════════════════════════════
⚠ DISCLAIMER ⚠
The content is The Art Of Charting's personal opinion and it is posted purely for educational purpose and therefore it must not be taken as a direct or indirect investing recommendations or advices. Any action taken upon these information is at your own risk.

ISP - 9 months ASCENDING TRIANGLE══════════════════════════════
Since 2014, my markets approach is to spot
trading opportunities based solely on the
development of
CLASSICAL CHART PATTERNS
🤝Let’s learn and grow together 🤝
══════════════════════════════
Hello Traders ✌
After a careful consideration I came to the conclusion that:
- it is crucial to be quick in alerting you with all the opportunities I spot and often I don't post a good pattern because I don't have the opportunity to write down a proper didactical comment;
- since my parameters to identify a Classical Pattern and its scenario are very well defined, many of my comments were and would be redundant;
- the information that I think is important is very simple and can easily be understood just by looking at charts;
For these reasons and hoping to give you a better help, I decided to write comments only when something very specific or interesting shows up, otherwise all the information is shown on the chart.
Thank you all for your support
🔎🔎🔎 ALWAYS REMEMBER
"A pattern IS NOT a Pattern until the breakout is completed. Before that moment it is just a bunch of colorful candlesticks on a chart of your watchlist"
═════════════════════════════
⚠ DISCLAIMER ⚠
The content is The Art Of Charting's personal opinion and it is posted purely for educational purpose and therefore it must not be taken as a direct or indirect investing recommendations or advices. Any action taken upon these information is at your own risk.

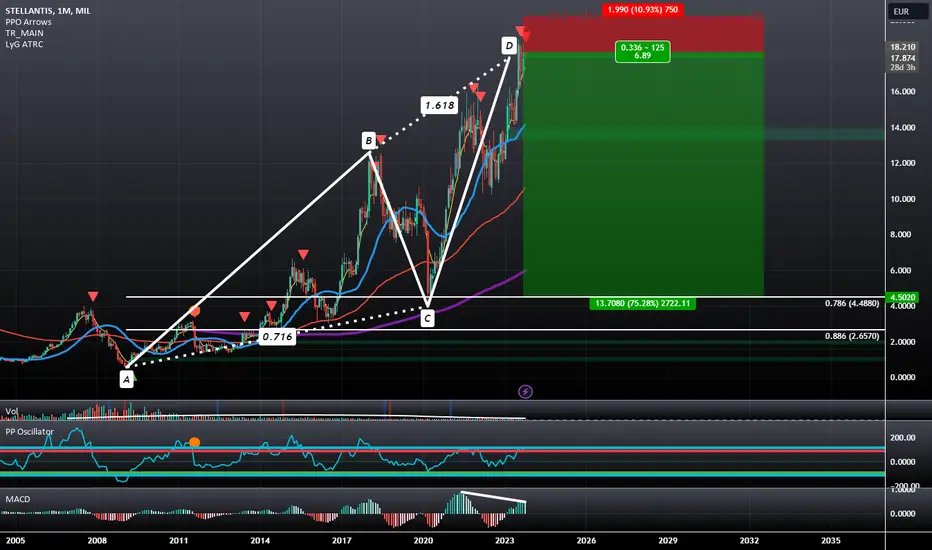
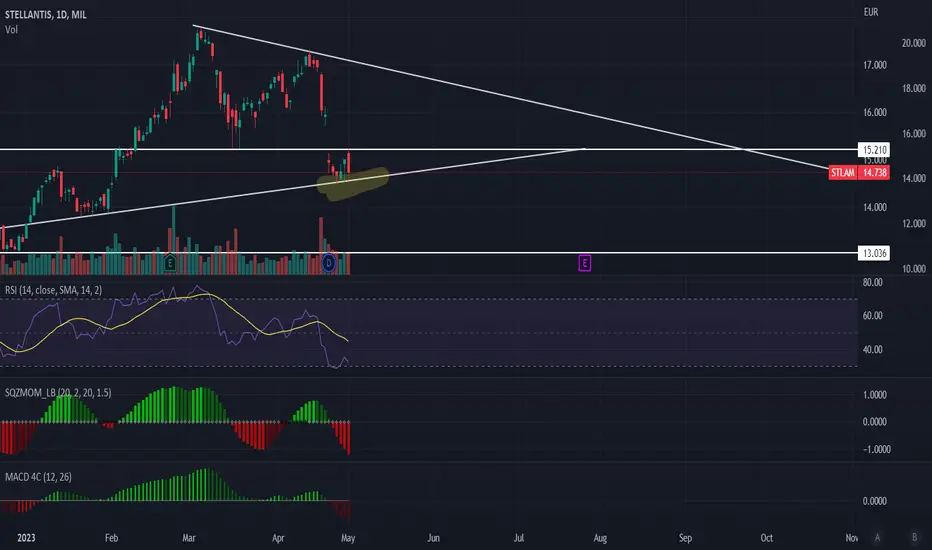
Stellantis: Bearish ABCD with Multiple Monthly ConfirmationsStellantis: The Nvidia of Autos has formed a Bearish ABCD that is visible on the Monthly Timeframe with MACD Bearish Divergence and Bearish PPO Confirmation. If this plays out, we could see this go towards the C level, which aligns with the 0.786 retrace at €4.48
Moncler: A Stylish Investment on the RiseHello investors,
In this report, we dissect the financial intricacies of a prominent stock, leaving no detail unexplored. From market capitalization and price-to-earnings ratio to revenue conversion and cash reserves, we analyze every facet to equip you with strategic insights. We'll go beyond the numbers and charts, painting a vivid picture of the company's financial health. Moreover will be also sharing with you at the end what is my personal expert opinion and future outlook for the financial details of Moncler.
Moncler is a luxury fashion company with a market capitalization of 16.875 billion EUR. It currently trades at a Price to Earnings (P/E) ratio of 31.05, which indicates that investors are willing to pay 31.05 times the company's earnings per share (EPS). The current Basic EPS (TTM) stands at 2.01 EUR.
Now, let's dive into the Revenue to Profit Conversion for the year 2022:
- Total revenue: 100%
- Gross profit: 68%
- EBITDA: 40%
- Net income: 23%
The Revenue to Profit Conversion indicates that Moncler is generating a reasonable amount of revenue, but the conversion of that revenue into profits is somewhat lower. This could be an area of concern for investors, as a higher gross profit and net income conversion would generally be preferred.
Next, let's examine Moncler's financial health based on key financial metrics for the years 2018 to 2022:
- Debt: The company's debt has increased over the years, reaching 912.78 million EUR in 2022. This increasing debt level is a point of caution and needs to be monitored closely, as it may affect the company's financial flexibility.
- Free Cash Flow: Moncler has shown a fluctuating trend in free cash flow, with significant variations from year to year. While the H1 2023 free cash flow stands at 492.72 million EUR, this could impact the company's ability to invest in growth opportunities or return value to shareholders.
- Cash and Equivalents: Moncler has maintained a relatively stable level of cash and equivalents over the years, which provides a degree of liquidity and financial strength.
Now, let's analyze the Financial Position based on the figures from 2022:
- Short-term Assets: 1.62 billion EUR
- Short-term Liabilities: 963.71 million EUR
- Long-term Assets: 3.02 billion EUR
- Long-term Liabilities: 773.31 million EUR
Moncler's financial position seems relatively strong, with a higher value of assets compared to liabilities, both in the short and long term. However, it's important to keep an eye on the company's debt levels and how they might impact its financial position in the future.
Regarding the company's earnings per share (EPS) history and projections:
- EPS in 2020: 1.18 EUR
- EPS in 2021: 1.53 EUR
- EPS in 2022: 2.24 EUR
- H1 2023: 0.54 EUR
Moncler has shown an increasing trend in EPS, which is generally positive. However, the H1 2023 EPS has seen a decline compared to the previous year. This dip could be due to various factors, and it's crucial to closely monitor the reasons behind it to assess its potential impact on future performance.
Now, let's review the financial statements for H1 2022, H2 2022, and H1 2023:
- H1 2022:
- Total revenue: 918.38 million EUR
- Gross profit: 576.21 million EUR
- Operating income: 180.17 million EUR
- Pretax income: 168.54 million EUR
- Net income: 211.25 million EUR
- H2 2022:
- Total revenue: 1.68 billion EUR
- Gross profit: 1.19 billion EUR
- Operating income: 594.38 million EUR
- Pretax income: 578.79 million EUR
- Net income: 395.44 million EUR
- H1 2023:
- Total revenue: 1.14 billion EUR
- Gross profit: 731.59 million EUR
- Operating income: 217.79 million EUR
- Pretax income: 206.47 million EUR
- Net income: 145.35 million EUR
Moncler's financial statements show an overall positive trend in revenue, gross profit, and net income. However, the H1 2023 figures indicate a decline in net income compared to H2 2022. It's essential to assess the reasons behind this decline and evaluate whether it's a short-term setback or a potential cause for concern.
Future Outlook:
As for me, my rating for Moncler stock would be cautiously optimistic. The company has demonstrated strong financials, stable cash reserves, and a consistent revenue stream. The increasing EPS until 2022 indicates growth and profitability.
However, there are some concerns that need to be closely monitored. The rising debt level and fluctuating free cash flow could impact the company's ability to invest in growth initiatives or handle unforeseen economic challenges.
The decline in H1 2023 net income raises questions about the company's performance during this period. To make a more accurate assessment, it's crucial to investigate the reasons behind this decline and evaluate the company's strategies for addressing potential challenges.
In conclusion, Moncler appears to be a solid luxury fashion company with growth potential, but potential investors should conduct thorough research and analysis to make informed decisions. The financial health and future outlook should be continually monitored, considering the evolving market conditions and economic landscape.
Disclaimer : Please note that the future behavior of the stock is subject to market volatility, industry trends, and global economic conditions. I highly recommend you guys staying updated with the company's quarterly reports and financial statements for a more accurate evaluation of its performance and prospects. Additionally, all of the information that I used can be found in the trading view app related to MONC financial details.
BC - 6 months HEAD & SHOULDERS══════════════════════════════
Since 2014, my markets approach is to spot
trading opportunities based solely on the
development of
CLASSICAL CHART PATTERNS
🤝Let’s learn and grow together 🤝
══════════════════════════════
Hello Traders ✌
After a careful consideration I came to the conclusion that:
- it is crucial to be quick in alerting you with all the opportunities I spot and often I don't post a good pattern because I don't have the opportunity to write down a proper didactical comment;
- since my parameters to identify a Classical Pattern and its scenario are very well defined, many of my comments were and would be redundant;
- the information that I think is important is very simple and can easily be understood just by looking at charts;
For these reasons and hoping to give you a better help, I decided to write comments only when something very specific or interesting shows up, otherwise all the information is shown on the chart.
Thank you all for your support
🔎🔎🔎 ALWAYS REMEMBER
"A pattern IS NOT a Pattern until the breakout is completed. Before that moment it is just a bunch of colorful candlesticks on a chart of your watchlist"
═════════════════════════════
⚠ DISCLAIMER ⚠
The content is The Art Of Charting's personal opinion and it is posted purely for educational purpose and therefore it must not be taken as a direct or indirect investing recommendations or advices. Any action taken upon these information is at your own risk.
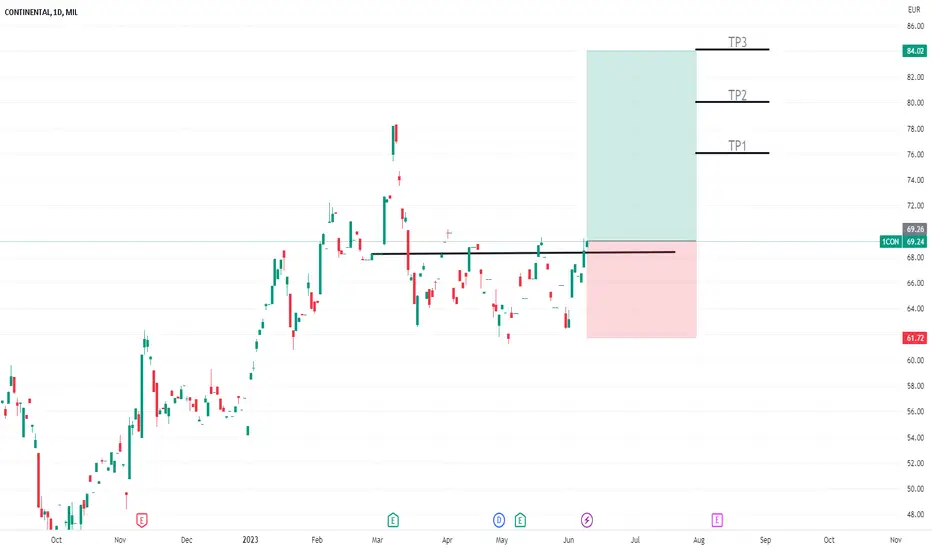
CONTINENTAL new bullish push for expect
Hi viewers, 1CON price break first zone, in last periods bullish market we are have, curentlly here new bullish period expecting
TP1: 76
TP2: 80
TP3: 84
POSTE ITALIANE bullish expectations for next periods
Hi viewers, PST price break first zone, in last periods mostly bullish, currently here now new bullish push expecting
TP1: 11.00

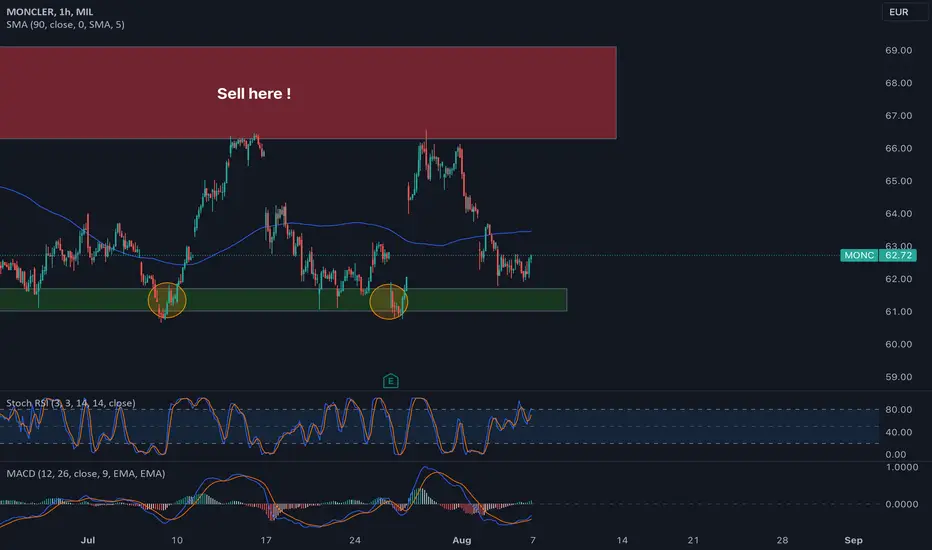
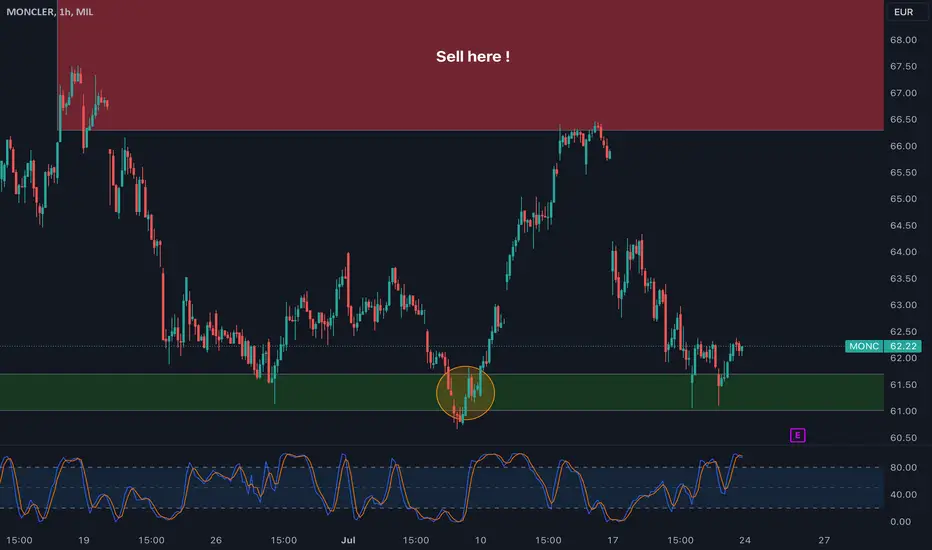
A 4th upper move for Moncler
Upon conducting a comprehensive analysis of the 4-hour price actions of MONC, a prominent 61-61.70 EUR major demand zone becomes apparent. Notably, the price has encountered robust rejection three times at this level, enhancing the support's credibility and accuracy. To further strengthen our insights, we have incorporated momentum oscillators such as the MACD and RSI, which revealed hidden bullish divergence. This favorable indication allows us to anticipate a potential upward movement in MONC's price, with a target of up to 69 EUR. In my professional opinion, this level appears to be an opportune point to consider selling our units, as historical data indicates limited price advancements beyond this area.
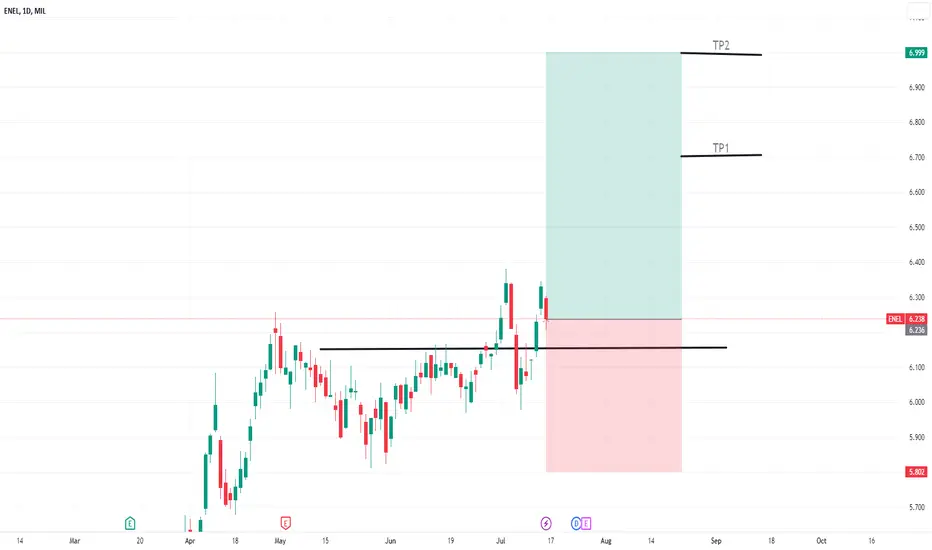
ENEL for future still bullish to expect
Hi viewers, ENEL price is break first zone, in last periods strong bullish push we are have, currently here for next periods still bullish to expect
TP1:6.7
TP2:7
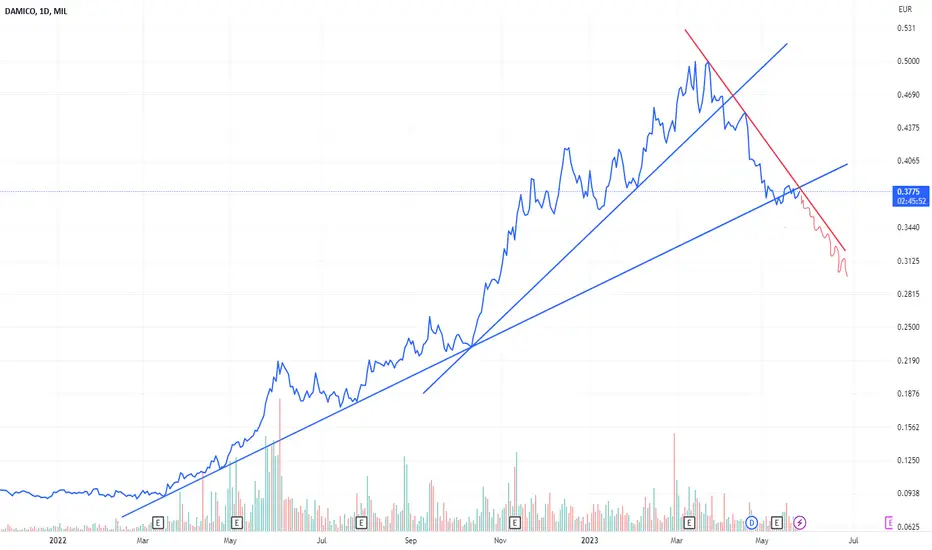
post bundling 1/10 updateit absolutely must not pierce down the red line. If she does she won't stop anymore...
Distribution phase in actionDistribution phase in MIL:TISG according to a Wyckoff pattern. Watch out below

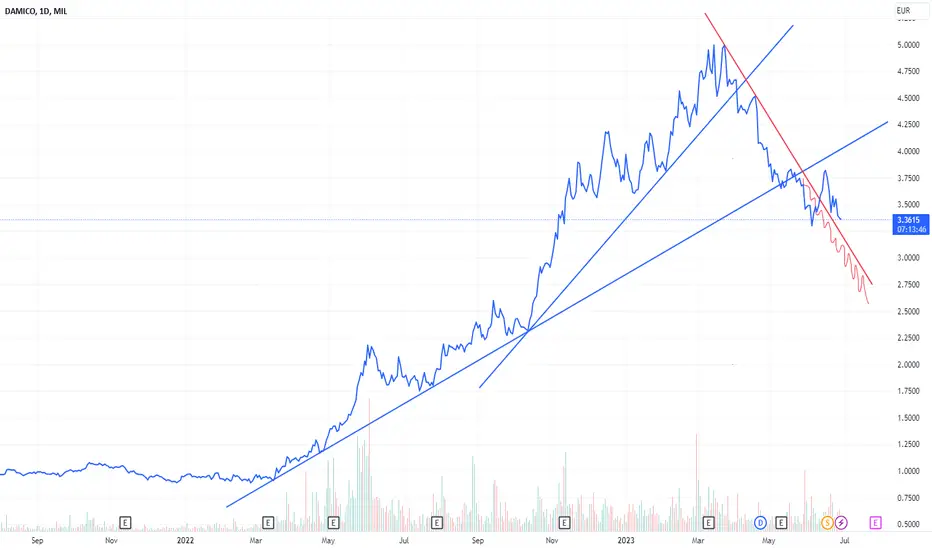
D'AMICO: broken the 2 trendlinesUnfortunately it doesn't seem to be set up anymore. We hope that she can recover the uptrend. There are still a few days left to resume the ascent.
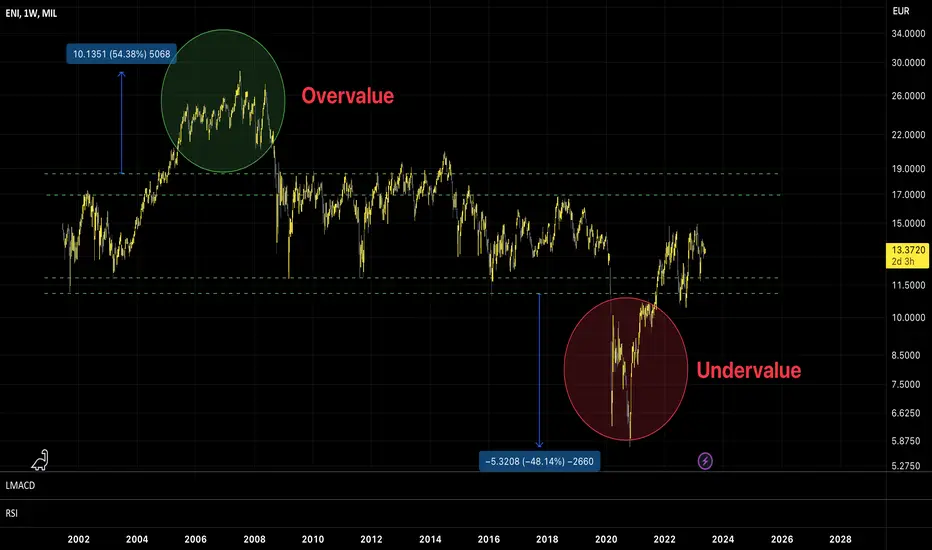
ENI: MAKE MONEY SIMPLYEni, the largest company we have in Italy.
I simply show u what it means to invest by doing some trades without having to search for the nex Tesla or the perfect entry point on Bitcoin.
Eni pays good dividends, the price range is obvious even for a child, so why not use it? Or, why not to sell and buy bacj at undervalue prices when the price goes overvalue again?
I know it sounds complicated, that's why i teach/share/explain (call it what u want) simple ta, because the more groundes we stay the easier it becomes to make money.
There are opportunities like this over the years, but 99% of u that try to make money don't see it because u want to follow false chimeras hoping for 3.000% in 2 months by following some shitcoin or over leveraged forex scalping.
BUY STLAhere is an example when both technical and fundamental analysis are really interesting.
i'm buying
:)
tell me your idea below, thanks
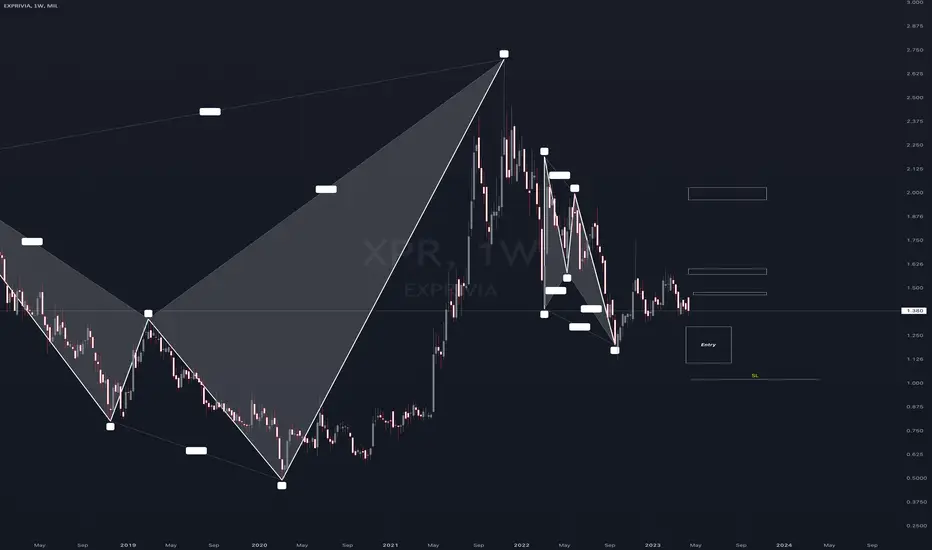
XPR [Exprivia] - Potential Long OpportunityStock: Exprivia
Ticker: XPR
Entry and Upside Targets on Chart.
Volkswagen it's about time to buy!Hello traders,
I hope you are doing great!
I know it's been a long time since the previous trade idea here in Trading view but a lot is going on with "The Greek Traders" community along with the V.I.P trading mentorship programme.
We can see a trade we have also shared on the V.I.P group since the previous week.
We are reffering to the "Volkswagen" stock trade of course, let's see why we are long on the stock as always combining fundamental analysis with technical analysis!As noted in the "The Greek Trader" seminars also, if fundamental analysis doesn't align with technical analysis we don't enter any trade!
Firstly we are in clear bear market in Volkswagen stock since almost 2 years now from the high of 357.40 euros at 15/03/2021, as uncertainty from Covid-19 hit the markets.Also less incetives from the governments for the purchase of an EV vechicle as the maket is entering a more mature stage along with supply chain bottlenecks, rising inflation and geopolitical uncertainty also took a toll on many companies in 2022.
Technical Observations
1.As we can see after that 2 year downtrend RSI has already started to build a bullish divergence on the weekly timeframe since June of 2022, that's very strong indication of the slowly shifting momentum especially when we are reffering to the weekly timeframe!
2.We can seet the 5 Elliott waves since the high, we are currently on the 3rd wave and we can trade the counter trend 4th wave to the upside.
3.The 4th Elliott wave that's an equal projection of the 1st wave we can see that coincides perfectly with the Fair value gap that has not been filled and with a previous support/resistance level that has been respected multiple times.That's the reason we will have our TP in that area (162-167 Euros).
4.We have also put the FIbonacci timezones and fibonacci retracements levels and we can see that both of the are aligned with the previous Elliott wave theory.
5.We are waiting a double bottom to be formed or a lower low with bullish divergence and a bullish candlestick formation to enter long at 113-116 Euros area.
Fundamentals Observations
1. The Covid-19 pandemic and subsequent global lockdowns in 2020 saw the stock's price fall to its lowest level in almost five years. After starting at €175.60 on 19 March 2020, it sank to €79.38. Over the later months of the year, as economies began opening up, VOW3 seemingly began to recover and closed the year at €152.40.
2. In 2021, the carmaker announced it was increasing its EV capacity and scaling up MEB (modular electric drive matrix) use. In March, the company stated it planned to deliver a total of 450,000 EVs to customers – more than twice the figure delivered the year before. Volkswagen’s EV sales during the first three-quarters of the year put it in third place, with a 10.1% market share compared to 21.5% for Tesla, reaching an all-time high of 357.40 euros at 15/03/2021.
3. VW group had invested a lot on biofules but as part of the revision of the Renewable Energy Directive (RED), the European Commission proposed reducing the contribution of conventional biofuels in transport from a maximum of 7% in 2021 to 3.8% in 2030, that was a blow for the VW group.Now with the FY23 budget VW is turning it's main focus on the EV sector with more than 200$ billions investments for the next 5 years.
4. 2022 proved to be interesting for the EV market, Iola Hughes of Rho Motion told INN at last year’s Benchmark Week. Headwinds for the sector came following Russia’s invasion of Ukraine and China’s lockdowns in the first few months of the year.EV-volumes.com sales data shows that the global total for last year came in at 10.5 million units across BEVs and PHEVs.
“An impressive growth of 55,4 percent in a difficult vehicle market as a whole. BEV sales increased by 59 percent to 7,65 million units, PHEVs by 46 percent to 2,86 million units,” the firm states. “The global EV share in light vehicle sales is 13 percent for 2022.”
5.Supply chain constraints appear to be easing and sales expectations for 2023 for passenger cars and light-duty vehicles, Rho Motion forecasts over 14 million global BEV and PHEV sales in 2023.
6.(Reuters) - South Carolina Governor Henry McMaster on Monday signed legislation approving $1.29 billion in state incentives for Volkswagen's off-road brand Scout Motors to build a $2 billion manufacturing plant for trucks and SUVs.
The project could also receive up to $180 million in job development tax credits based on hiring, said South Carolina Commerce Secretary Harry Lightsey.
In May, VW said it would reintroduce the Scout off-road brand in the United States, offering new electric pickup and sport-utility vehicles. Scout said it hopes to eventually create 4,000 jobs and produce 200,000 Scout vehicles annually.
Groundbreaking is planned for mid-2023 and production is projected to begin by the end of 2026.
7.Earlier this month Volkswagen said 2023 sales will rise by between 10-15%, and the operating profit margin will be between 7.5 and 8.5% compared with 7.9% in 2022.
POSSIBLE LONG TRADE
ENTRY AT THE RETEST OF 113-1.116 EUROS LEVEL
TP1 163 EUROS
TP2 167 EUROS
STOP LOSS 111.80-112 EUROS
RISK/REWARD 17.60-17.70 !
THANK YOU ALL FOR SUPPORT!!
KEEP FOLLOWING AND SUPPORTING MEANS A LOT TO OUR ME!
Happy profits everyone!!
THE GREEK TRADER

LONG LVMH. Bullish in the long run. - Reopening of Chinese economy could save the luxury producers from dumping too low.
- Strong revenue and P/E ratios.
- Will enter the long at levels shown in the diagram, based on S/R and trend lines.
- Will hold the stock from mid to long term. This is not a short term trade.

Waiting for a pull-back before ↗Placed a limit buy order in this stock. Let's see how it works out. The reasons can you see on the charts - if I should explain them leave just a comment here. ;)
TIT - TELECOM ITALIA - SHORT IN NEXT DAYSTELECOM is inside a big resistance area and also touched a triangle trend line: stock will probaly bounce back to green line. SELL !

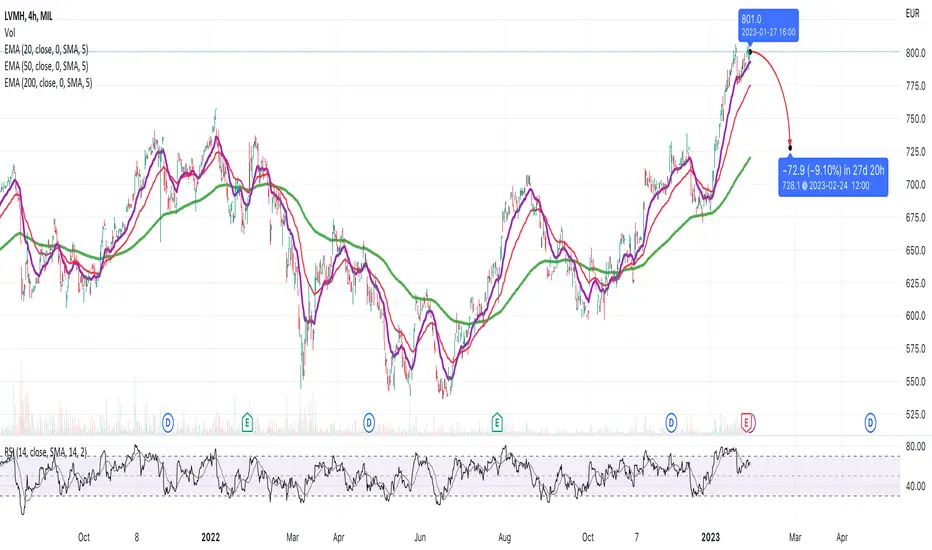
SHORT LVMHShort on lvmh price target below 750.
Has been where mms have been manipulating to hold prices. As seen recently with aritzia etcetc way overvalued.