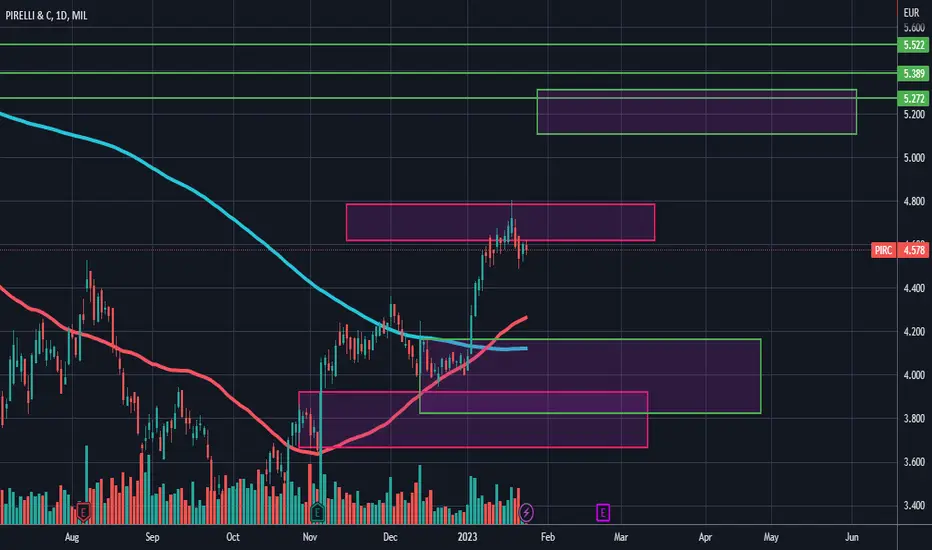
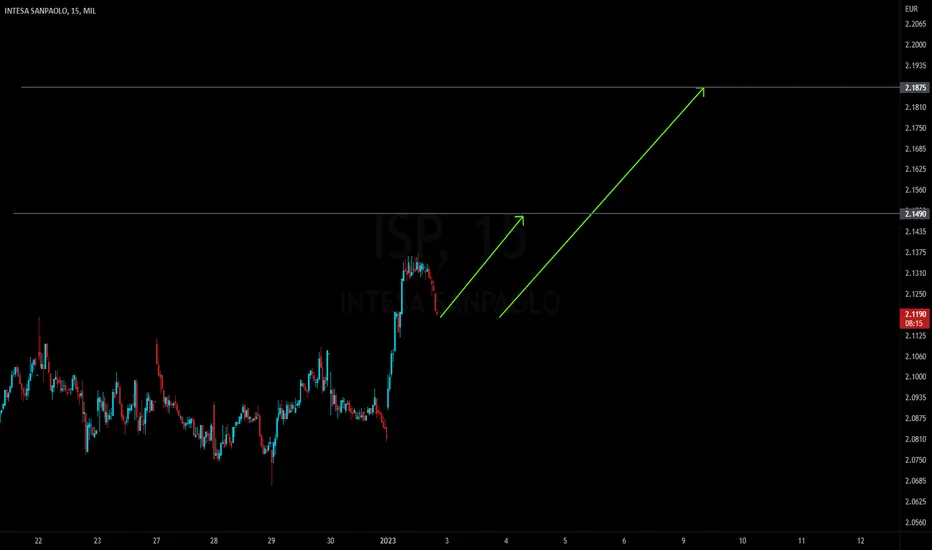
Positive Closing: Well-planned and executed trade generated profPirelli is an Italian stock and the company is a producer of different type of product especially tire for all ty of vehicle.
Recently start a bull trend that brings the stock price, to rise from its minimum of 3.278 to 4.721 bringing a rise of 44.49%. I got my signal and entered just in time to take some profit. Now the price reaches an area between the levels 4.789 and 4.619.
Now it seems is entering a phase of accumulation, that can bring a new bull impulse, now the moving average of 50-period crosses above the moving average of 200 periods, and is a bull run signal, let's see In the coming weeks. My new next level is a 5.272.
In a period of a possible recession, we need to be careful and be aware of any possible change of direction, so having a portfolio diversified, and doing diligence our work, will help us to protect our portfolio. This trade you can see it on my profile in etoro.
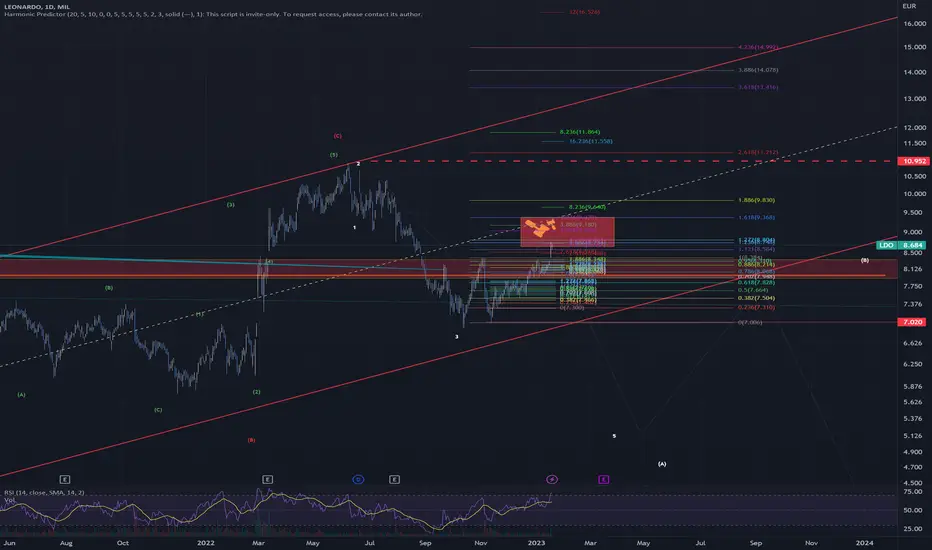
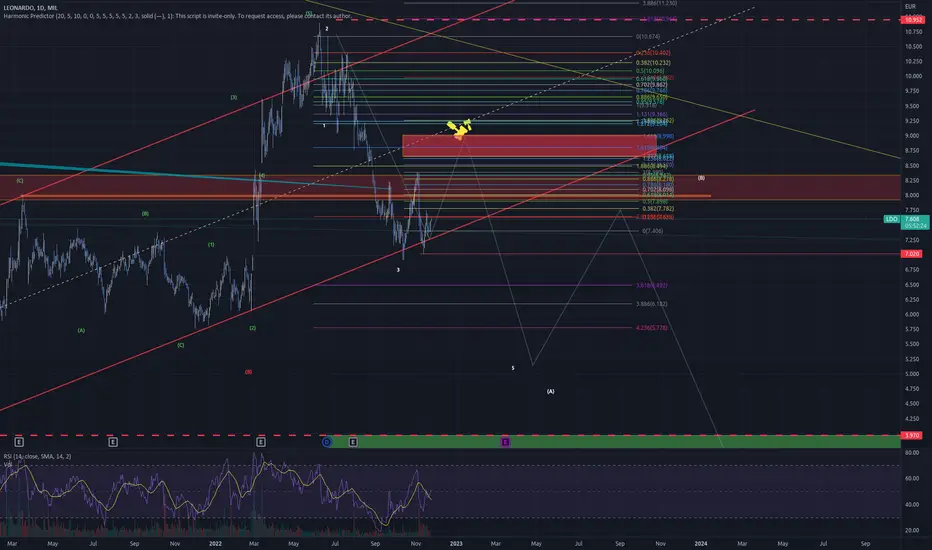
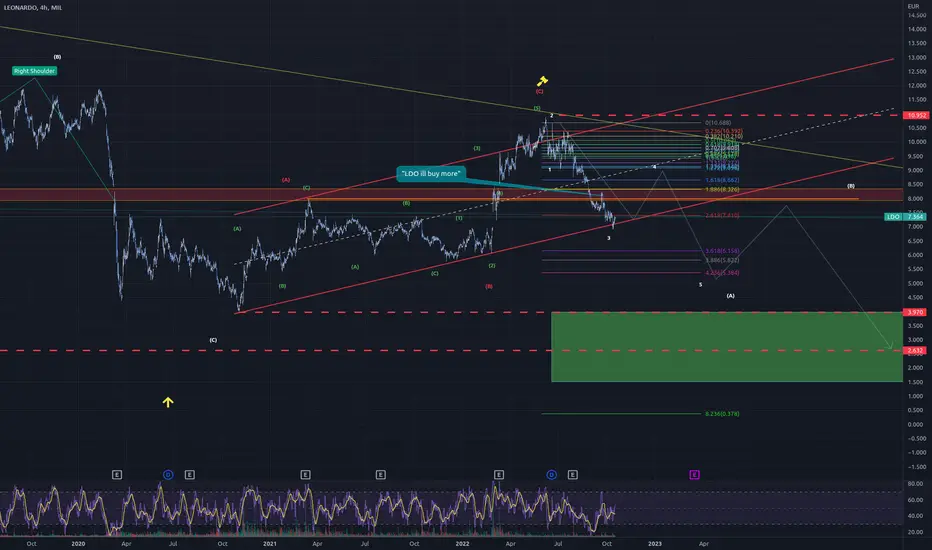
LDO Leonardo in the zonefor a possible target of the corrective pattern before the next leg down
Hold my beer pls
----
No financial advice, do your own research, don't be stupid
ENEL // cup handle formationAlthough there is a cup handle formation in the chart, the targets are determined according to Fibonacci.

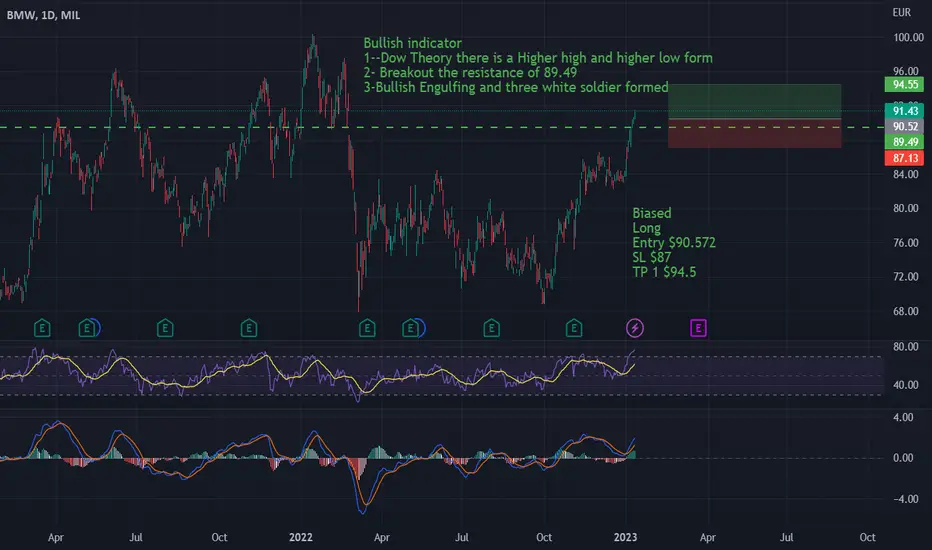
Going Long on BMWBullish indicator
1--Dow Theory there is a Higher high and higher low form
2- Breakout the resistance of 89.49
3-Bullish Engulfing and three white soldier formed
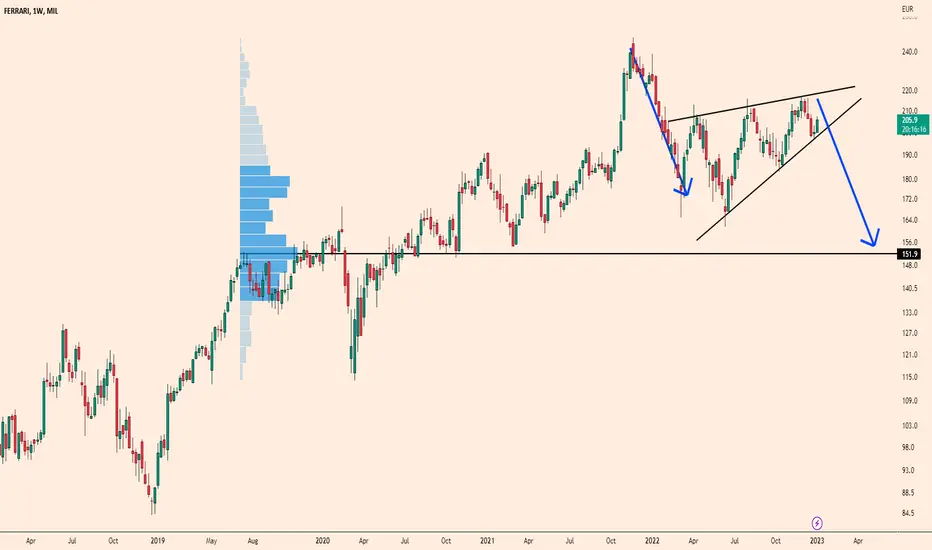
Ferrari Rising Wedge in Long TermWhen we look at the Ferrari graph on an annual basis, we see a rising wedge. Generally, assuming the wedge has broken downwards, the next target will be the $150 level. If we need to support this technical analysis with fundamental analysis, it is striking that especially the PEG ratio is too high. As long as the wedge doesn't break higher ($218), I will keep the $150 level as a target. When it reaches the $150 level, I will analyze the target again on my page for a buying opportunity.
Tesla12. 29. 22 It looks like Tesla moved higher today, and I believe this triggers the reversal for a long trade. This trade would require fairly make stops and I talked about that. The price is trading around the support resistance line with a fairly big range, and I talked about that. I think price action is very interesting in that there was a margin call and the market went higher, and I talked about that.

Tesla12. 24. 22 Tesla has taken a beating, however I believe it's time to look for buyers because the market is oversold, there is support in this area, and if we can find buyers, there is a good chance this market can go quite a few points higher with a V formation. Everything looks bearish...but this is where you want to go along when you find some buyers. Keep a small stop in case you're wrong.

LVMH in a flag.LVMH - 30d expiry - We look to Buy a break of 713 (stop at 695)
The primary trend remains bullish.
Posted a bullish Flag formation.
A break of 714 is needed to confirm the outlook.
712 has been pivotal.
The measured move target is 760.
Our outlook is bullish.
Our profit targets will be 758 and 768
Resistance: 705 / 713 / 730
Support: 689 / 680 / 670
Disclaimer – Saxo Bank Group.
Please be reminded – you alone are responsible for your trading – both gains and losses. There is a very high degree of risk involved in trading. The technical analysis , like any and all indicators, strategies, columns, articles and other features accessible on/though this site (including those from Signal Centre) are for informational purposes only and should not be construed as investment advice by you. Such technical analysis are believed to be obtained from sources believed to be reliable, but not warrant their respective completeness or accuracy, or warrant any results from the use of the information. Your use of the technical analysis , as would also your use of any and all mentioned indicators, strategies, columns, articles and all other features, is entirely at your own risk and it is your sole responsibility to evaluate the accuracy, completeness and usefulness (including suitability) of the information. You should assess the risk of any trade with your financial adviser and make your own independent decision(s) regarding any tradable products which may be the subject matter of the technical analysis or any of the said indicators, strategies, columns, articles and all other features.
Please also be reminded that if despite the above, any of the said technical analysis (or any of the said indicators, strategies, columns, articles and other features accessible on/through this site) is found to be advisory or a recommendation; and not merely informational in nature, the same is in any event provided with the intention of being for general circulation and availability only. As such it is not intended to and does not form part of any offer or recommendation directed at you specifically, or have any regard to the investment objectives, financial situation or needs of yourself or any other specific person. Before committing to a trade or investment therefore, please seek advice from a financial or other professional adviser regarding the suitability of the product for you and (where available) read the relevant product offer/description documents, including the risk disclosures. If you do not wish to seek such financial advice, please still exercise your mind and consider carefully whether the product is suitable for you because you alone remain responsible for your trading – both gains and losses.

LDO Leonardo Still doing its thingTarget remains unchanged. Might drop from right here to 4.236 levels and beyond - or for another leg up to local 1.272/1.618
Hold my beer pls
----
No financial advice, do your own research, don't be stupid
Reply shares could be heavily pummeled down -28%Stock chart and stock price trend already highlight how this stock was and still, it's a speculative bubble.
The stock price could be heavily dumped -28%

Moncler stock price will be destroyedMoncler stock price to get a heavy pummelling down of the share price.
share price destruction risk of -38%
Investment funds can dump the stock with full power

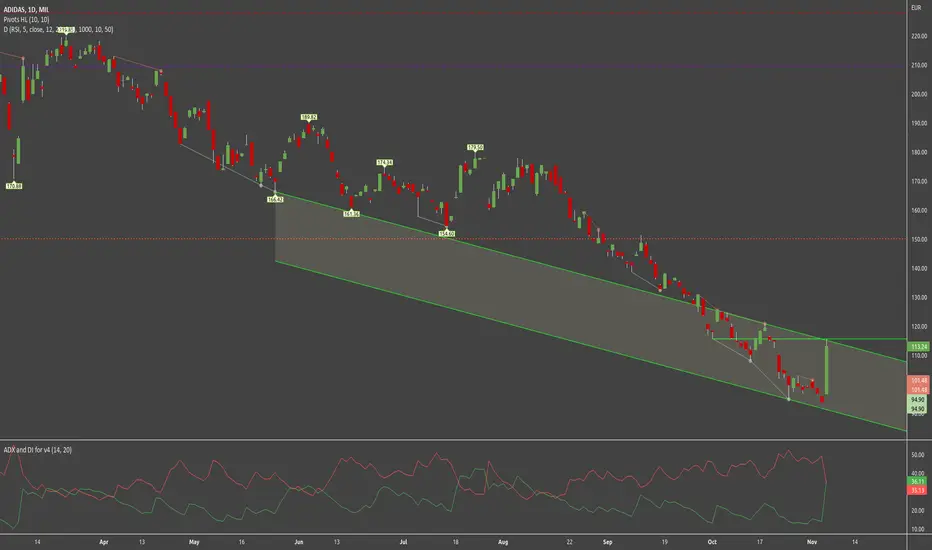
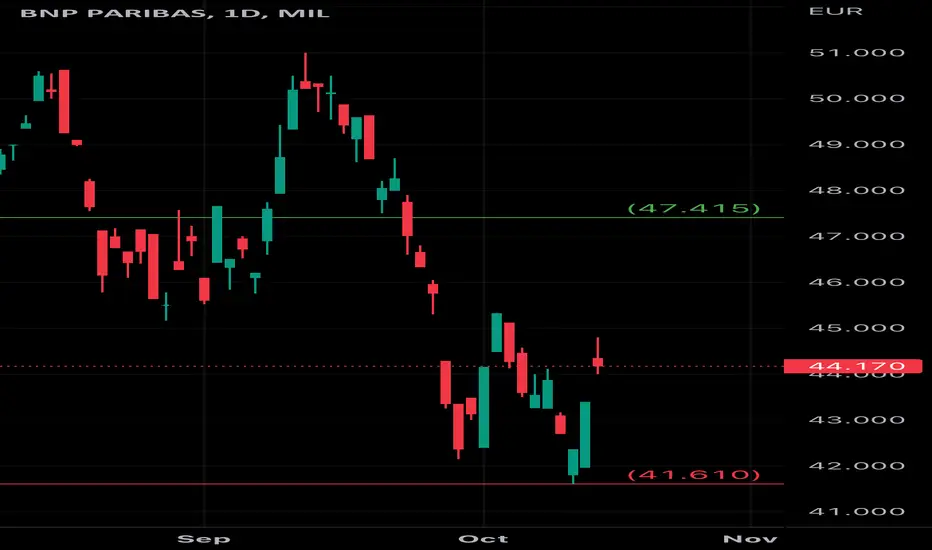
Cross ReistanceIn a clear downtrend we are facing a cross resistance. It makes me assuming that the recent rise has been a bearish correction. The overall market looks like being in a waiting mood however due to the weekend and the uncertainty about the next FED actions.
This is the risk. But I think that adidas as a producer of lifestyle products may suffer of consumers' reluctance more than the average consumer stocks.
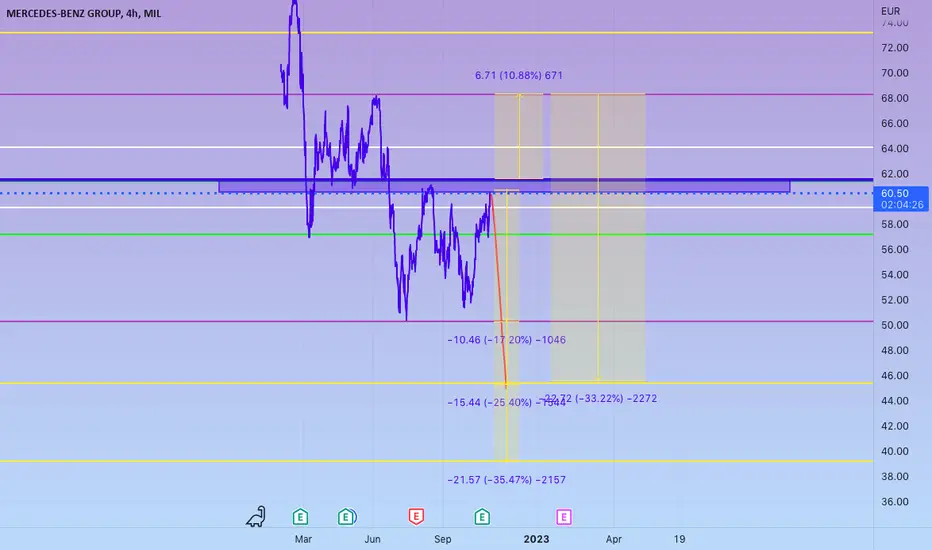
MERCEDES BEARSMBG SHORT IDEA
keeping it simple
In the bigger picture (global economics) i dont see a reason to flourish with that in mind it seems rather over bought sad to say
considering they went public this year
t/a
snd zone reached this is where i get logical with the fundamentals
then follow the strategy lead
if it does break we gone be looking at a good 10%
completeing the W formation
then potenially a nice 100% retracement drop
rolls royce analysis for the high rollers
SENNA SEASON

LDO Leonardo doing its thangWell, sometimes it helps to realize mistakes by adding some notes.
Just quoting one of my fellow followers here in the bubble who got tricked on that 10% bump.
But lets look at the chart, we see nothing has changed since the initial plan.
Probably will retrace to 1.272-1.618 level before crushing down to 4.236 since we triggered 2.618 on w3
Invalidation remains the same as before
Hold my beer pls
----
No financial advice, do your own research, don't be stupid
Tesla Peak Earnings (Mar. 22') + Peak Stock Price (~$1,200) = Lower Stock Price
Price Target: $70/share
$TSLA
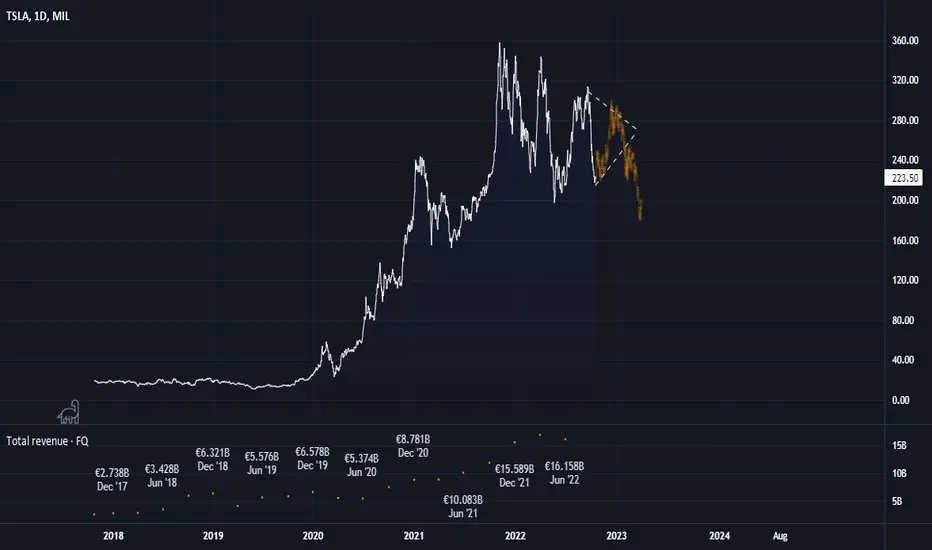
Tesla10. 5. 22 I know how difficult it is to sell your favorite stock because it's done so well for you over a year or two. You even bought corrected lower and this increase your holdings, and now there are signs that the market is going considerably lower. I think Tesla is one of those companies that is going considerably lower.

TSLA11.3.22 I looked at a number of stocks here to show you certain behaviors to look for, and in particular the last higher...low If it is close to the high. When the market moves below the last high or low, this is where the Buyers exit the market and wait for the market to move to a lower support. This is A good tool when the last tire low is near the high. I went through some of the comparisons. TSLA Has a lower high and low pattern... and maybe set up for a 135 reversal pattern. but you can't use the last high or low on the primary swing when looking at Tesla. Oil Palladium Meta PG Are other markets that were brought up here.

