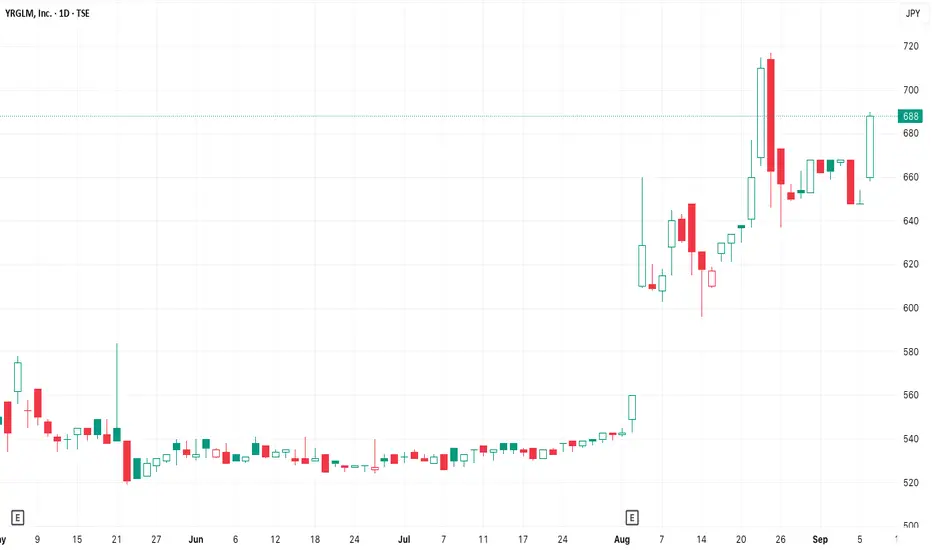
Strong Momentum With balanced ReturnsIt shows a more Robust BTST setup which cleaner breakout, confirmations across technical indicators YRGLM Inc is a promising candidate, BTST / INTRADAY
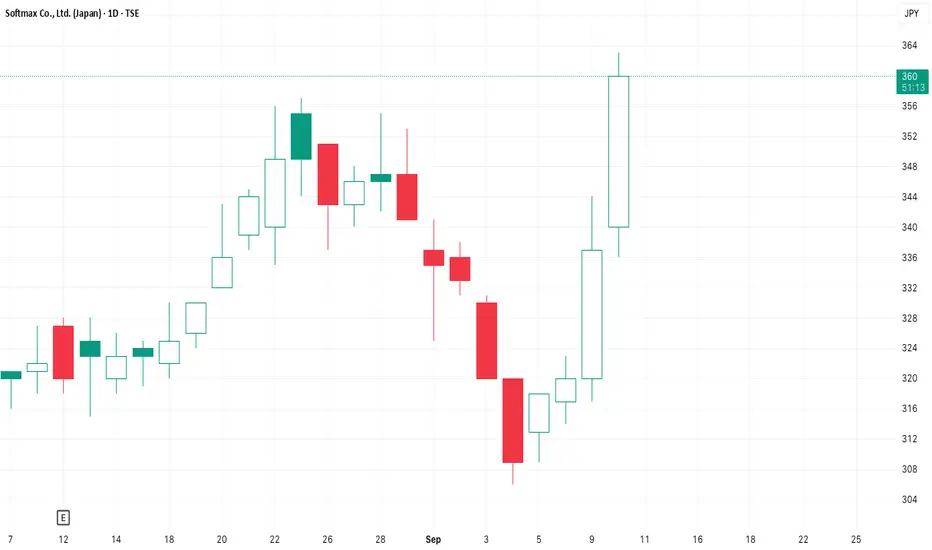
Strong Momentum With balanced ReturnsIt shows a more Robust BTST setup which cleaner breakout, confirmations across technical indicators, Softmax Co.,Ltd is a promising candidate, BTST / INTRADAY
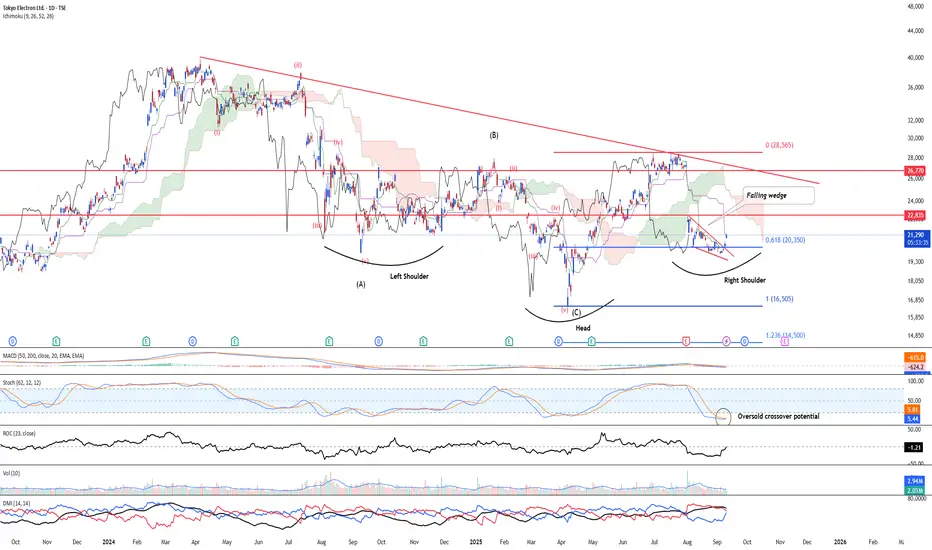
Taking the first bite for potential reversal rallyTSE:8035 is looking at a potential reversal to the upside after elliott wave structure suggest that there is an end to the corrective wave structure. As such, we are looking at a potential reversal. Furthermore, the potential inverted head and shoulder is looking at a potential reversal. While the smaller falling wedge has already being broken, indicating first light of the reversal base on price action. Stochastic Oscillator is likely forming an oversold crossover.
TP 1 is at 26,700 and TP 2 is at 44,000
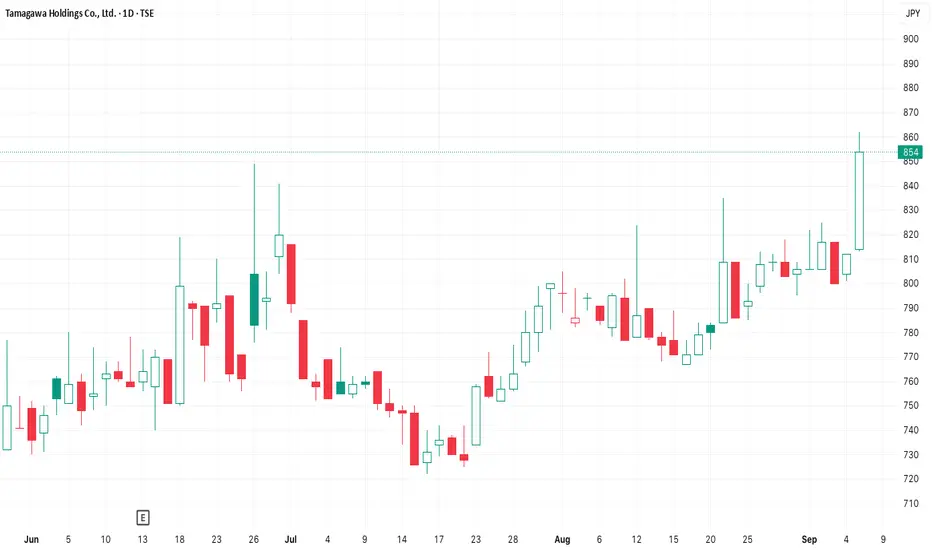
Strong Momentum With balanced ReturnsIt shows a more Robust BTST setup which cleaner breakout, confirmations across technical indicators Tamagawa Holdings Co Ltd , is a promising candidate for BTST / INTRADAY
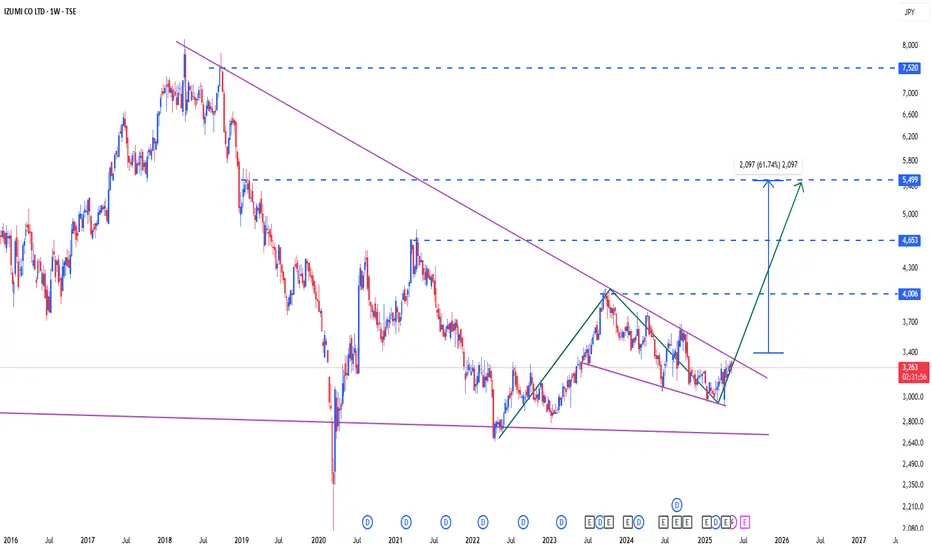
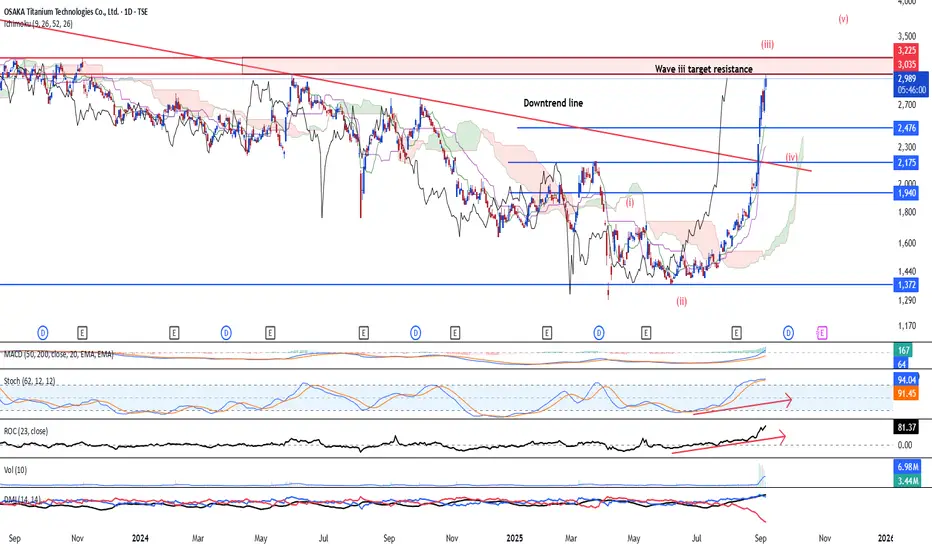
Clear long-term uptrend aheadTSE:5726 is looking at a strong bullish trend resuming after bullish break above the corrective downtrend line in 10 Nov 2022. We believe that the stock is in an sub impulse wave 3 and near-term may see limited upside nearing 3,035-3,225. Hence, we are watching 2,476 and 2,175 as the potential wave iv rebound level. Long-term target is at 4,540 level while we believe that over the longer-term period, this stock is able to ride up further as Monthly chart has shown a new set of supercycle wave III in the making.
Daily chart momentum score is positive as long-term MACD, stochastic and 23-period ROC is sloping upwards. Directional movement index is indicating strong bullish strength signal.
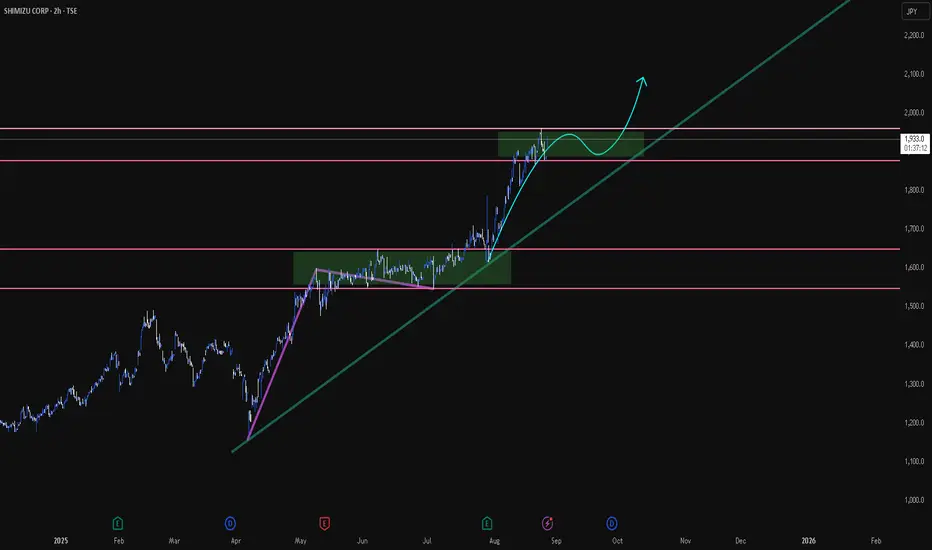
SHIMIZU | Trading ideaCurrently we are seeing very good performance of this stock!
The price may enter in green marked "growing channel".
It may have some correction there and after we may see the price higher.
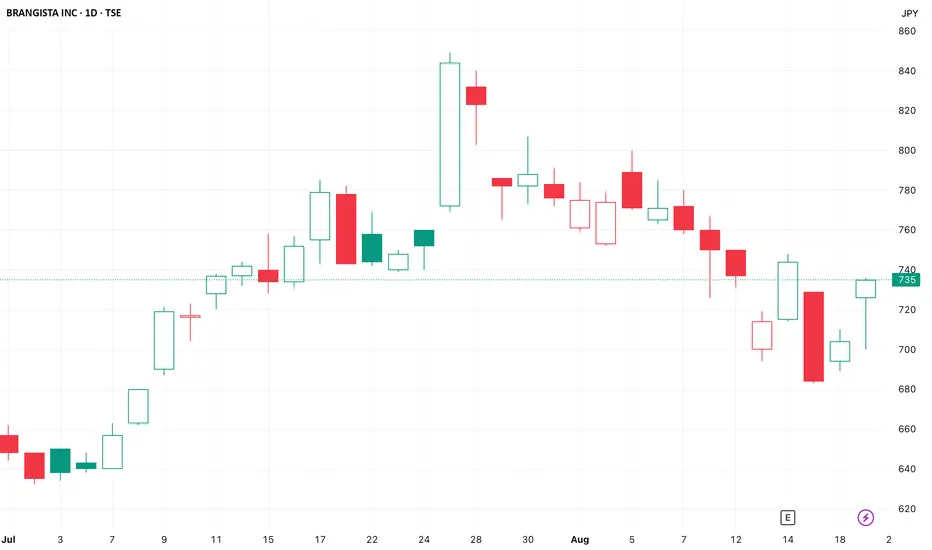
Strong Momentum With balanced ReturnsIt shows a more Robust BTST setup which cleaner breakout, confirmations across technical indicators Brangista INC, is a promising candidate, BTST / INTRADAY
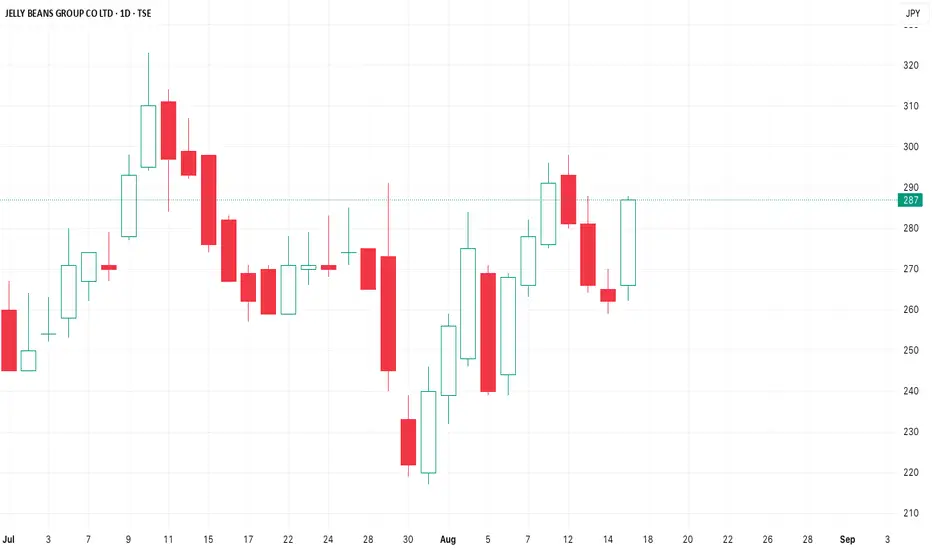
Strong Momentum With balanced ReturnsIt shows a more Robust BTST setup which cleaner breakout, confirmations across technical indicators JELLY BEANS GROUP co is a promising candidate, BTST / INTRADAY
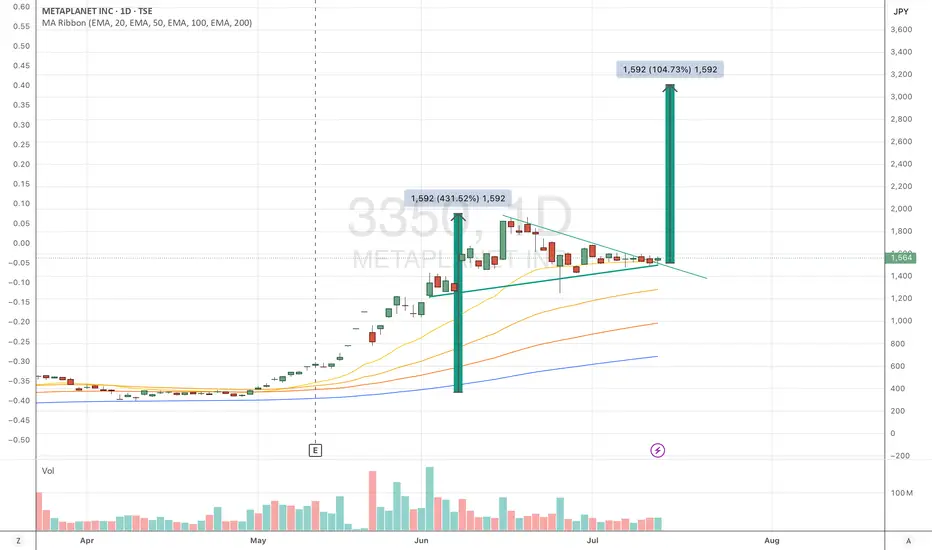
MTPLF, DN3, 3350 : End of week breakoutnice little pennant with a 3200 target this summer. without taking coming bitcoin surge into account.
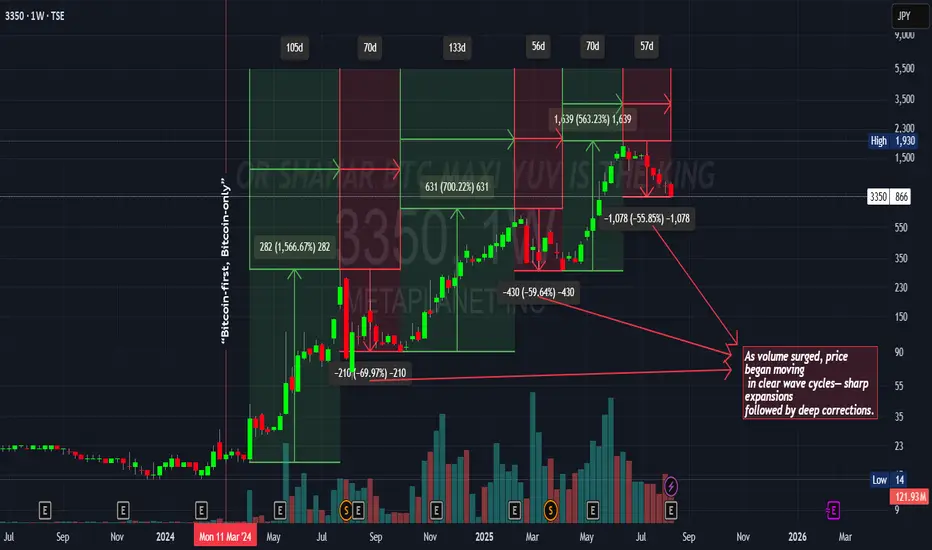
Wave Cycles in Price Action: Expansion and Correction DynamicsThis chart highlights how price action developed in distinct wave cycles once volume surged.
Each expansion phase was sharp, delivering multi-hundred percent gains in relatively short periods.
These expansions were consistently followed by deep corrective pullbacks of 50–70%.
The repeating rhythm shows a market structure of accumulation → expansion → correction → continuation.
Overall, the cycles emphasize the importance of recognizing both momentum opportunities and the inevitable retracements that followed.
Strong Momentum With balanced ReturnsIt shows a more Robust BTST setup which cleaner breakout, confirmations across technical indicators Zee Learn Ltd is a promising candidate
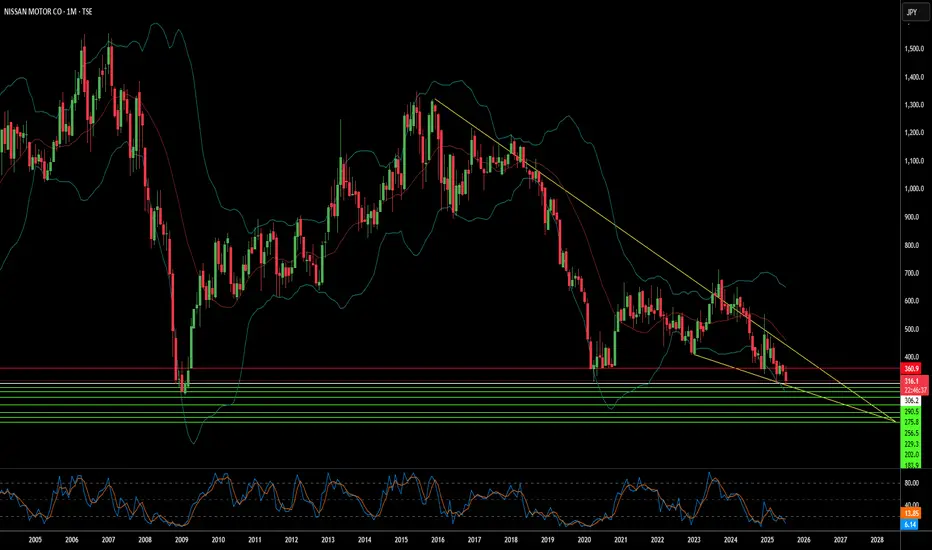
Is Nissan's Future Fading or Forging Ahead?Nissan Motor Company, once a titan of the global automotive industry, navigates a complex landscape. Recent events highlight the immediate vulnerabilities. A powerful 8.8-magnitude earthquake off Russia's Kamchatka Peninsula on July 30, 2025, triggered Pacific-wide tsunami alerts. This seismic event prompted Nissan to **suspend operations at certain domestic factories in Japan**, prioritizing employee safety. While a necessary precaution, such disruptions underscore the fragility of global supply chains and manufacturing, potentially impacting production targets and delivery schedules. This immediate response follows a period of significant operational adjustments as Nissan grapples with broader economic, geopolitical, and technological headwinds.
Beyond natural disasters, Nissan faces substantial financial and market share challenges. Although Fiscal Year 2023 saw operating profit and net income increases, global sales volume remained largely stagnant at 3.44 million units, signaling intensified market competition. Projections for Fiscal Year 2024 indicate a **forecasted revenue decline**, and recent U.S. sales figures show an 8% year-on-year drop in Q1 2025. Macroeconomic pressures, including inflation, volatile currency fluctuations, and a significant hit from **billions of dollars in lease losses** due to plummeting used car values, have directly impacted profitability. Geopolitical tensions, particularly the threat of a 24% U.S. tariff on Japanese auto exports, further threaten Nissan's crucial North American market.
Nissan's struggles extend into the technological arena and its innovation strategy. Despite holding a **remarkable patent portfolio** with over 10,000 active families, the company faces criticism for **lagging in electric vehicle (EV) adoption** and perceived technological stagnation. The slow rollout and underwhelming market impact of new EV models, coupled with a notable absence in the booming hybrid market, have allowed competitors to gain significant ground. Moreover, the brand has contended with **multiple cybersecurity breaches**, compromising customer and employee data, which damages trust and incurs remediation costs. Internal factors, including the lingering effects of the **Carlos Ghosn scandal**, management instability, and costly product recalls—like the recent July 2025 recall of over 480,000 vehicles due to engine defects—have further eroded investor confidence and brand reputation. Nissan's journey ahead remains uncertain as it strives to regain its competitive edge amidst these multifaceted pressures.
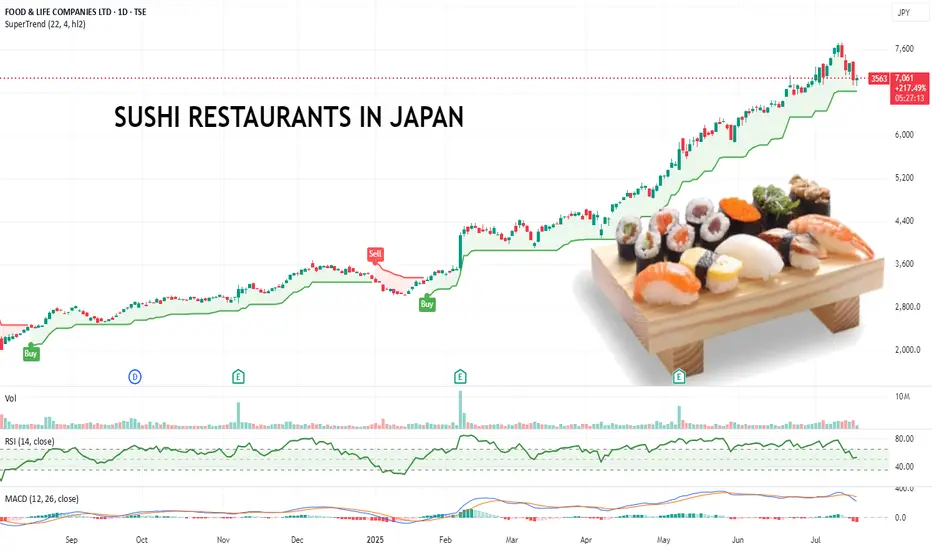
Pullback Over? This Japanese Sushi Chain Might Be Running Again.Food & Life Companies runs a major chain of sushi restaurants and is listed on the Tokyo Stock Exchange under the code 3563.TSE
From July 2025, I’ve started focusing more on scanning for high-momentum stocks globally, regardless of exchange. This one caught my eye with a clean, steady uptrend and a strong 200% move over the past year with minimal deep pullbacks.
It recently dipped, found support, and looks like it’s picking up again. That kind of price action gives a clear structure for managing risk if it rolls over. Makes it easy to identify where to put a stop loss to manage risk.
Also worth noting they’re aggressively expanding into Southeast Asia and beyond, which could help sustain the growth story.
Also. I like sushi. Wonder if there is a kebab stock...
Anyway, might be worth a watch.
Otsuka Holdings - Uptrend continuation TSE:4578 is looking at a strong bullish continuation to the upside after the stock has broken above the downward sloping line of the descending triangle. Besides that, the cup and handle formation has been completed. Besides that, we believe the larger corrective structure is coming to an end after a smaller rounding bottom was spotted at the base of teh major support at 6227 regions.
Indicators:
The long-term MACD is indicating a continuation to the upside as histogram is positive.
Stochastic Oscillator is seen rising above the overbought 20-line.
23-period ROC is positive and continues to rise. The directional movement index indicates strong bullish strength.
Volume remains in a healthy expansion.
Strategy:
Buy spot at 7,207 or at pullback at 6,605. Target is at 8,078 and 11,000 (Long-term)

Astellas Pharma - Strong break above weak resistance!TSE:4503 is looking at a strong bullish reversal confirmation after the stock has broken above the multi-tested resistance at 1,450. Besides that, the cup and handle formation has been completed. Besides that, we believe the larger 3-wave corrective structure within the descending channel is likely completed as recent break above the secondary downtrend line is completed.
Indicators:
The long-term MACD is indicating a strong reversal to the upside, as the MACD/Signal line rose in tandem with positive histogram.
Stochastic Oscillator is seen rising steadily.
23-period ROC is positive and continues to rise. The directional movement index indicates strong bullish strength.
Volume remains in a healthy expansion.
Strategy:
Buy spot at 1,497 or at pullback at 1,430. Target is at 1,723 and 2,200 (Long-term)

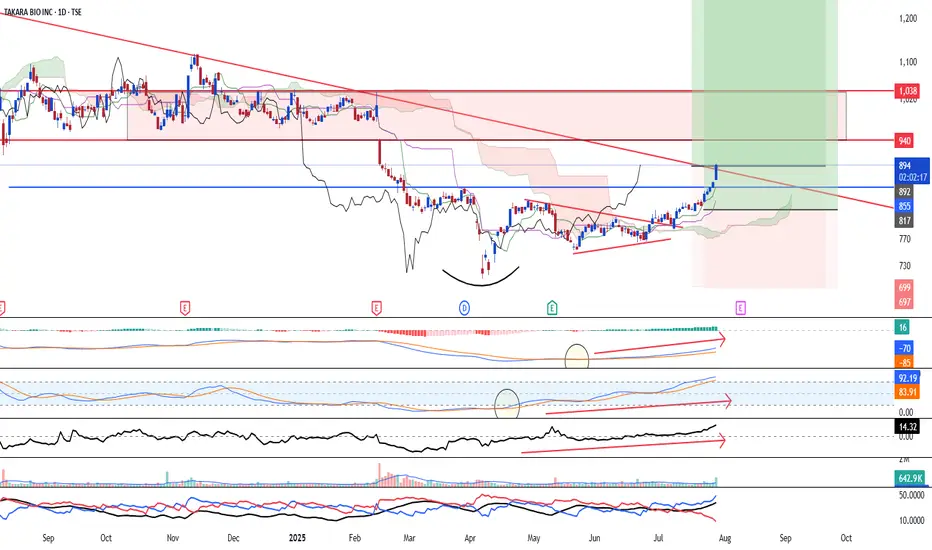
Takara bio - bottoming out TSE:4974 Takara Bio is looking at a strong bottoming-out reversal after the stock has completed the 1st reversal pattern of the cup and handle. Next, it has briefly closed above the major downtrend line, supported by rising volume. This is a clear indication of bullish pressure.
Indicators:
The long-term MACD is indicating a strong reversal to the upside, as the MACD/Signal line rose in tandem with positive histogram.
Stochastic Oscillator is seen rising steadily.
23-period ROC is positive and continues to rise. The directional movement index indicates strong bullish strength.
Volume remains in a healthy expansion.
Strategy:
EP: 895 or enter on pullback at 830.
Major support is at 760
Long-term target is at 1,600
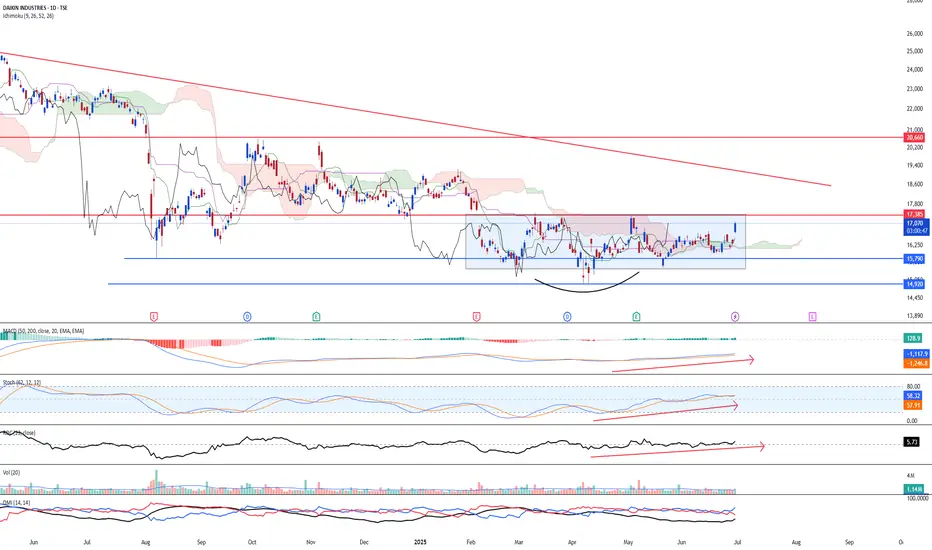
Daikin - Bottom rebound likelyTSE:6367 Daikin is looking at a possible bullish reversal after consolidating for the past 4 Months since Feb 2025. Furthermore, buying pressure is seen and is validated by healthy expansion of volume. Currently the stock has gapped up on Monday and is likely to see a strong reversion to the upside targeting 20,000 in the mid-term. Price action wise, the bear trap is valid after rebounding from the low of 14,920, which is less around 6% from its previous low at 15,790.
Long-term MACD is looking at a steady bullish momentum after histogram turns positive and stochastic oscillator has been rising steadily.
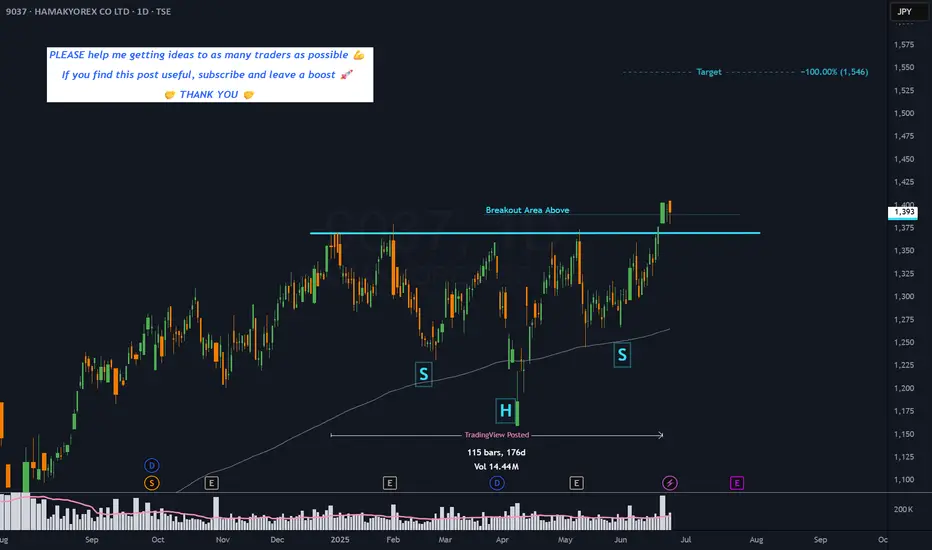
9037 - 6 months HEAD & SHOULDERS CONTINUATION══════════════════════════════
Since 2014, my markets approach is to spot
trading opportunities based solely on the
development of
CLASSICAL CHART PATTERNS
🤝Let’s learn and grow together 🤝
══════════════════════════════
Hello Traders ✌
After a careful consideration I came to the conclusion that:
- it is crucial to be quick in alerting you with all the opportunities I spot and often I don't post a good pattern because I don't have the opportunity to write down a proper didactical comment;
- since my parameters to identify a Classical Pattern and its scenario are very well defined, many of my comments were and would be redundant;
- the information that I think is important is very simple and can easily be understood just by looking at charts;
For these reasons and hoping to give you a better help, I decided to write comments only when something very specific or interesting shows up, otherwise all the information is shown on the chart.
Thank you all for your support
🔎🔎🔎 ALWAYS REMEMBER
"A pattern IS NOT a Pattern until the breakout is completed. Before that moment it is just a bunch of colorful candlesticks on a chart of your watchlist"
═════════════════════════════
⚠ DISCLAIMER ⚠
Breakout Area, Target, Levels, each line drawn on this chart and any other content represent just The Art Of Charting’s personal opinion and it is posted purely for educational purposes. Therefore it must not be taken as a direct or indirect investing recommendations or advices. Entry Point, Initial Stop Loss and Targets depend on your personal and unique Trading Plan Tactics and Money Management rules, Any action taken upon these information is at your own risk.
═════════════════════════════
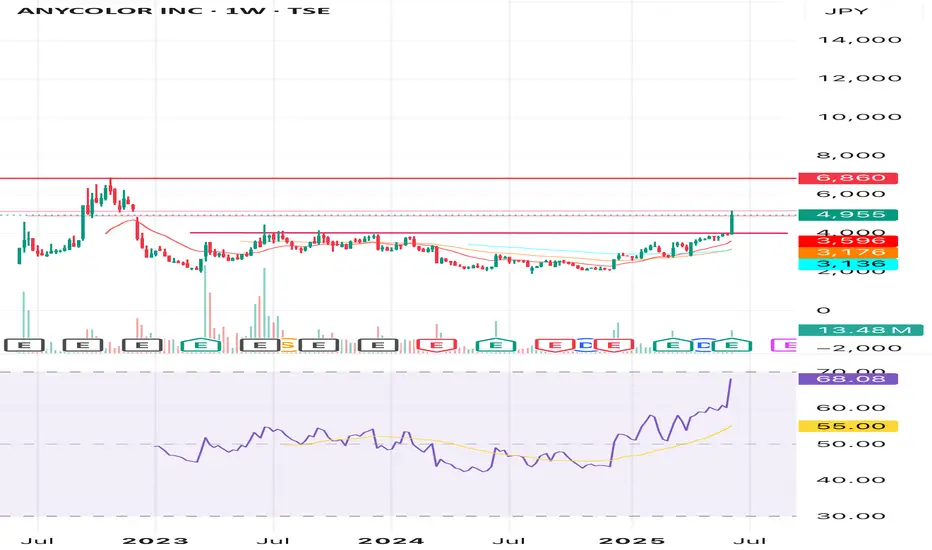
Anycolor Inc Trade IdeaShowing strong momentum after a breakout to new all-time highs, driven by robust growth in its VTuber business and digital content ecosystem. The company just reported a 34% YoY revenue increase to ¥42.9 billion and a 31.7% rise in operating profit for FY2025, fueled by expansion in both its domestic and global VTuber operations, particularly through the “Nijisanji” brand
Catalyst: Ongoing innovation, global expansion, and increasing monetization per VTuber are set to drive further earnings surprises and upside momentum.
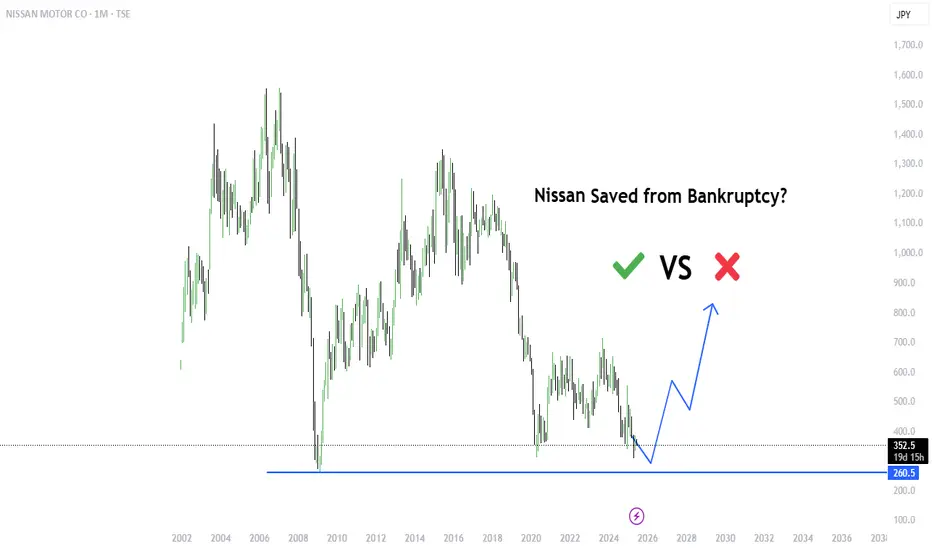
Will Nissan be saved from Bankruptcy?Financial Health & Bankruptcy Risks
Credit ratings in junk territory
Moody’s recently downgraded Nissan’s credit rating to Ba2 (negative outlook), highlighting weak free cash flow and margins. S&P and Fitch have also downgraded Nissan to below investment‑grade with negative outlooks.
Massive restructuring and heavy losses
Nissan recorded a loss between ¥700–750 billion (~$4.9–5.3 billion) for the fiscal year ending March 2025. It is slashing workforce by 20,000 jobs (15% of staff) and closing plants—cost cuts totaling ¥500 billion (~€4 billion) .
Bankruptcy probability contradictory
Macroaxis data shows an 80%+ distress probability, indicating severe risk. In contrast, another analysis cites a much lower 4.7% bankruptcy chance but flags poor solvency and weak interest coverage.
Turnaround Plans & Potential Lifelines
Re:Nissan turnaround strategy
Under new CEO Ivan Espinosa, Nissan is executing an aggressive plan: job cuts, plant closures, and restructuring. He’s also refocusing on EVs, hybrids, and partnerships.
Merger or investment hopes
Talks with Honda aimed at a mega-merger failed, though discussions remain open. Possibility of seeking anchor investors or strategic partnerships (some even speculating interest from the likes of Tesla or Foxconn), though none are confirmed .
Investor Outlook: Why Nissan Is Risky
High financial leverage: Junk ratings signal difficulty in accessing capital and higher borrowing costs.
Execution risk: Massive cuts and restructuring can be disruptive and slow to turn into profitability.
Industry headwinds: The shift to EVs and hybrids is accelerating—Nissan’s lineup has lagged behind competitors.
Geopolitical threat: Tariffs (especially on Mexico-made vehicles) could further squeeze margins
-Disclaimer: This analysis is for informational and educational purposes only and does not constitute financial advice, investment recommendation, or an offer to buy or sell any securities. Stock prices, valuations, and performance metrics are subject to change and may be outdated. Always conduct your own due diligence and consult with a licensed financial advisor before making investment decisions. The information presented may contain inaccuracies and should not be solely relied upon for financial decisions. I am not personally liable for your own losses, this is not financial advise.
Larger correction wave is likely completedTSE:6526 is looking at a strong possible bullish reversal as the stock has seen a possible end of its corrective structure. Furthermore, there is a v-shaped bottom reversal forming and given the strong momentum, the stock is likely to break above the neckline resistance of 2,371. We expect 1st target to reach 3,612.
Long-term MACD is positive and shows strong momentum. Stochastic Oscillator has rose beyond the mid-point level and 23-period ROC is strong. Directional movement index reiterates the strong bullish strength.

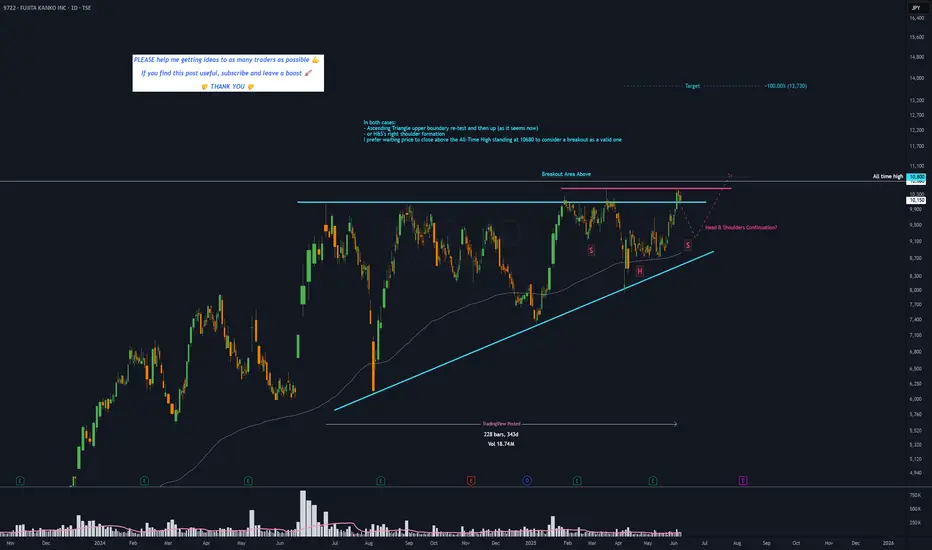
9722 - 11 months ASCENDING TRIANGLE══════════════════════════════
Since 2014, my markets approach is to spot
trading opportunities based solely on the
development of
CLASSICAL CHART PATTERNS
🤝Let’s learn and grow together 🤝
══════════════════════════════
Hello Traders ✌
After a careful consideration I came to the conclusion that:
- it is crucial to be quick in alerting you with all the opportunities I spot and often I don't post a good pattern because I don't have the opportunity to write down a proper didactical comment;
- since my parameters to identify a Classical Pattern and its scenario are very well defined, many of my comments were and would be redundant;
- the information that I think is important is very simple and can easily be understood just by looking at charts;
For these reasons and hoping to give you a better help, I decided to write comments only when something very specific or interesting shows up, otherwise all the information is shown on the chart.
Thank you all for your support
🔎🔎🔎 ALWAYS REMEMBER
"A pattern IS NOT a Pattern until the breakout is completed. Before that moment it is just a bunch of colorful candlesticks on a chart of your watchlist"
═════════════════════════════
⚠ DISCLAIMER ⚠
Breakout Area, Target, Levels, each line drawn on this chart and any other content represent just The Art Of Charting’s personal opinion and it is posted purely for educational purposes. Therefore it must not be taken as a direct or indirect investing recommendations or advices. Entry Point, Initial Stop Loss and Targets depend on your personal and unique Trading Plan Tactics and Money Management rules, Any action taken upon these information is at your own risk.
═════════════════════════════
IZUMI wait for breaktout 2XBuy gradually from here or wait for breaking through this resistance line with a short-term target of at least 10%+.