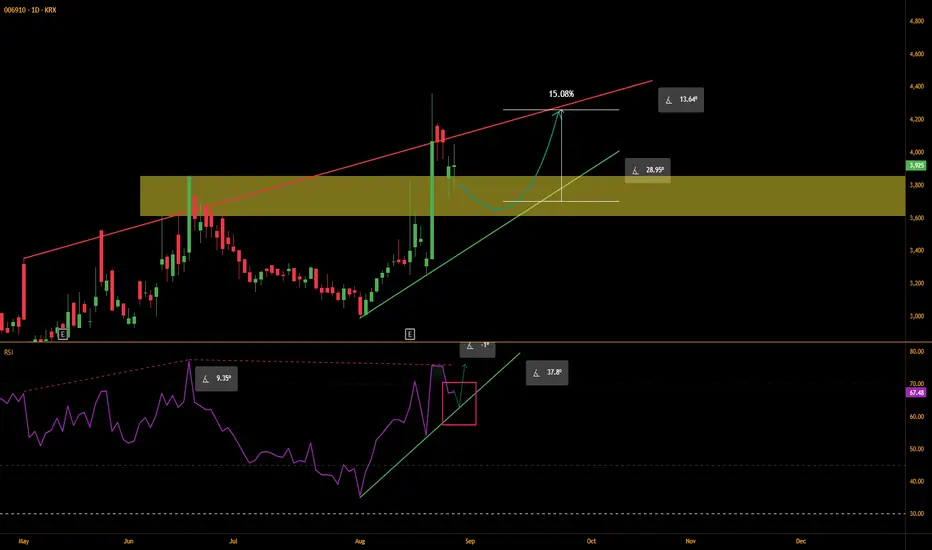
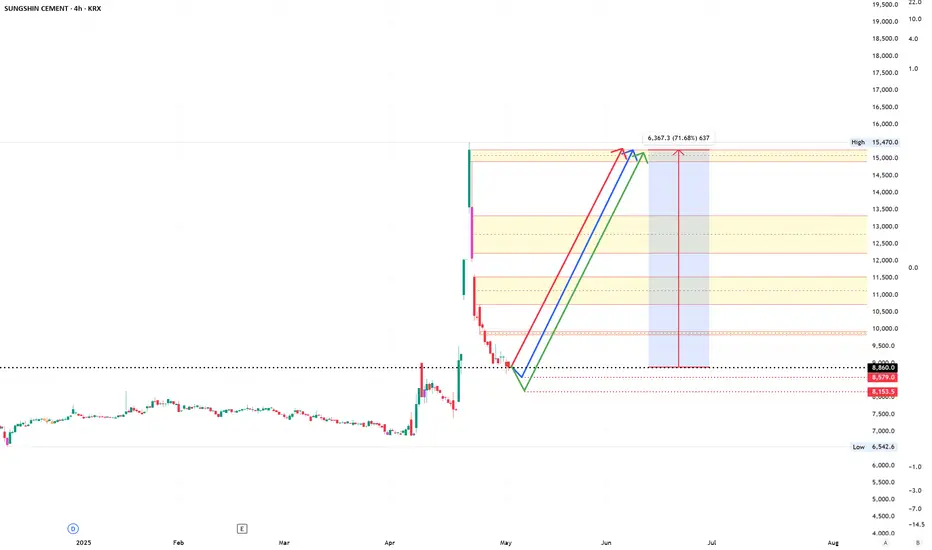
Bosung Power Tech - retest before climbingThis is my idea on Bosung Power Tech,
but I want to first address that it takes extra caution to enter an overbought stock like this one.
With that in mind, let's continue.
The strategy behind this idea is that price can use RSI's support line to regain the bullish momentum. This is often why we see price climbing before or without touching its support line or zone. However, relying just on RSI could be risky which is why we wait for other evidences before entering.
The price is just above its price action zone, which has historically acted as a resistance zone.
If the price dips back into this zone in next few days and shows a sign of reversal (such as tall bullish candle with its close breaking through the zone), WITH RSI rebounding on its support line, this would make a strong bullish signal.
Alternatively, the price move sideways inside the zone before reaching the support line of the price.
It is best to enter under 3930, ideally inside the price action zone.
The target would be red resistance line, around 4140 to 4200.
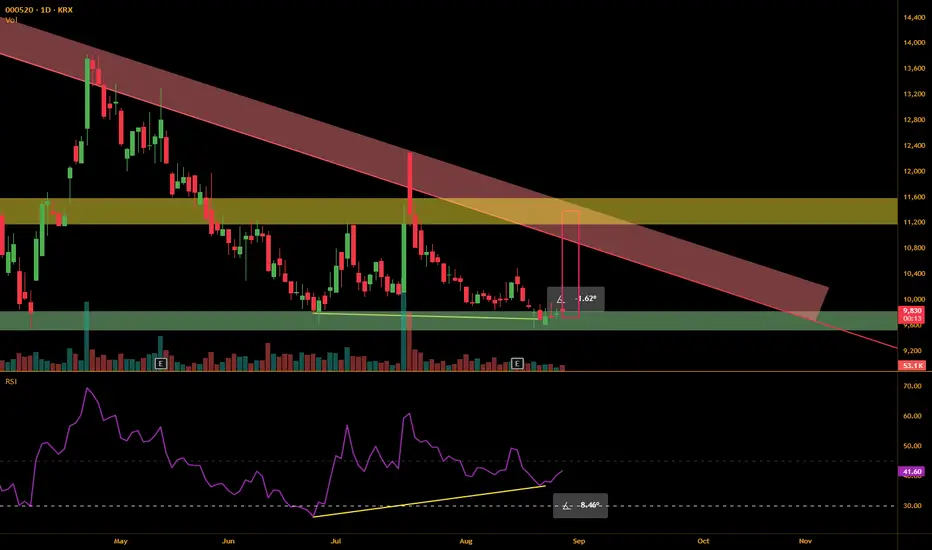
RSI Divergence & FB Wedge pattern on Samil Pharm.We see two overlapping bullish signals for $KRX:000520.
First signal is RSI Divergence, price making lower lows while RSI makes higher lows.
While the price difference isn't great, RSI difference is bigger, with the latest low pivot being 10 points higher than the previous one.
Second signal is price moving within the flat bottom wedge.
The price has historically rebounded whenever it entered the support zone of 9500 - 9800.
This is the third time price entering the zone, which isn't most ideal,
but the RSI Divergence reinforces the probability of a bullish trend.
If we see a bullish candle tomorrow with RSI surpassing 45 line, then might be a good time to enter long.
It is best to enter below 10,400, ideally around 10,200.
The first sell point would be slightly below the red resistance line, between 10,600 and 10,900.
The second and final sell point would be the yellow price action zone.
Estimated profit is 4%+ in 4-5 weeks.
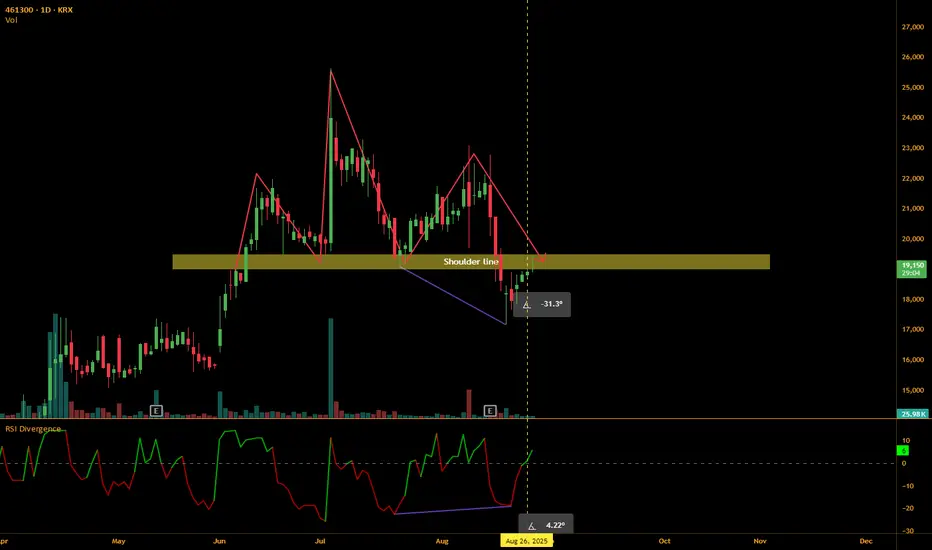
RSI Divergence on I-SCREAM MEDIAToday, we have a technical analysis on I-SCREAM MEDIA using RSI Divergence.
I used a "RSI Divergence" indicator created by @Shizaru,
which compares a difference between fast RSI and slow RSI.
The default period for fast RSI is 5 and slow, 14.
In the chart, we see price going downtrend, making lower lows while RSI difference makes higher low.
RSI difference closing to zero line indicates that the selling pressure is losing its momentum and might signal the beginning of the bullish movement.
We then see RSI difference breaking through the zero line, which is a good bullish signal.
However, because there's a price action zone from 19,000 to 19,500,
watching the price movements further before entering might be wise.
If the price manages to pass the test and break through the zone, then might be a good time to enter.
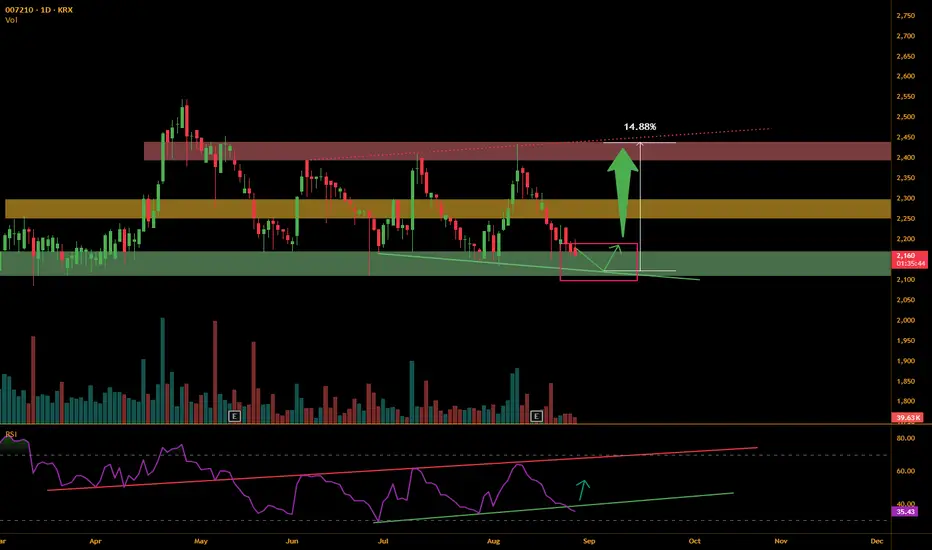
Tech Analysis on Byuksan: Potential reversal of trendThis is a simple RSI Divergence strategy applied to this Korean stock.
Looking at their Investor Relations, numbers are reasonable:
with their quarterly profit growing steadily since last December and latest quarterly report showing YoY change of 62.7%.
However, the profit estimation for the upcoming quarter is slightly below the latest one.
In the chart, we see a classic RSI Divergence, price making lower lows while RSI making higher lows, indicating that the downtrend is losing its momentum, increasing the chance of reversal to an uptrend.
Here, we see price reentering the strong support zone and we can expect the price to go down as low as 2125, touching the green support line.
If the price then closes with a tall bullish candle with RSI rising,
we can confirm the reversal of trend and may enter.
However, RSI breaking below its support line may be a concern.
Recommended entry price is 2115 - 2170.
The first resistance to expect is 2245 - 2300.
It is best to sell more than 50% of the total shares here.
The target price is 2395. If the price begins to fall before reaching the target price, it is best to sell the rest.
Estimated profit is 4%+ within 3 weeks.
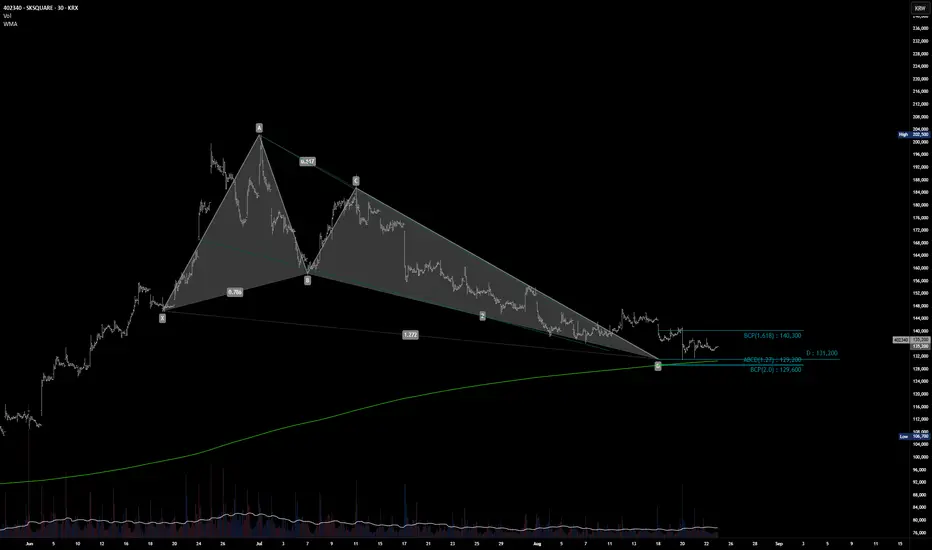
SK Square (krx:402340)Bullish Butterfly has reached the Potential Reversal Zone (PRZ), signaling a possible trend shift.
The 30-week moving average is providing solid support at the bottom, while the falling wedge pattern is completing its convergence, further strengthening the bullish reversal setup.
The 0.382 retracement level is set as the first target (TP1).
If the weekly close breaks above this zone, a trailing stop strategy could be applied to ride the move up toward the 0.618 level (TP2).
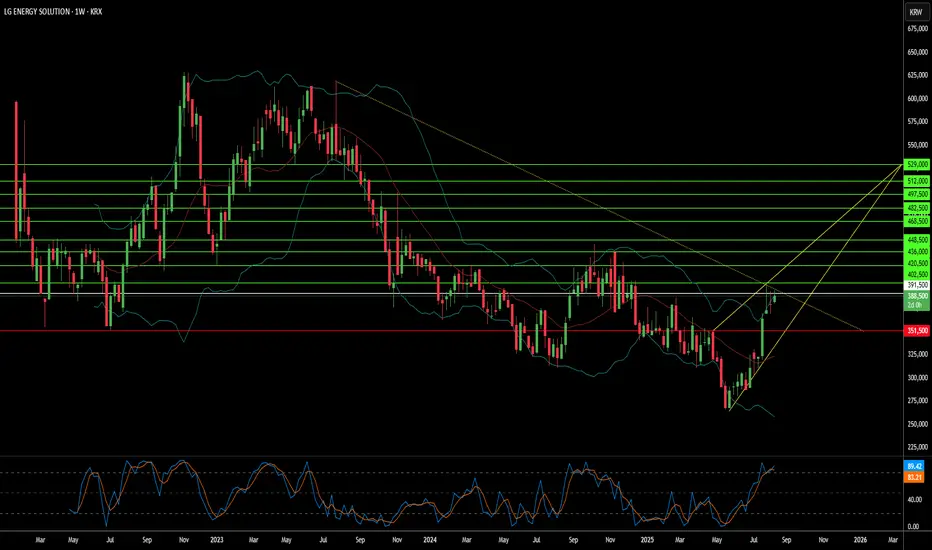
Can One Company Turn Global Tensions Into Battery Gold?LG Energy Solution has emerged as a dominant force in the battery sector in 2025, capitalizing on geopolitical shifts and market disruptions to secure its position as a global leader. The company's stock has surged 11.49% year-to-date to 388,000 KRW by August 12, driven by strategic partnerships and a pivotal $4.3 billion deal with Tesla for LFP battery supply from its Michigan facility. This partnership not only reduces Tesla's dependence on Chinese suppliers but also strengthens LG's foothold in the critical US market amid escalating trade tensions.
The company's strategic expansion in US manufacturing represents a calculated response to changing geopolitical dynamics and economic incentives. LG is aggressively scaling its Michigan factory capacity from 17GWh to 30GWh by 2026, while repurposing EV production lines for energy storage systems (ESS) to meet surging demand from renewable energy projects and AI data centers. Despite a global slowdown in EV demand, LG has successfully pivoted to capitalize on the booming ESS market, with Q2 2025 operating profits rising 31.4% to KRW 492.2 billion, largely attributed to US production incentives and strategic positioning.
LG's technological leadership and intellectual property portfolio serve as key differentiators in an increasingly competitive landscape. The company is pioneering advanced LMR battery technology, promising 30% higher energy density than LFP batteries by 2028, while maintaining over 200 LMR patents and aggressively enforcing its IP rights through successful court injunctions. Beyond technology, LG's commitment to sustainability through its RE100 initiative and integration of high-tech solutions for smart grids and AI-enabled energy systems positions the company at the forefront of the clean energy transition, making it a compelling investment opportunity in the rapidly evolving battery and energy storage sector.
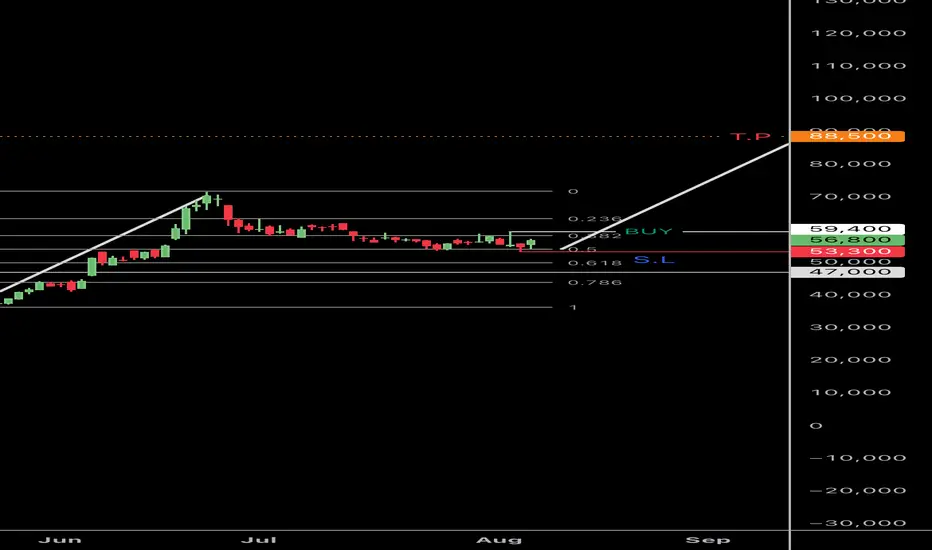
Kakao Bullish 📊 Trade Idea: – Fibonacci Retracement + Bullish Continuation Setup
Timeframe: Daily (1D)
Chart Type: Candlestick
Strategy Type: Swing Trade / Trend Continuation
⸻
🧩 Trade Thesis:
After a strong impulsive move upwards, the price has retraced back to the 50%-61.8% Fibonacci zone, which historically acts as a key support area during trending markets. A possible bullish continuation pattern is forming, with consolidation visible near the 0.5 level.
⸻
📍 Entry, Stop Loss & Take Profit:
• Buy Entry: 56,800 (Breakout or confirmation from current support zone)
• Stop Loss (S.L): 53,300 (Below the 0.618 Fib level and recent local low)
• Take Profit (T.P): 88,500 (Based on previous swing high extension / trendline projection)
⸻
📏 Trade Metrics:
• Risk per Share: 56,800 - 53,300 = 3,500
• Reward per Share: 88,500 - 56,800 = 31,700
• Risk-to-Reward Ratio: ~1:9
A high reward/risk setup with price holding near Fibonacci support, awaiting breakout confirmation.
⸻
🔍 Technical Confluence:
• Price has respected the 61.8% Fibonacci retracement level, a key area of potential reversal.
• Volume shows signs of stabilization after the correction phase.
• Uptrend structure remains valid unless the price closes below 53,300.
• Potential bullish flag or pennant pattern in progress, signaling continuation.
⸻
⚠️ Trade Management:
• Aggressive Entry: Near current levels (anticipating breakout)
• Conservative Entry: Wait for daily candle close above 59,400 (confirmation)
• Adjust SL to Breakeven if price breaks above 65,000
• Watch for Rejection Signs if price approaches 61.8% level again
⸻
🕓 Timeline Expectation:
• Short-to-Medium Term Outlook (2–6 weeks) depending on breakout and follow-through.
⸻
📌 Note: Always review fundamental context and broader market sentiment. This is a technical idea for educational purposes only.
Is Samsung's Chip Bet Paying Off?Samsung Electronics is navigating a complex global landscape, marked by intense technological competition and shifting geopolitical alliances. A recent $16.5 billion deal to supply advanced chips to Tesla, confirmed by Elon Musk, signals a potential turning point. This contract, set to run until late 2033, underscores Samsung's strategic commitment to its foundry business. The agreement will dedicate Samsung's new Texas fabrication plant to producing Tesla's next-generation AI6 chips, a move Musk himself highlighted for its significant strategic importance. This partnership aims to bolster Samsung's position in the high-stakes semiconductor sector, particularly in advanced manufacturing and AI.
The deal's economic and technological implications are substantial. Samsung's foundry division has faced profitability challenges, experiencing estimated losses exceeding $3.6 billion in the first half of the year. This large-scale contract is expected to help mitigate those losses, providing a much-needed revenue stream. From a technological standpoint, Samsung aims to accelerate its 2-nanometer (2nm) mass production efforts. While its 3nm process faced yield hurdles, the Tesla collaboration, with Musk's direct involvement in optimizing efficiency, could be crucial for improving 2nm yields and attracting future clients like Qualcomm. This pushes Samsung to remain at the forefront of semiconductor innovation.
Beyond the immediate financial and technological gains, the Tesla deal holds significant geopolitical and geostrategic weight. The dedicated Texas fab enhances U.S. domestic chip production capabilities, aligning with American goals for supply chain resilience. This deepens the U.S.-South Korea semiconductor alliance. For South Korea, the deal strengthens its critical tech exports and may provide leverage in ongoing trade negotiations, particularly concerning potential U.S. tariffs. While Samsung still trails TSMC in foundry market share and faces fierce competition in High-Bandwidth Memory (HBM) from SK Hynix, this strategic alliance with Tesla positions Samsung to solidify its recovery and expand its influence in the global high-tech arena.

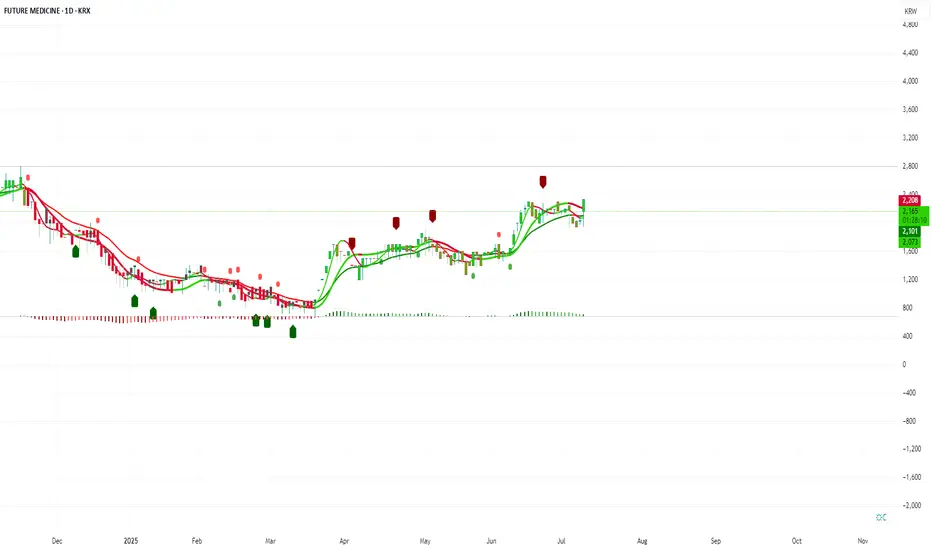
Walk This Way...This S. Korean company focuses on treatment of cystic fibrosis and chronic kidney disease, et al. Future Medicine, Limited.
Godspeed to this company as they search for cures for primary biliary cirrhosis; colorectal, prostate, and lung cancers and rheumatoid arthritis, et al. They target metabolic cancers, inflammatory and autoimmune diseases, to produce anticancer drugs, anti-fibrotics and antiviral remedies. Not only persistent, but painful diseases, as well. Who on earth wouldn't want this company to succeed ?
Selling Volume has completely Dried-up and the stock is in the process of setting Higher-Lows. MACD, StochasticsRSI, Rate-of-Change, and %r are all additive tenets of confirmation for the astute and intrepid investor.
Go Long.... it's at the 20... the 10... the 5... and Touchdown
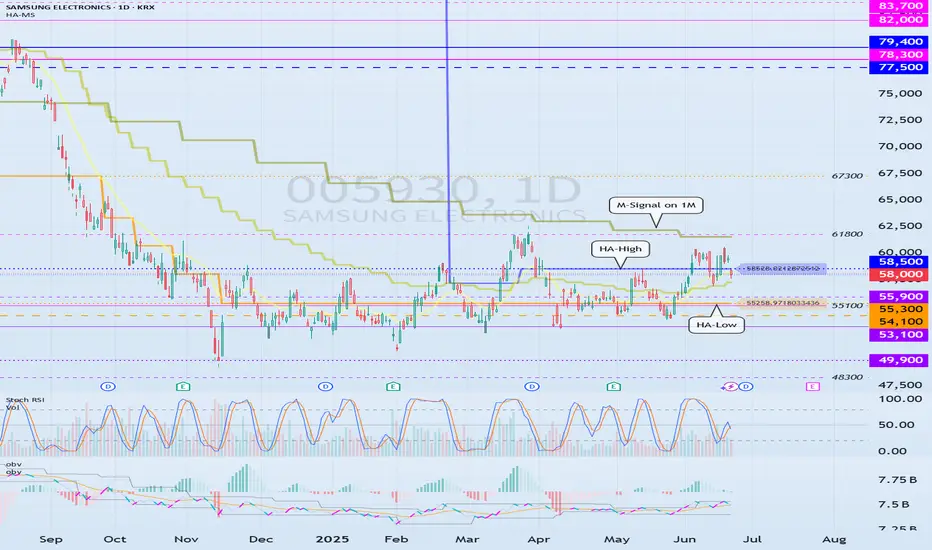
The key is whether it can rise above 61800
Hello, traders.
If you "Follow", you can always get new information quickly.
Have a nice day today.
-------------------------------------
(Samsung Electronics 1D chart)
HA-Low indicator and HA-High indicator have begun to converge.
Accordingly, a trend is expected to occur soon.
Since the price is currently located below the M-Signal indicator on the 1M chart, it is possible that the rise is limited.
In addition, the PVT-MACD oscillator is showing signs of falling below the 0 point, so it is showing signs of switching to a selling trend.
Since the Low Line ~ High Line channel is showing signs of switching to a rising channel, if it rises above the High Line this time and is maintained, it is possible that it will switch to a buying trend again.
That is, when it shows support around 54100-58500, it is the first purchase period.
When it rises above the M-Signal indicator on the 1M chart and maintains the price, it is the second purchase period.
Accordingly, when it shows support around 61800 from the current price position, it is the second purchase period.
The expected target range is 77500-79400, which is near the current HA-High point.
-
Thank you for reading to the end.
I hope you have a successful transaction.
--------------------------------------------------
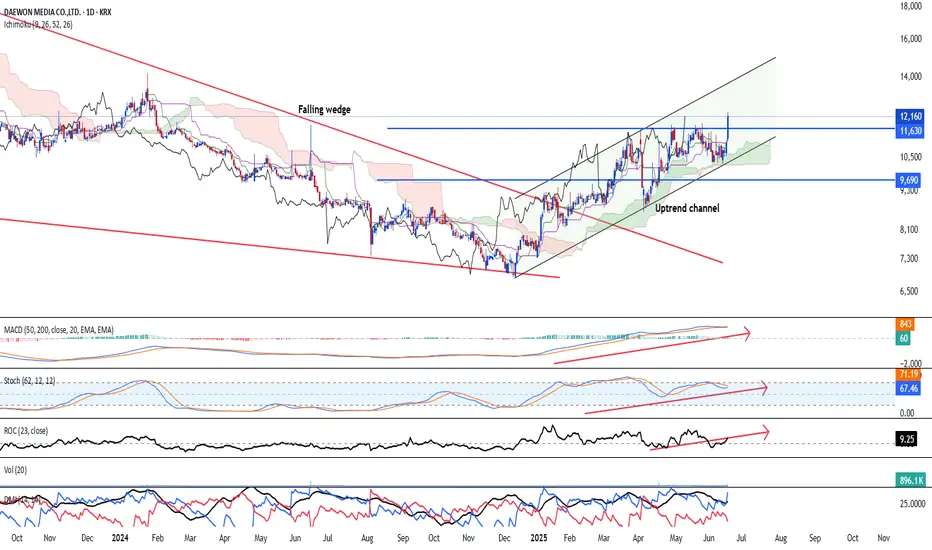
Breaking out if the falling wedge and uptrend is early!KRX:048910 is exhibiting a continued bullish uptrend and is still in its early stages after breaking out of the larger falling wedge. Currently, the stock has formed an early uptrend channel and strong bullish break out of the multi-tested resistance turned support 1t 11,630 has been broken.
Ichimoku is showing strong bullish signal and all three long to short-term momentum are showing strong bullish momentum (MACD, Stochastic Oscillator and ROC)
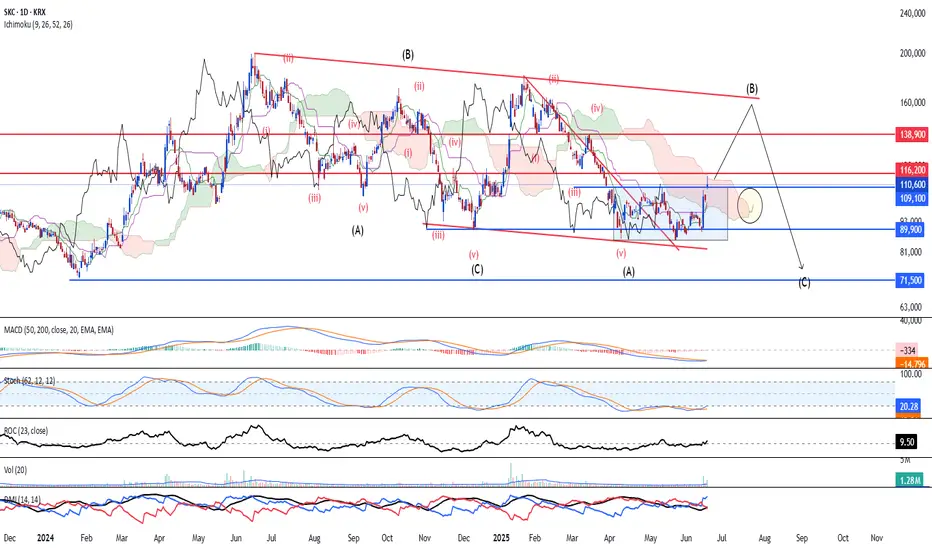
Extended double three corrective wave KRX:011790 is embarking on a double zig-zag wave and is likely at the next leg corrective wave B as price action shows a clear breakout of the consolidaitve range, which happens to be at the bottom of the descending channel.
Next up, Ichimoku has shown a bullish kumo twist and prices are trending above both the conversion+base line and the lagging span. Stochastic oscillator is oversold at the moment and should provide a support of a rally. Hence, we believe that SKC is likely to rally in the mid-term towards 138K and 160K
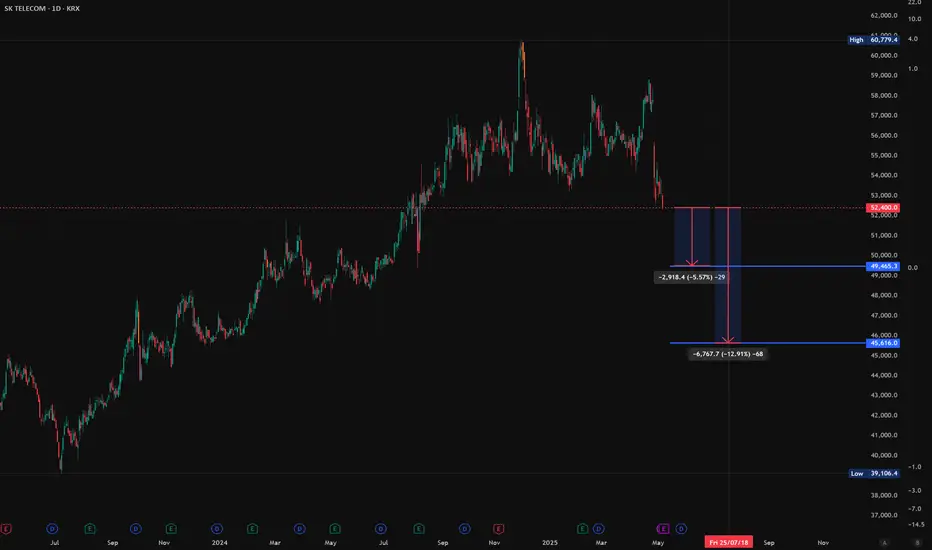
SK TelecomIt is going to plunge tp 45009 won.
It may cut dividens because of the Drop in the number of Users
that are caused by U sim chip information thief Catastrophy.
Don't buy this stock.
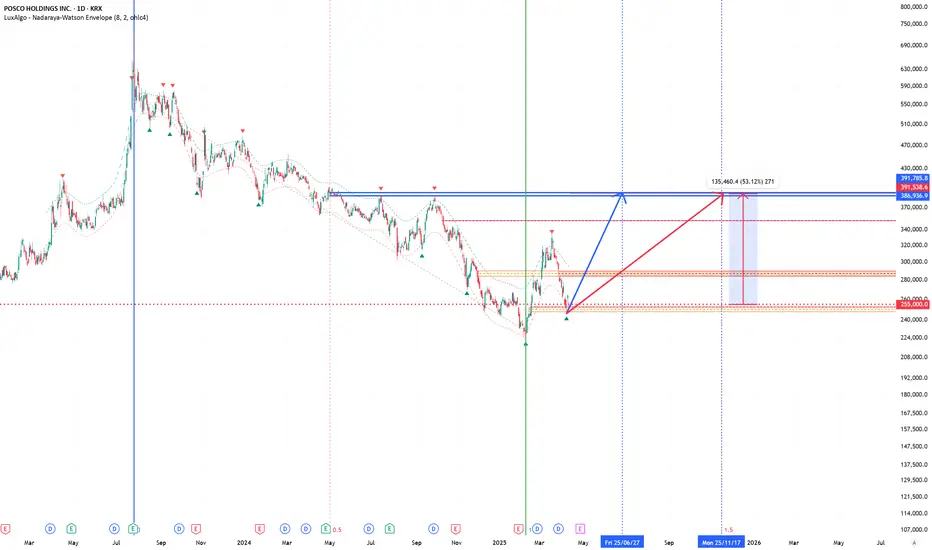
POSCONow, It is going to go up slowly.
Think that you are going to save " One Year Account " .
The rate is 50%.
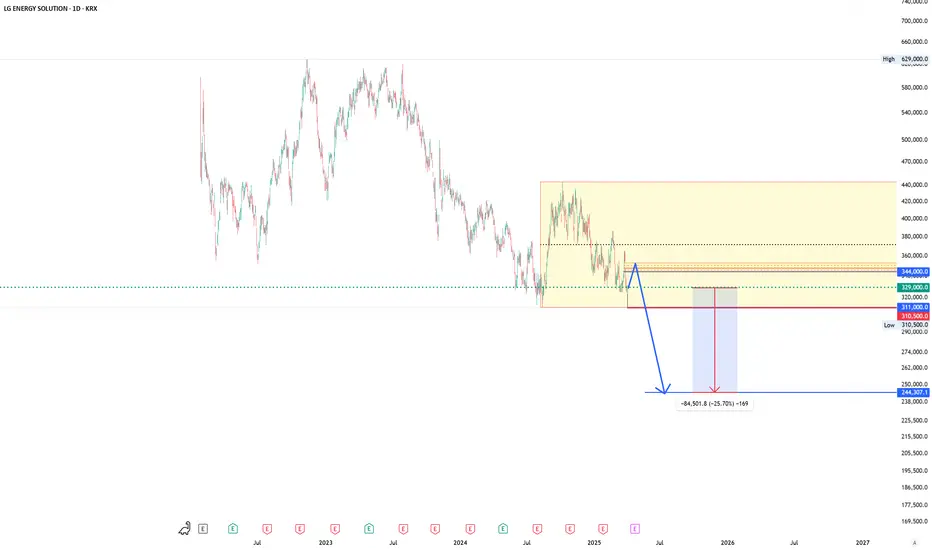
LG Energy SolutionSadly, It will sink to ~ W 24,000.
Naturally, Correction B wave of Elliot is possible after descending A Wave.
During, EXIT the secondary Battery company.
If not, you may exit the stock market because of " The Huge Loss ".
I hope My view must be incorrect.
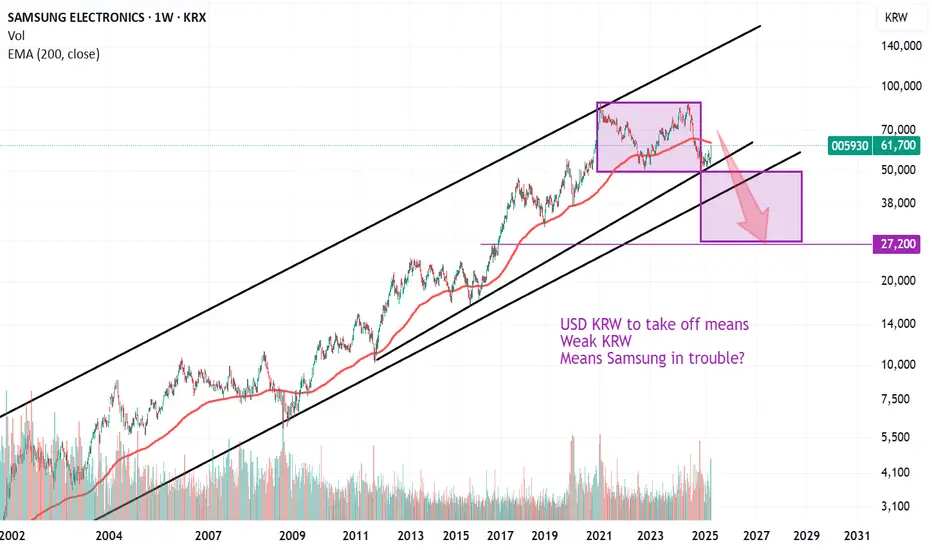
Samsung to move lower, confirm double top and break channel?Bearish for Samsung
Possible double top in place
Also implies that USDKRW would move higher as Samsung fails hence Samsung is mostly the KRW currency.
As global equity indices roll over in 2025 this could move lower
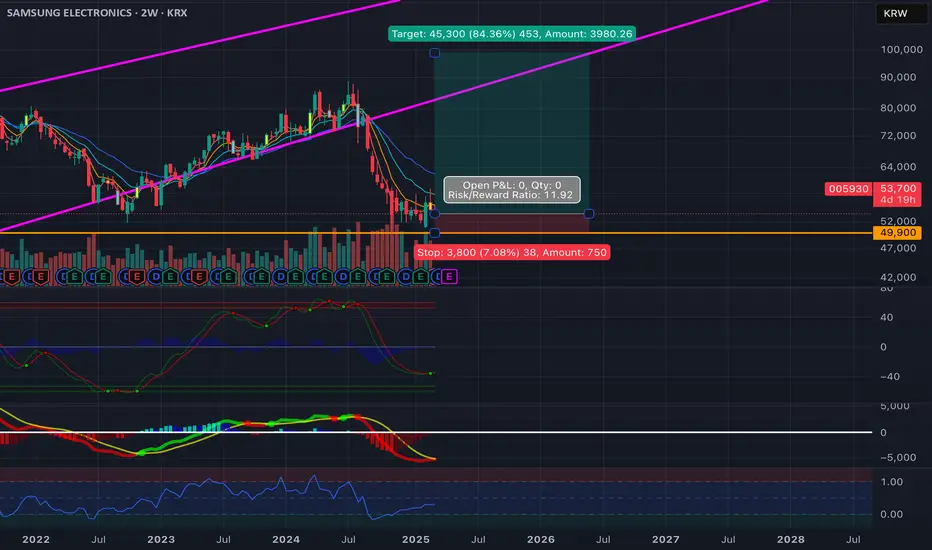
Good time to buy Samsung stocksIt went down a lot, and checked the floor.
It gave a fake rebound and fell back.
So, now it's ready for a go.
What do I mean?
Many individual investors entered thinking the price will go up, and they are losing hopes seeing a little minus %.
They will give up, and only after that process the price is ready to go up without the weaklings.
How cruel the market is, but that's what it is.
Buy till it falls to 49,900. Don't buy higher than 55,000 for the sake of your mentality.
Target is 99,000, which is about +99% profit in about 1 year.
See you in 1 year.
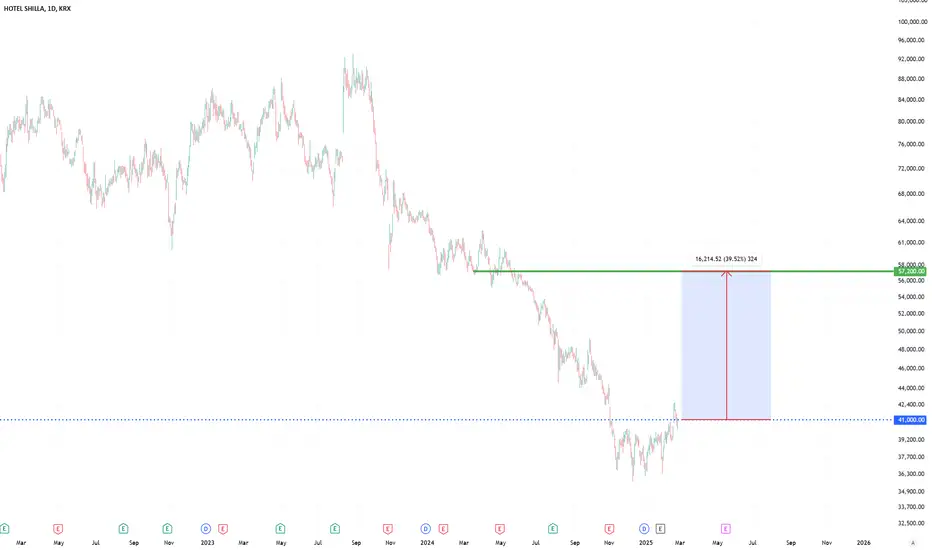
Hotel Shilla in KoreanIt deserves 33% profit that is 10 times korean Bank year-rate(3%).
Buy and Hold.
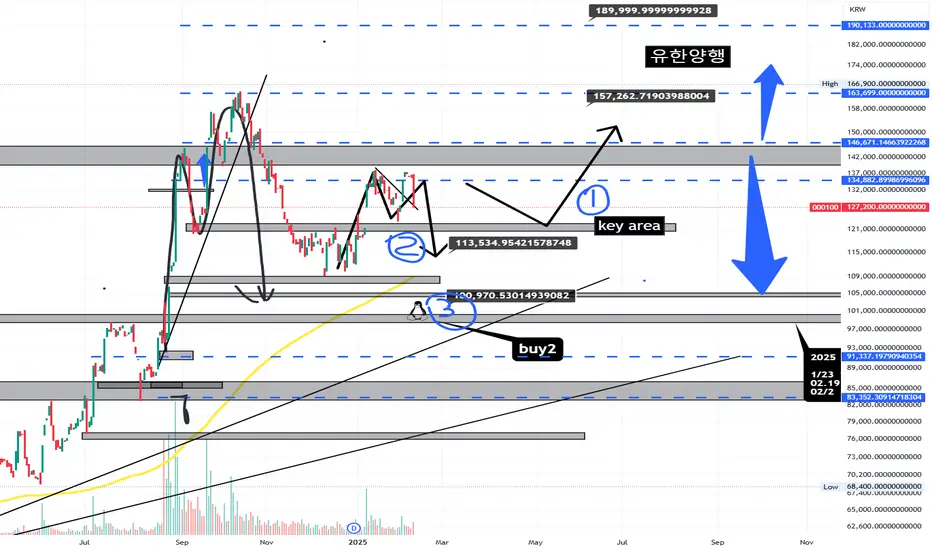
yuhan 000100 next moveyuhan ( 000100 ) is fail to break 138,000
so some correction expect to key area ( 121,000 ) and 113.534
if price is down continue ~~~~ expect to near 101,000 ( penguine )
scenario 1 2 3 is marked on the chart tkae care..
based on
fib
price action
harmonic theory
hanhwa ocean 042660 long secnariohanhwa ocean long tp scenario
based on fib
based on price action
long tp 1 2 3 marked on th chart good luck ^^

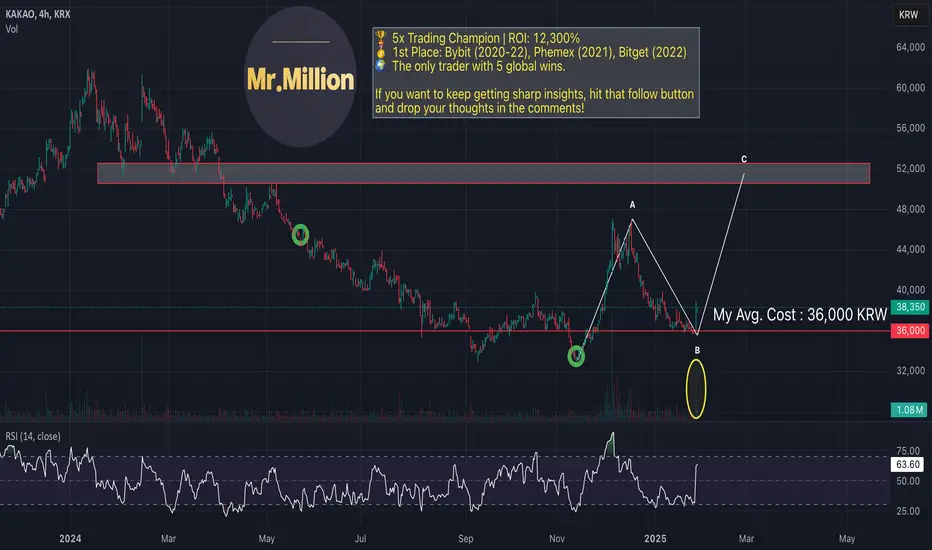
Mr.Million | My Kakao Position Update!Kakao bounced exactly where it should – on big volume! 🙏😊 I believe institutions are buying, and that’s always a great sign. 🍀
For full transparency:
My average cost: ₩ 36,000 (Korean Won)
Holding ~ ₩1,650,000,000 worth
How high could it go? I’m targeting ~ ₩52,000 per share 🤞
I’ll keep you updated on this holding – be sure to share & follow!
Mr.Million | Why Samsung is a Great Buy @ ~ 45,000 KRW!Reasons to be bullish? 📈
1. Completion of an ABC correction
2. Strong support zone
3. Potential bullish RSI divergence (Daily)
Also - No good news for Samsung? Sounds like a great time to buy!
🔥~ 45,000 KRW = Strong Buy 🚛🚛🚛
