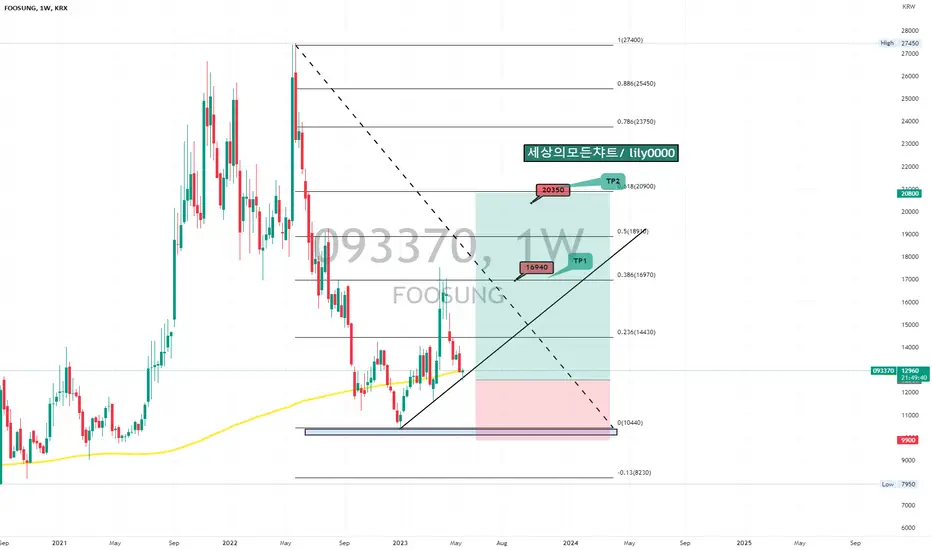
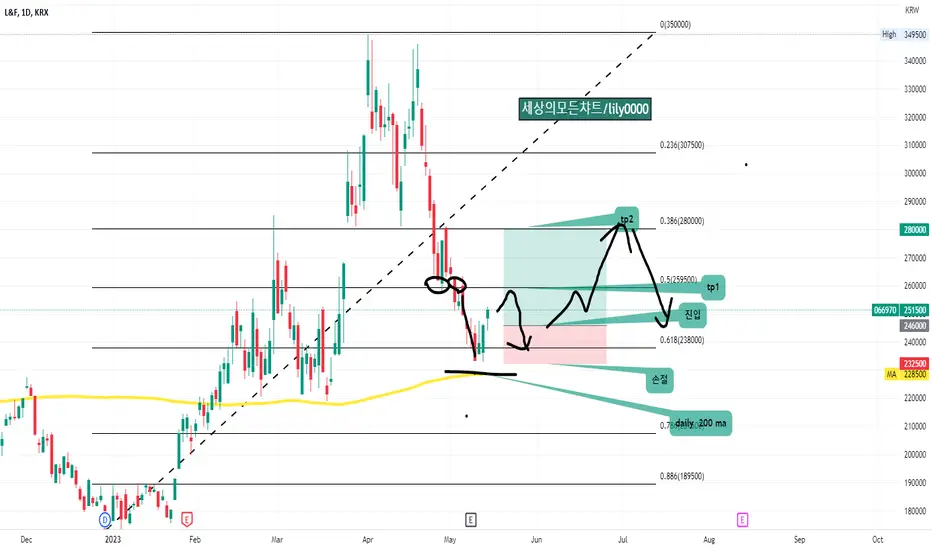
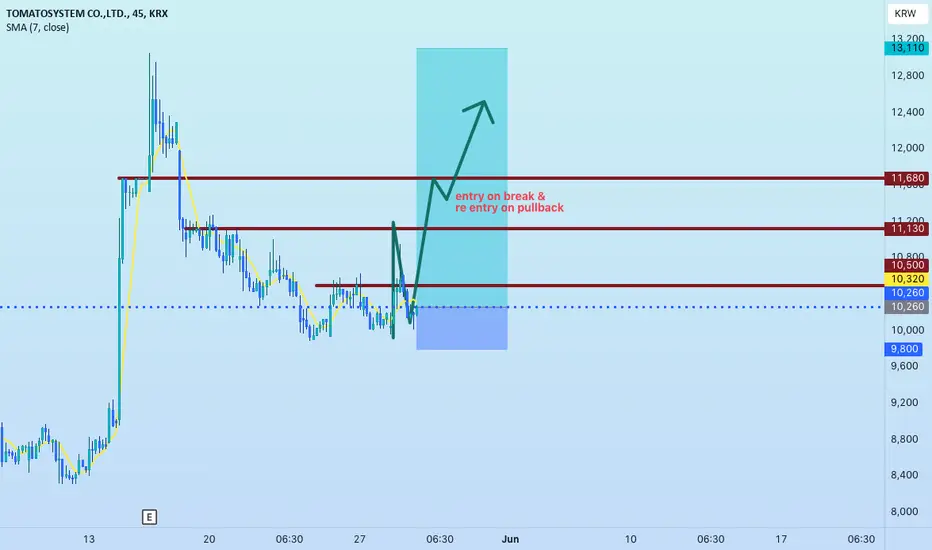
KETCHUP TOMATO SCALP : K-SCALP 30%+fighting🇰🇷Watched a KDRAMA bout a prop trader (in a office firm not ftmo) anyways he was failing to keep up with spot trading considering he was a warren buffet in stocks brought down to the fast paced world of scalping and meeting profit quotas
so i came to scalp korean stocks how hard can it be ive made swing calls on kospi/kosdaq
and despite my swing forecasts i scalp considering im in synch with the trend already
so i will hold 5 days thats the best i can do for a scalp and the levels are not tp they are where i would add on to the move (just realised prop firms dont hold trades over weekends mxm made it last a week)
if u know any propfirms there the kid could use some travel
kindly comment it below
Macro Monday 48 – The Specialists, South Korea Macro Monday 48 – The Specialists, South Korea
Apologies for the delay in this weeks release
South Korea appears to be an economy that is taking the specialization approach with a strong innovative focus on biotechnology, pharmaceuticals, heavy machinery, vehicles, specialized battery components and major EV battery manufacturing. The country is not just seeking to be the main manufacturers on a global scale of these products, but appears to be striving to be specialists in providing the most technologically advanced methods to drive the most advanced products in the marketplace.
South Korea is 6th in the World for Global Innovation
South Korea has recently achieved significant economic outperformance through technological innovation. South Korea jumped from rank 10 in 2020 to rank 5 in 2021 in the Global Innovation Index. Currently in 2024 South Korea is ranked 6th. This rise is attributed to its strong performance in industries related to public health and the environment, as well as its advancements in digital innovation, built on artificial intelligence, supercomputing, and automation. South Korea’s focus on deep science innovation, including biotechnologies and nanotechnologies, has also contributed to its economic success.
23.7% of the Global EV Batteries are Manufactured in South Korea
South Korea is a significant player in the global battery market. South Korean electric vehicle (EV) battery manufacturers; LG New Energy, SK On, and Samsung SDI collectively accounted for 23.7% of the global EV battery market in 2022, a staggering contribution to this thriving market.
South Korea are Electrical and Heavy Machinery Specialists exporting $171.3 billion in 2023 (accounting for 27 % of total exports)
South Korea is a significant player in the global heavy machinery market. While specific figures detailing South Korea’s exact percentage share of the global heavy machinery market are not precisely available, the country is known for its substantial contributions to the sector. South Korean companies like Doosan Machine Tools and Hyundai Wia are leading providers in the machine tool industry, with Doosan Machine Tools holding a market share of 49.3 percent within South Korea.
The country’s heavy equipment market is also characterized by a diverse range of products, including construction equipment, forklift trucks, and cranes, with major players like Caterpillar Inc, Hitachi Ltd, and Hyundai Construction Equipment Ltd, all contributing to its growth. South Korea’s focus on innovation and quality in manufacturing has positioned it as a key exporter of heavy machinery on the international stage.
The South Korean Stock Market - The KOSPI
The KOSPI (Korea Composite Stock Price Index) is akin to the S&P 500 in the U.S. however can have up to 800 companies included in the index. As an alternative you can review the KOSPI 200 which only includes the top 200 South Korean companies, but for today we will focus on the general KOSPI.
The top 5 largest companies in the KOSPI index:
1. Samsung Electronics (20% of the index): A global leader in technology, Samsung Electronics specializes in a wide range of consumer and industry electronics, including appliances, digital media devices, semiconductors, memory chips, and integrated systems.
2. SK hynix: The world’s second-largest memory chipmaker, SK hynix produces dynamic random access memory (DRAM) chips, flash memory chips (NAND), and CMOS image sensors (CIS) for a diverse global clientele.
3. Samsung Biologics: A biotech division of the Samsung Group, Samsung Biologics provides contract development and manufacturing (CDMO) services to the biopharmaceutical industry.
4.Naver: South Korea’s premier internet company, Naver operates the nation’s top search engine and offers a range of services including online marketing, e-commerce, and content development.
5.LG Chem: Founded in 1947, LG Chem leads the chemical industry in Korea and globally, providing products like ABS, polarizers, and EV battery cells. It has a vast network for production, sales, and R&D across the world.
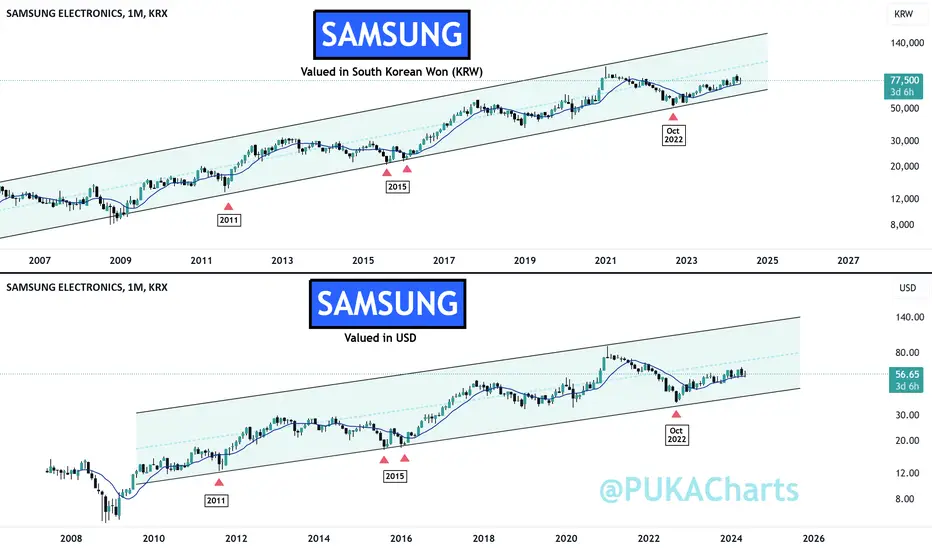
The KOSPI is traded in the South Korean Won (KRW) and I will show it to you for illustration purposes however when measured in USD, there has been a long term oscillation of price with no real sustained gains.
As I do not see an opportunity in trading the KOSPI, lets look at Samsung, one of the largest allocations in the KOSPI.
SAMSUNG (Ticker: 005930.KS)
You can clearly see that Samsung which is headquartered Suwon-si, South Korea has a long term ascending channel in both the KRW and in USD. There is a clear long term trend and opportunities to buy at the bottom of the channels.
Samsung primarily trades on the Korean Stock Exchange and has global depositary receipts that are listed in Europe, making it relatively easy for South Korea and Europeans to invest.
Unfortunately, Samsung shares don't trade on a U.S. stock exchange and the company doesn't offer American Depositary Receipts (ADRs), making it difficult for Americans to invest in the company. Sometimes Macro Mondays leads to a dead end for some traders and investors out there, you can still access Samsung through a variety of general ETF's for general exposure.
What is clear from the above, is that these waters appear much more murkier than the Indian stock indices we covered last week which are performing nicely since sharing. India has a GDP growth of 6%+ whilst South Korea is 2.6% at present (global average is 2.9%).
I could not really recommend a trade off the above South Korean charts covered, however we have an better understanding of the South Korean market, economy and offerings. We also have an idea of some of the larger companies and we can investigate this further down the line for opportunities.
All these charts are available on my Tradingview Page and you can go to them at any stage over the next few years press play and you'll get the chart updated with the easy visual guide to see how the South Korean market has performed. I hope its helpful.
PUKA
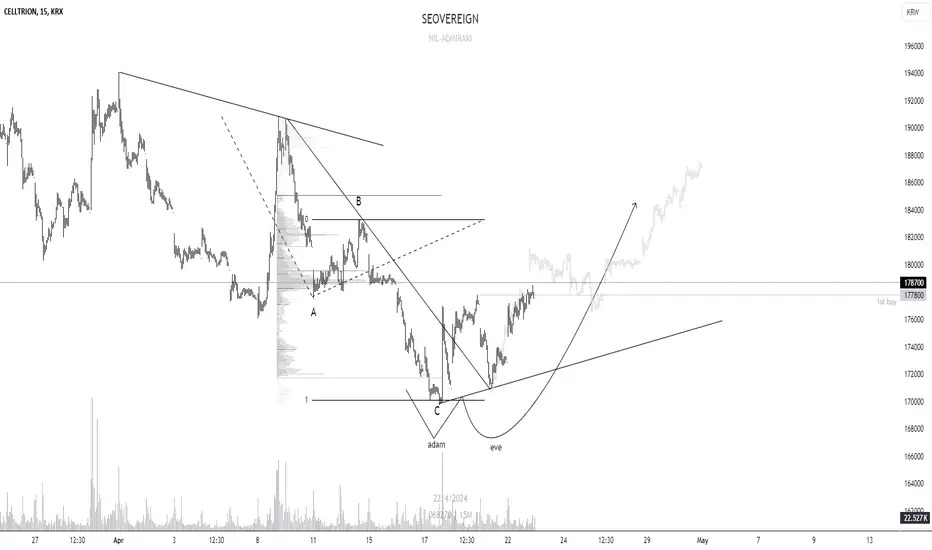
CELLTRIONNice to meet you. SEOVERIGN - This is SeoVerign.
Celltrion has formed ADAM&EV PATTERN!
If my prediction is correct, CELLTRION is expected to rise when the Korean market opens as of 20240424. We will observe the progress of the situation and proceed with the publication of additional ideas.
Investment volume, risk management, and investment decisions are your own, so please use them for reference.
I hope you have a good result. Good luck.
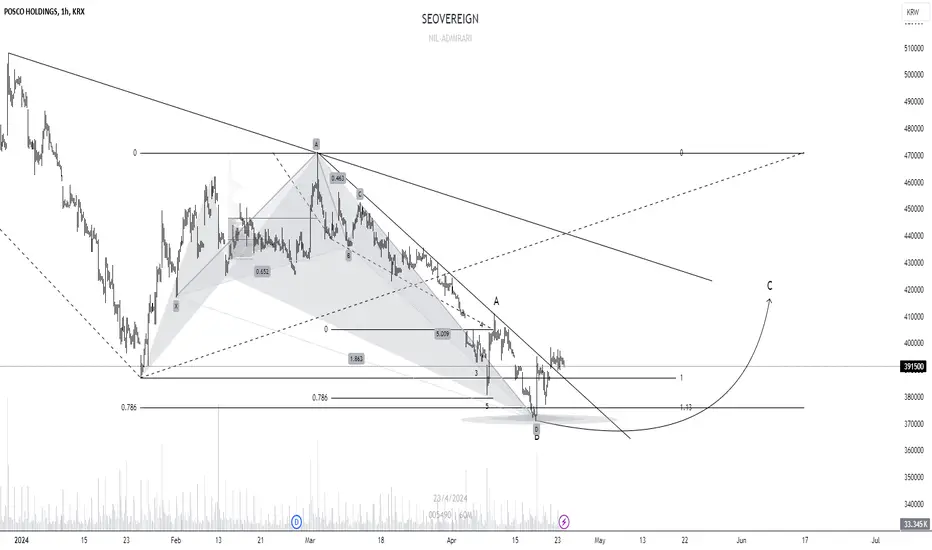
POSCO HOLDINGSNice to meet you. SEOVERIGN - This is SeoVerign.
It is seen as an attractive position for POSCO Holdings to buy.
It's based on ELLIOTT WAVE and trend lines and various technical theories.
If it goes as I think, I'll solve it and explain it step by step.
Investment volume, risk management, and investment decisions are your own, so please use them for reference.
I hope you have a good result. Good luck.
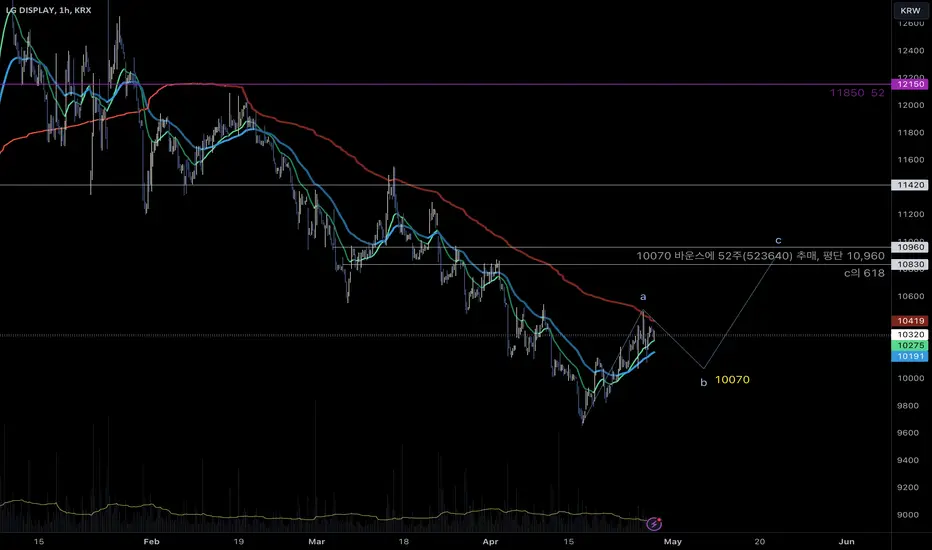
LG display10070 adding 1:1 #52
avg.10,960
use this as seed money to adding other slowly turn around stocks
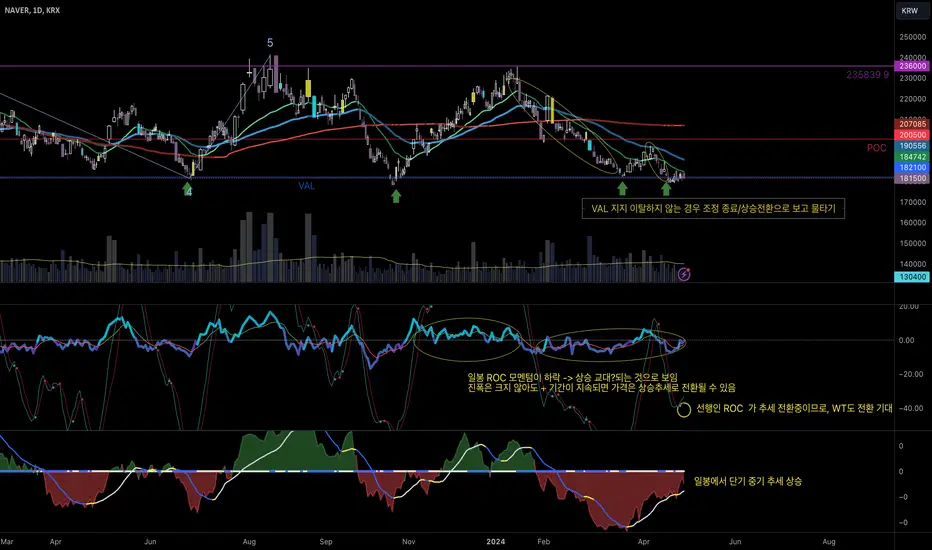
Naver, one huge flat correction finally ended? or keep plunging?It may not be easy to turn around this huge S.Korean internet portal service provider.
Its management and staff have proved very capable to develop profitable service yet it is missing to ride AI tsunami.
Huge volume block is over the head. Not clear sign of market is buying it.
However, if it keep the very last VAL at 18150, I hope it can turnaround to the upside.
1st buying is at current price, 2nd is when it succeed breaking out 1D 50EMA.
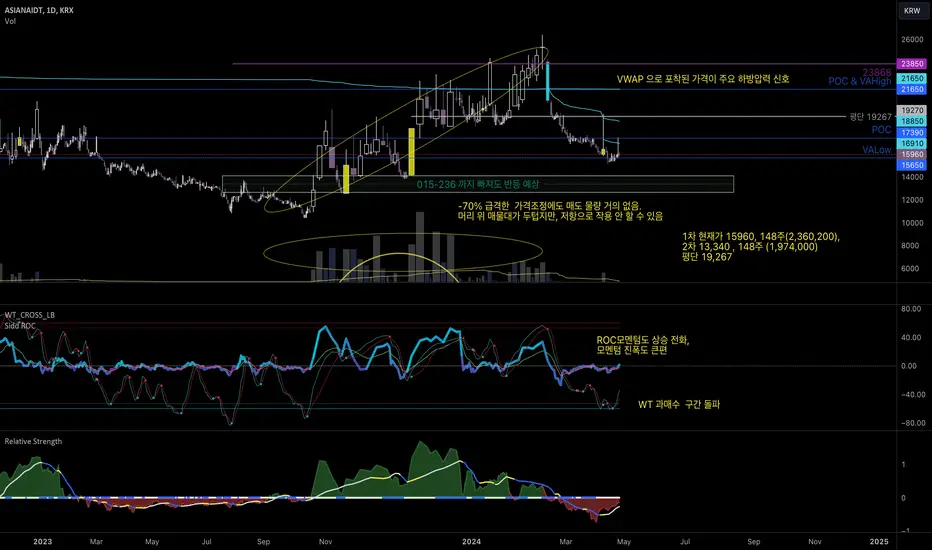
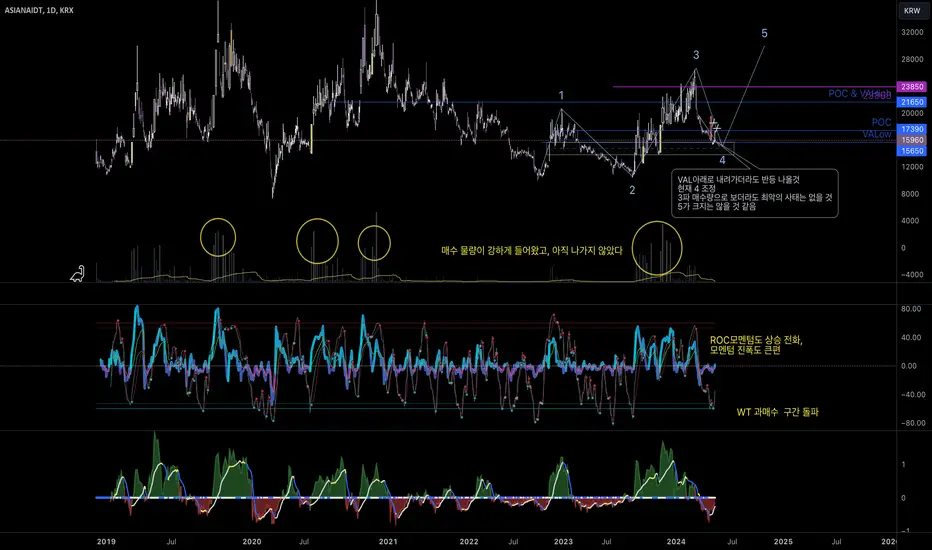
Asiana IDT addtionBy all the TA on this, this is the best chance to profitably exit
first and most of all, market buys and not exiting. \
It can continue correction to 0.015-0.236 level but bounce up if there is no sign of exit.
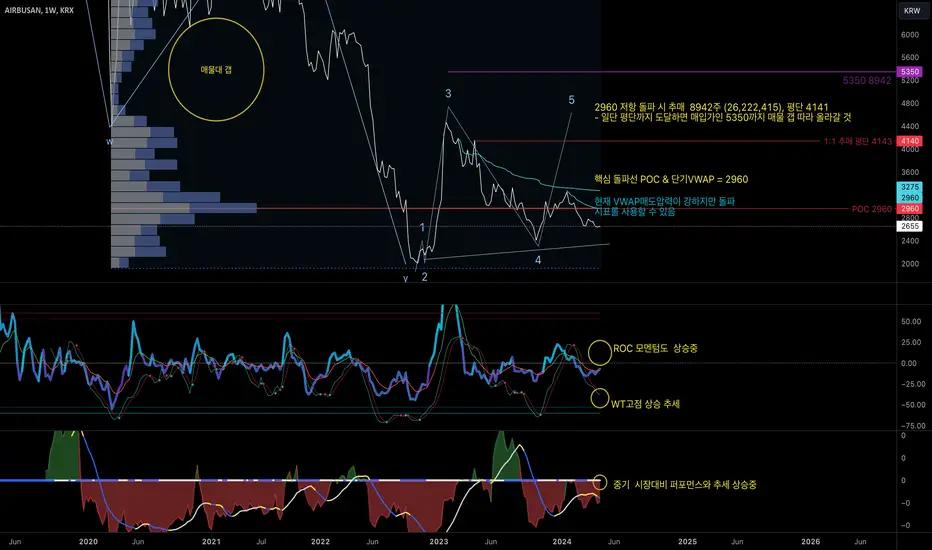
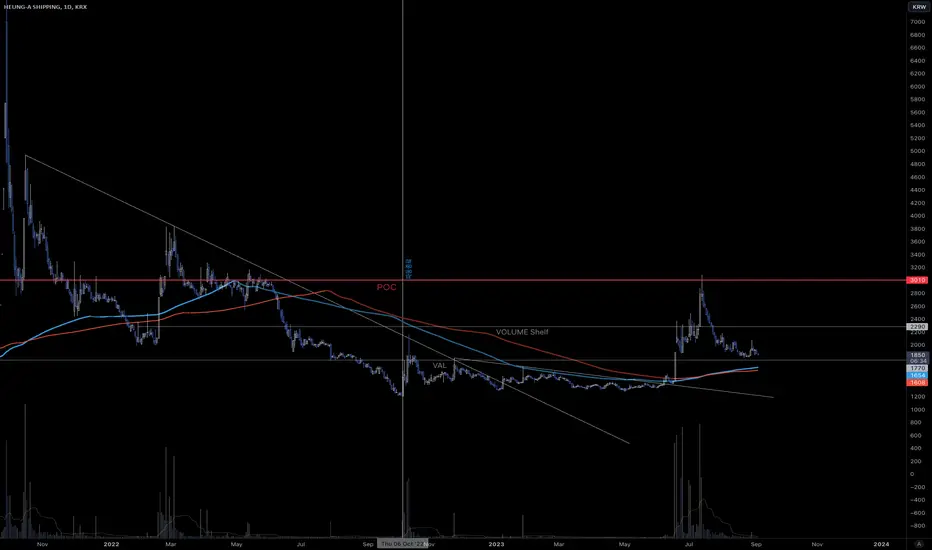
AirBusan AdditionAssumption: Correction finished and now on a 5 of a new impluse
just trying to B.up POC at 2960
there is a FVG over 6000
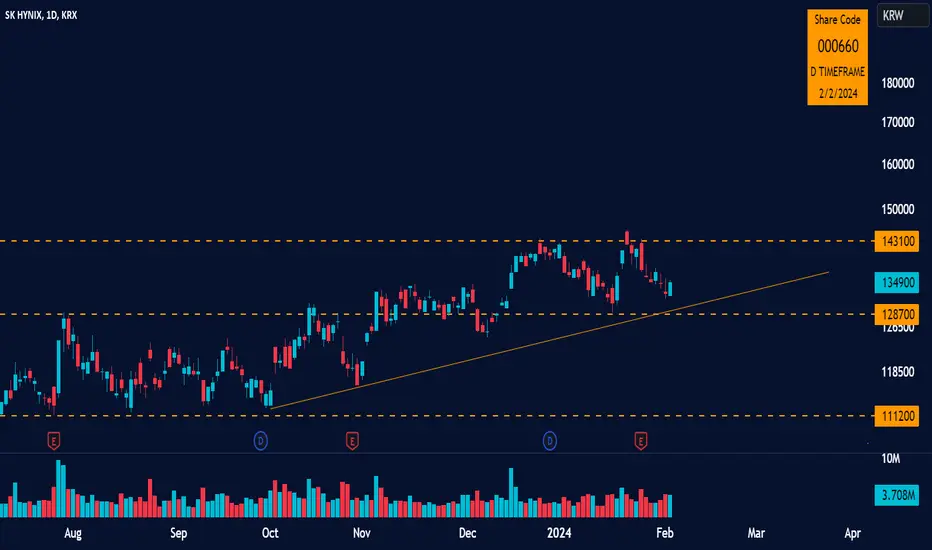
000660 (SK Hynix)SK Hynix Inc. is a South Korean supplier of dynamic random-access memory chips and flash memory chips. Hynix is the world's second-largest memory chipmaker and the world's sixth-largest semiconductor company.
Possible lift-off.
Bias: Buy/Long
Find the channelLook at that channel. It's poised to go up, although it will likely take a year or so with this weekly chart.
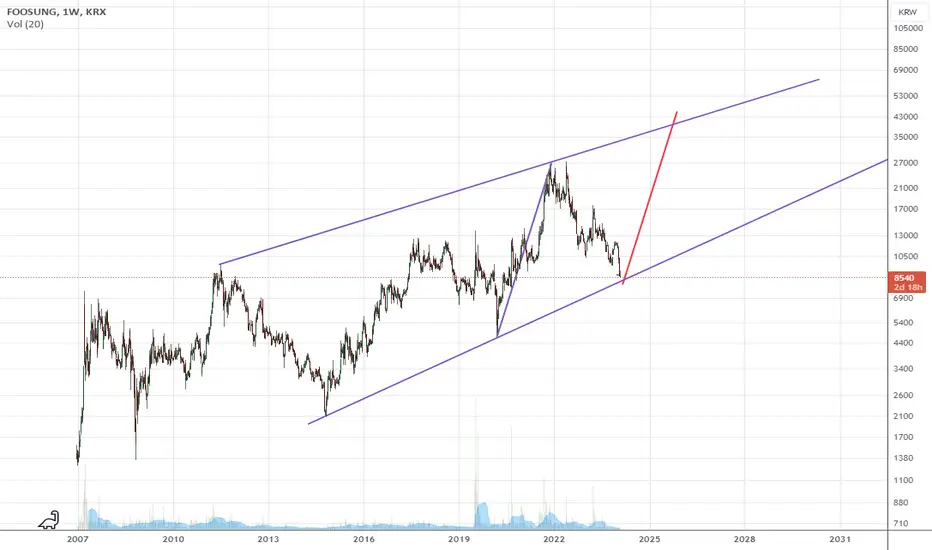
Finding the sickleWatch the pattern unfold. It'll be a wild ride!
This is the beginning of the final C leg up.
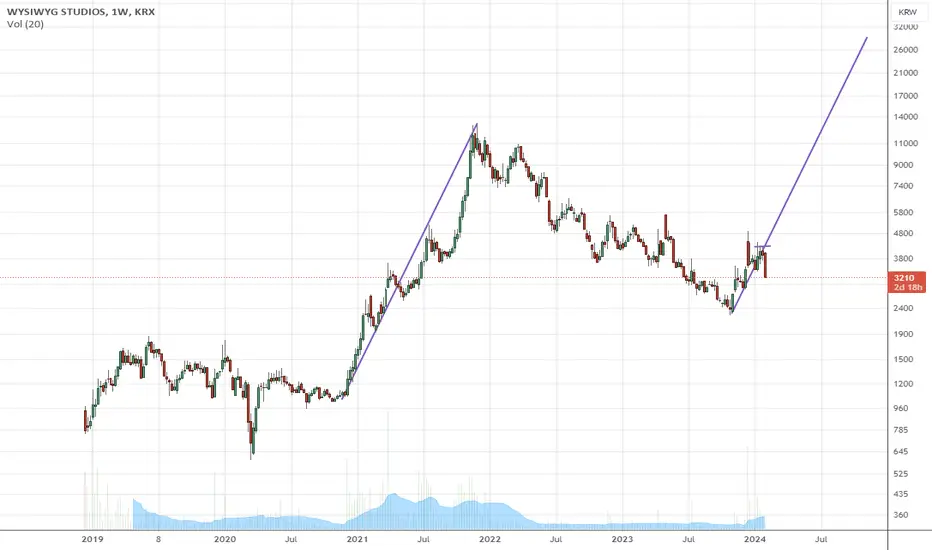
HUYNDAI MTR make the history price can go up over 100%will HUYNDAI MTR make all time high again??
we can see the impulse in 2020
and price made pull back for 2y
i see the price made bottom
time to buy !
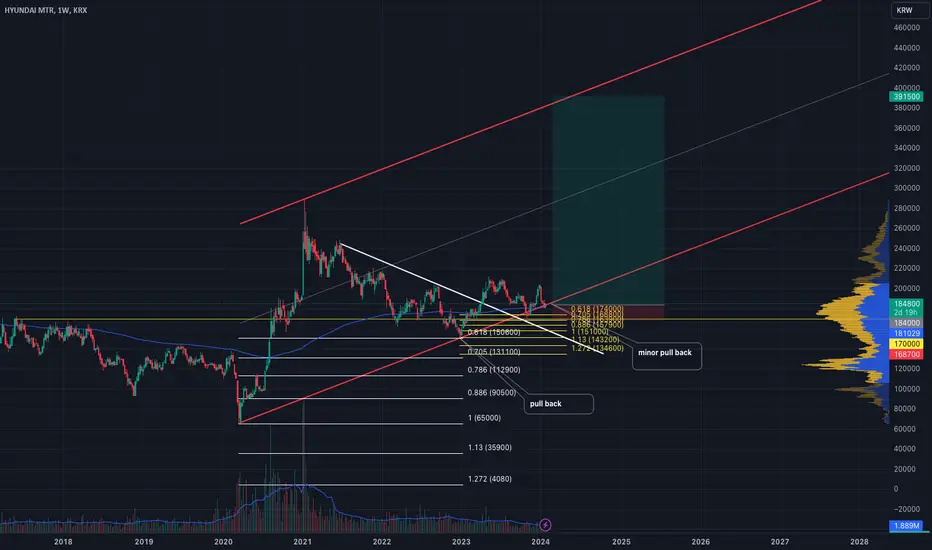
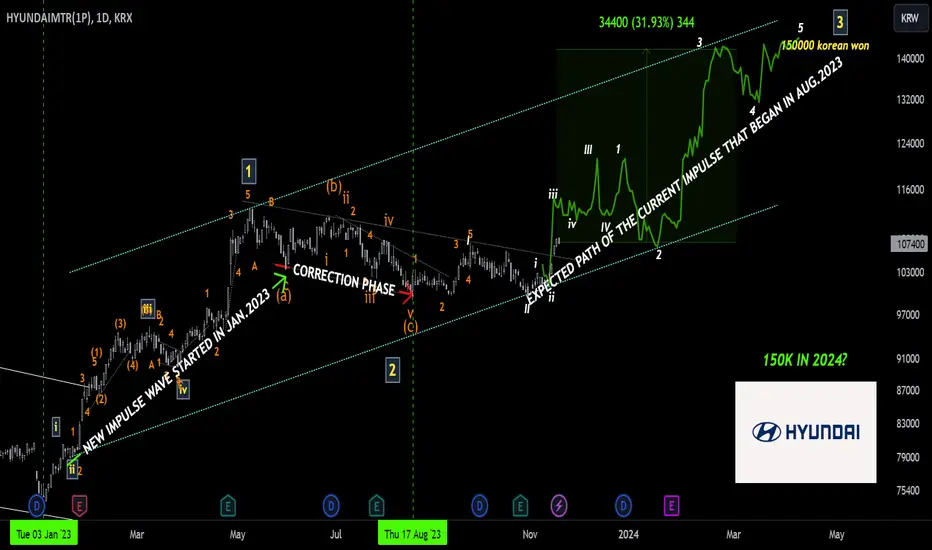
Hyundai motors to witness new highs in 2024?The South Korean multinational automotive manufacturer, Hyundai Motors was ranked world's third-largest carmaker in 2022 in terms of production.
Hyundai motor group(which includes Genesis and Kia brands) has grown massively during the last decade surpassing giants like General motors, Nissan, Ford and Stellantis (in terms of annual sales volumes). At this point only Toyota and Volkswagen are ahead of this Korean giant slayer.
This growth can be seen on the stock chart of the company as well. The stock set out a new impulse wave in Jan. 2023 that completed in May 2023.The stock then completed a Zig zag(Elliot wave) correction between may-Aug hardly retracing even 38.2% of the rise(remember shallow retracements are a reflection of strength and bullish sentiment).
Standing currently near the 107k South Korean won(KRW) the auto maker has a potential of reaching the 150K KRW in 2024.
on the downside the 102K is the crucial support for the stock.
Note*- This chart is for educational purpose only.
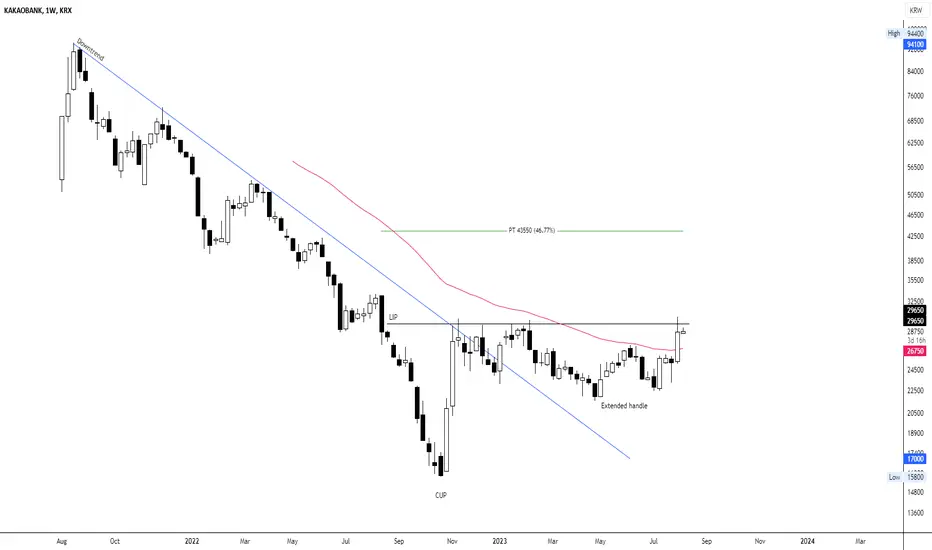
KAKOBANK WCA - Cup and HandleCompany: KAKOBANK
Ticker: 323410
Exchange: KRX Korea Exchange
Sector: Banking/Financial Services
Introduction:
In today's technical exploration, we focus on KAKOBANK, a prominent entity in the banking and financial sector. The weekly chart showcases a potential bullish reversal in the form of the Cup and Handle pattern, which has been developing over the past 50 weeks.
Cup and Handle Pattern:
The Cup and Handle pattern is a bullish continuation or reversal pattern that signifies a period of consolidation followed by a breakout. It's characterized by a rounded bottom (the "cup") and a consolidation (the "handle"), which precedes a breakout.
Analysis:
KAKOBANK's prior trend was bearish, as illustrated by the blue diagonal line. However, this downward trend seems to have been interrupted by a Cup and Handle pattern, suggesting a potential bullish reversal in the offing. The so-called "lip" or the resistance level of the pattern stands at 29,650 KRW.
The stock's price remains above the 40 EMA, reinforcing the bullish sentiment. If the price successfully breaks out above the lip, a bullish run is anticipated. The projected price target based on the pattern's depth stands at 43,550 KRW, amounting to an estimated rise of approximately 47%.
Conclusion:
KAKOBANK's weekly chart puts forth a promising bullish reversal scenario. A successful breakout above the lip of the Cup and Handle pattern could pave the way for an attractive trading opportunity.
---------------------------------------------------------------------------------------------------------------------
Remember, this analysis should be integrated into your broader market research and risk management protocols. It's not a direct trading recommendation.
If this analysis proves helpful, please consider sharing, liking, and staying tuned for more insights. Happy trading!
Best regards,
Karim Subhieh
Disclaimer: This analysis is for educational purposes only and shouldn't be considered as financial advice. Always undertake your own research and consult with a financial advisor before making investment decisions.
SAMSUNG FORECAST Q3 23the beta mad llinked already caught shorts on the kosdaq
just sharing this post for my student so not gonna say 2 much

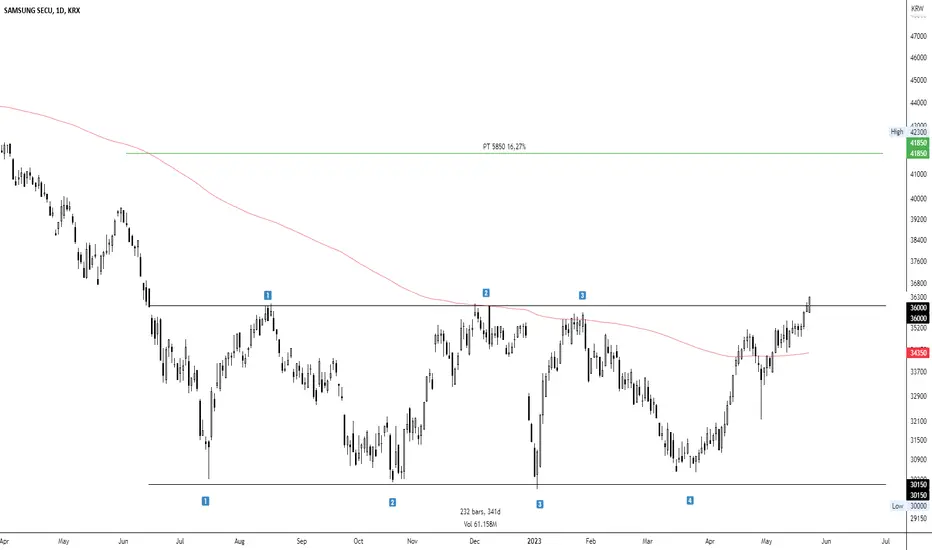
Samsung SECU DCA - RectangleCompany: Samsung SECU
Ticker: 018260
Exchange: Korea Exchange (KRX)
Sector: Technology
Introduction:
Welcome to today's technical analysis. We're turning our focus to Samsung SECU, analyzing its daily scale chart on the Korea Exchange (KRX). The price action suggests a well-defined rectangle pattern formation, which, coupled with the bullish market sentiment reflected in the KOSPI Composite Index, presents an interesting setup.
Rectangle Pattern:
A rectangle pattern is a trend continuation pattern formed when the price oscillates between parallel support and resistance levels. The breakout direction indicates the trend direction.
Analysis:
Samsung SECU's price has been moving within a clearly defined range, forming a Rectangle pattern. The upper boundary of this Rectangle is at 36000 KRW, while the lower boundary is at 30150 KRW. With four touch points at both boundaries, the fourth at the upper boundary has already signaled a breakout.
Additionally, the price is above the 200 EMA, indicating a bullish market environment. As a result, a long position becomes a favorable consideration.
Our projected price target post-breakout is set at 41850 KRW, translating into a potential price rise of approximately 16.27%.
Conclusion:
Samsung SECU's daily chart presents a compelling scenario, with a clear Rectangle pattern and a recent breakout. Given the bullish sentiment in the overall market, as indicated by the rising KOSPI Composite Index, long positions currently seem favorable.
As always, remember that this analysis does not constitute financial advice. Conduct your own research and consider risk management strategies before making any investment decisions.
If you found this analysis helpful, please like, share, and follow for more insights. Happy trading!
Best regards,
Karim Subhieh
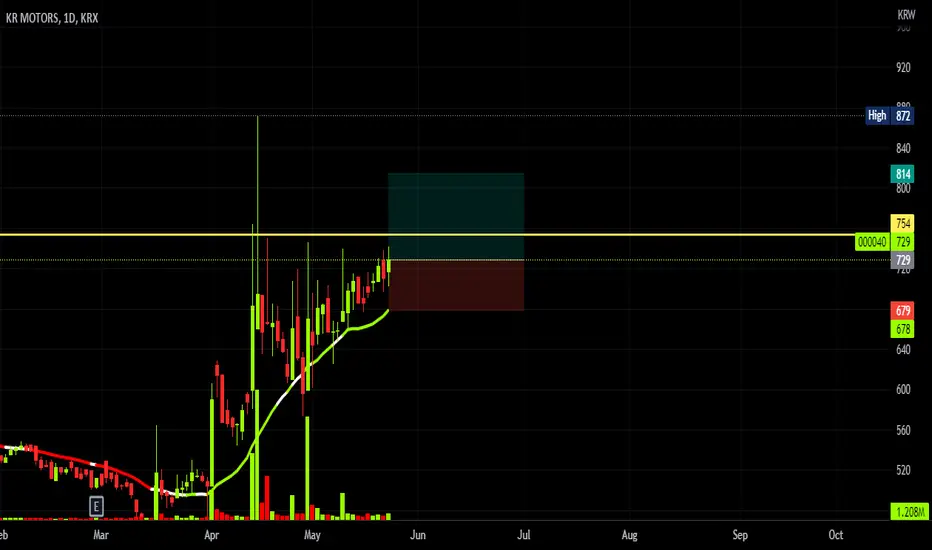
YOU CAN BUY 000040You can take the risk and buy KR MOTORS stock tomorrow, pay attention to the tough resistance level we have at 754, set your TP and SL and pay attention to the resistance line.
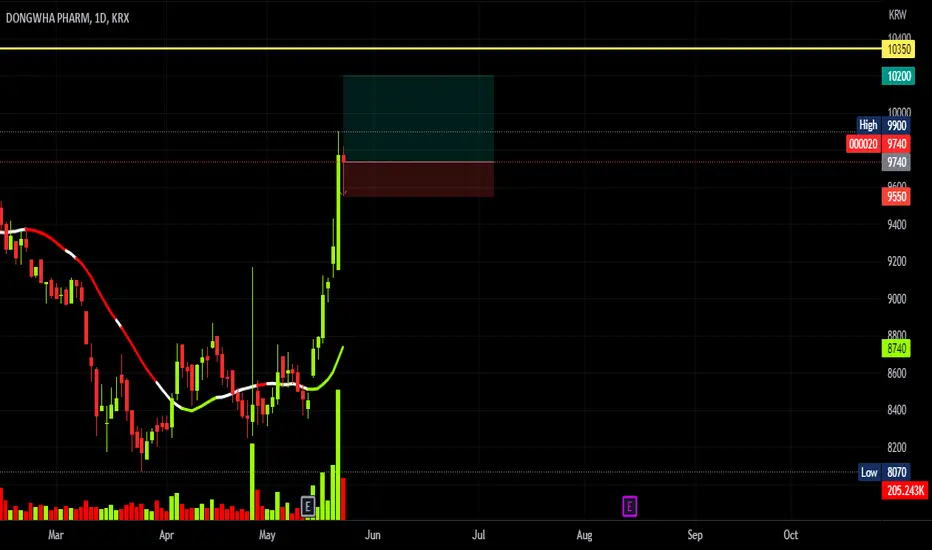
BUY 000020Here's a trade for tomorrow for you Korean traders on the DONGWHA PHARM stock, buy it and set your TP and SL, pay atttention for the resistance level at 10350.
Hyundai Mobis - Rounding BottomCompany: Hyundai Mobis
Ticker: 012330
Exchange: Korea Exchange (KRX)
Index: KOSPI 100
Region: South Korea
Introduction:
Greetings to all. In today's technical analysis, we're focusing on Hyundai Mobis, a constituent of the KOSPI 100. The company's weekly chart reveals a compelling potential long position setup, featuring a clear rounding bottom pattern.
Rounding Bottom Pattern:
The rounding bottom pattern is a long-term reversal pattern that is typically bullish. It signifies a gradual transition from a bearish trend to a bullish one.
Analysis:
Hyundai Mobis had been in a clear downward trend, as evidenced by the blue diagonal resistance line. A beautiful rounding bottom pattern has since formed during the consolidation phase. The horizontal neckline of this pattern is at 231500 KRW, coinciding almost exactly with the position of the EMA 200, underscoring the significance of this resistance level.
Should we witness a breakout above this defined zone, it could signal an opportune moment to initiate a long position. The price target, assuming a successful breakout, would be set at 273000 KRW, corresponding to a potential price increase of approximately 18%.
Please note, it's crucial to wait for a weekly candle to close above this resistance before entering this position. At present, Hyundai Mobis should be considered a high-priority watchlist candidate.
Conclusion:
The weekly chart of Hyundai Mobis presents an appealing scenario, with a rounding bottom pattern potentially indicating a bullish reversal. A breakout above the well-defined resistance could provide an opportunity for a long position.
As always, please bear in mind that this analysis does not constitute financial advice. Conduct your own research and implement risk management strategies when investing.
If you found this analysis insightful, please like, share, and follow for more updates. Happy trading!
Best regards,
Karim Subhieh