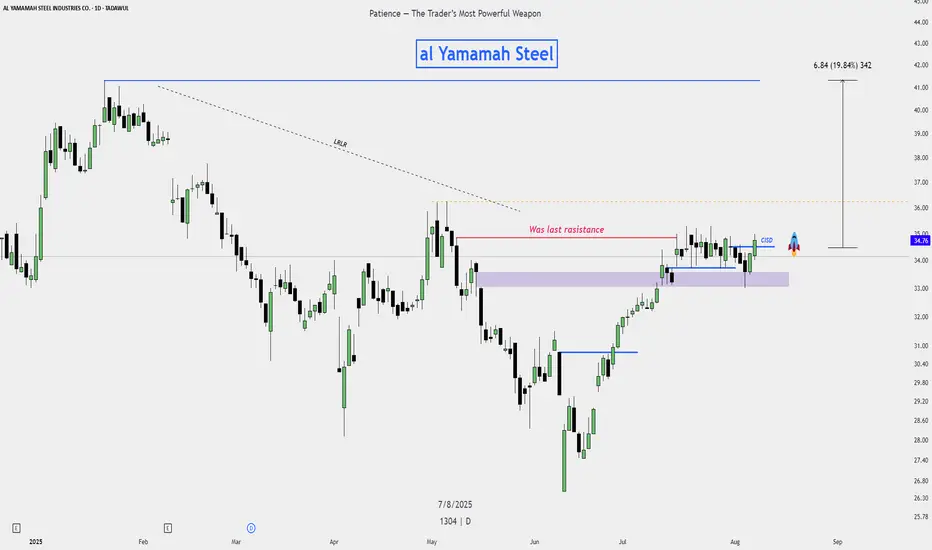
Al Yamamah Steel – Buy Plan Al Yamamah Steel – Buy Plan 🚀
Entry:
Buy on confirmed breakout above the recent consolidation range.
Ideal entry if price retests the breakout level and holds strong.
Stop Loss:
Place stop loss just below the breakout zone to protect against false moves.
Targets:
First target at the next resistance level.
Final target at the previous major swing high for maximum potential gain.
Risk Management:
Risk only a small portion of total capital.
Add positions gradually if price continues to hold above the breakout zone.
Bias:
Price action suggests bullish continuation toward previous highs, with potential for extended rally if momentum remains strong.
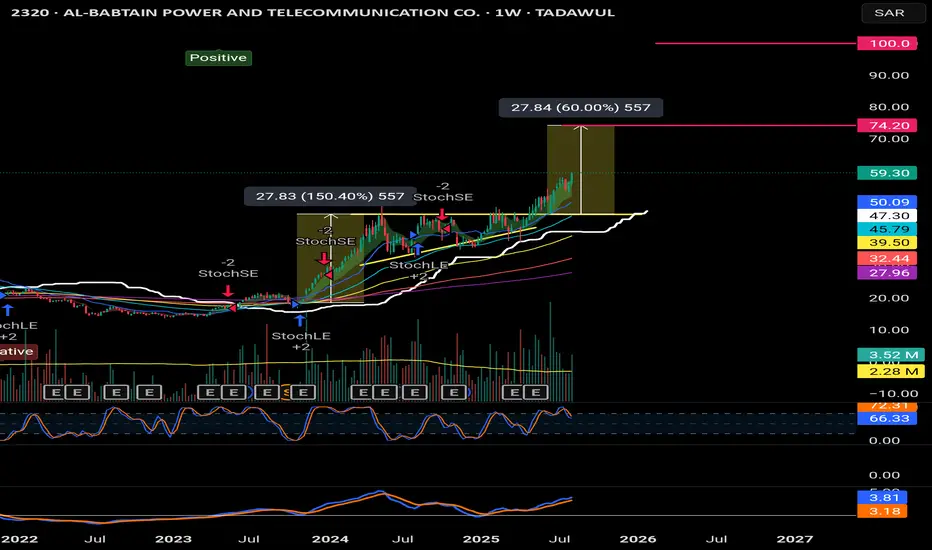
Babtain 2320, breakout and heading towards 1002320 made a breakout of a pattern couple of weeks ago and with recent earning report of the 2nd quarter and low P/E ratio and high growth rate the stock is heading towards 75 SAR and possible 100 SAR
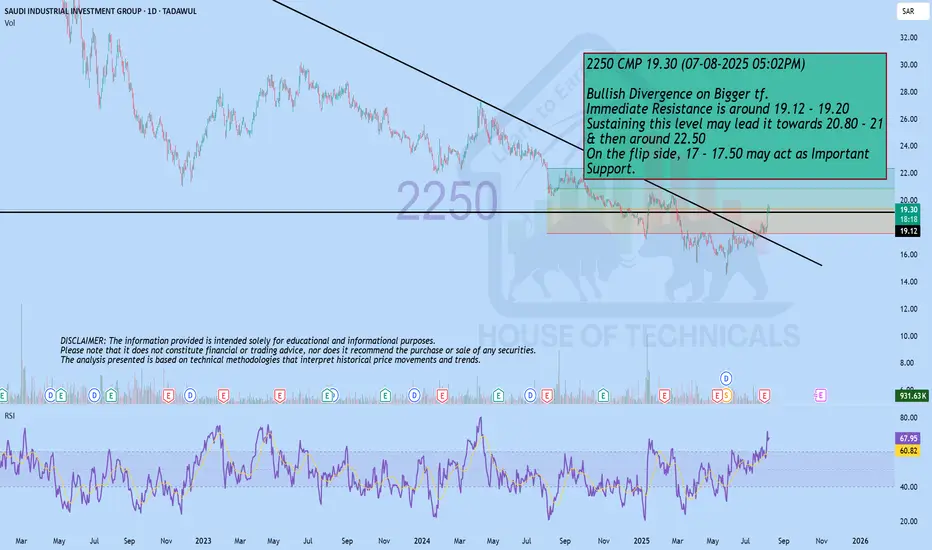
Bullish Divergence on Bigger tf.2250 CMP 19.30 (07-08-2025 05:02PM)
Bullish Divergence on Bigger tf.
Immediate Resistance is around 19.12 - 19.20
Sustaining this level may lead it towards 20.80 - 21
& then around 22.50
On the flip side, 17 - 17.50 may act as Important
Support.
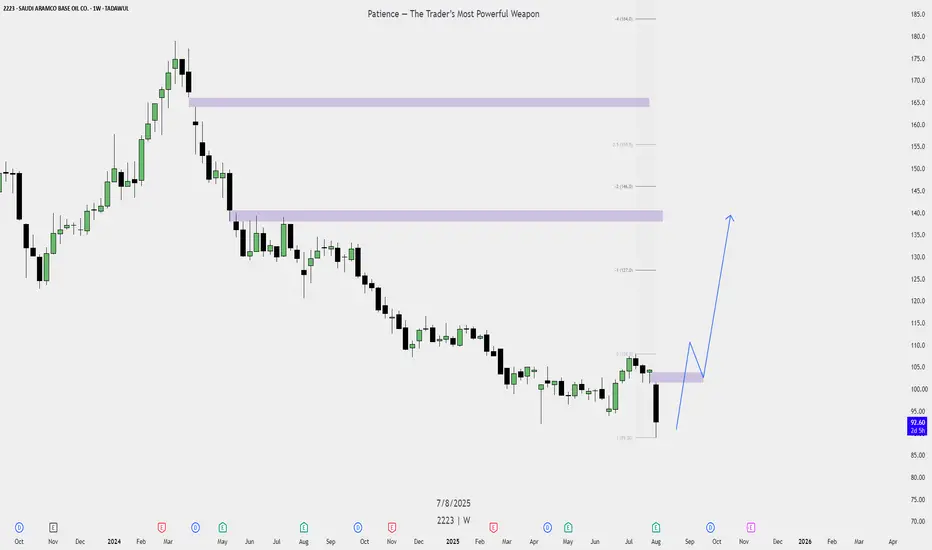
Saudi Aramco Base Oil Co. (2223 – Tadawul)Here’s a **Buy Plan** based on your weekly chart for **Saudi Aramco Base Oil Co. (2223 – Tadawul)**:
---
## 🟢 **Buy Plan: Aramco Base Oil (2223) – Weekly Chart**
### 📊 **Current Market Context:**
* **Current Price:** 92.55 SAR
* **Recent Swing Low:** 89.00 SAR
* **Fair Value Gap (Support Zone):** 100 – 105 SAR (Approximate)
* **Major Resistance Zones:**
* **Zone 1:** 145 – 150 SAR
* **Zone 2:** 165 – 170 SAR
---
### 📝 **Entry Plan:**
* **Entry Zone:** Wait for price to reclaim **100–105 SAR** (the lower Fair Value Gap zone).
* Entry Trigger: Strong bullish candle close inside or above this FVG zone on the **Weekly timeframe**.
---
### 🎯 **Target Zones:**
1. **Target 1:** 127 SAR (First Fib level; short-term target)
2. **Target 2:** 146 SAR (Previous major resistance zone)
3. **Target 3:** 165 SAR (Higher timeframe FVG + Fib zone)
---
### 🛡️ **Stop Loss:**
* **Below 89.00 SAR** (recent swing low)
* Conservative Stop Loss: 88.50 SAR
* Risk: Reward Ratio = Minimum 1:2
---
### 📌 **Trade Conditions:**
* Price must close above **100–105 SAR zone** with volume confirmation.
* **No entry** if price stays below 100 SAR or forms weak candles.
* Add position only after a **weekly candle closes bullish** in the FVG zone.
---
### 🧠 **Strategy Reminder:**
* **Patience is key** – avoid early entries.
* Wait for **higher timeframe confirmation** before executing.
* Monitor for **lower timeframe bullish structure** after weekly reclaim.
---
Let me know if you'd like this as a **PDF or image** for sharing or record-keeping.
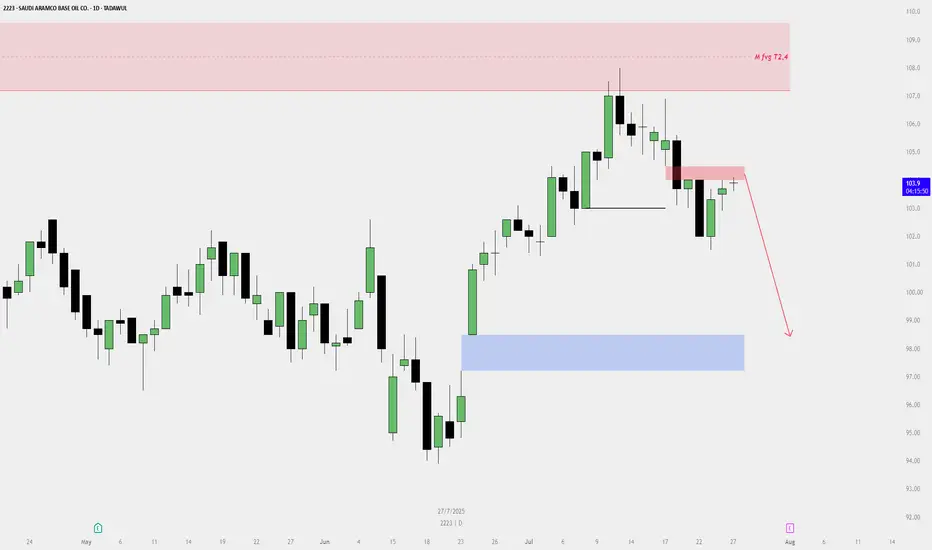
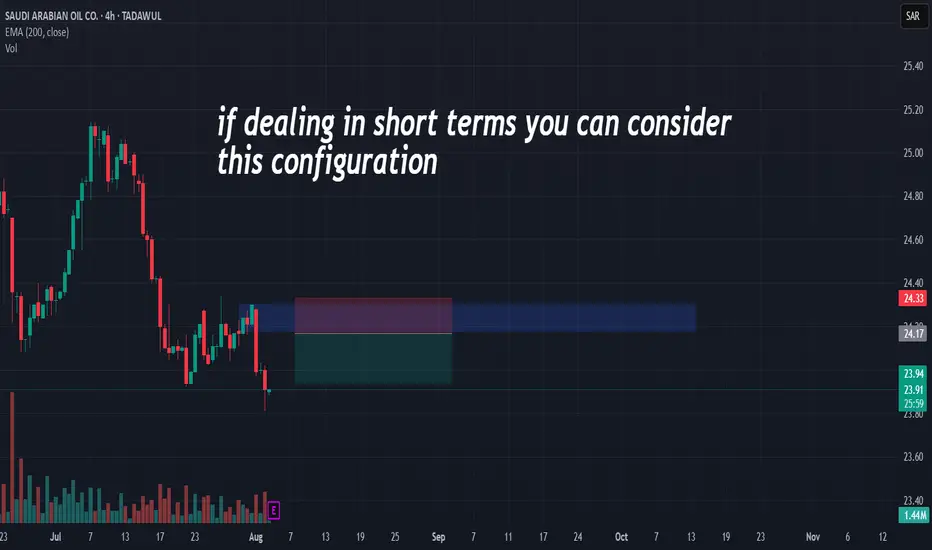
Saudi Aramco Base Oil Co. (Luberef - 2223) on the Daily timefram🔻 Sell Plan Summary
🔴 Key Supply Zones:
Monthly Fair Value Gap (FVG) / Premium Supply Zone — (Red Box around 108–110 SAR)
Labeled as “M fvg T2,4” on your chart.
Price previously reversed from this zone, indicating strong selling pressure.
Daily Bearish FVG / Rejection Zone — (Red Zone around 104.5 SAR)
Price is reacting to this short-term supply area.
It hasn't closed above this zone, showing weak bullish momentum.
🔵 Target Zone:
Daily Bullish Fair Value Gap (FVG) — (Blue Box: 96.5–98.5 SAR)
This is your likely downside target, situated in the discount zone.
A strong demand area where price may find support.
📉 Market Structure:
Price formed a lower high, suggesting bearish structure.
Recent candles show rejections from supply, supporting a short bias.
The chart includes a red arrow showing expected downward movement.
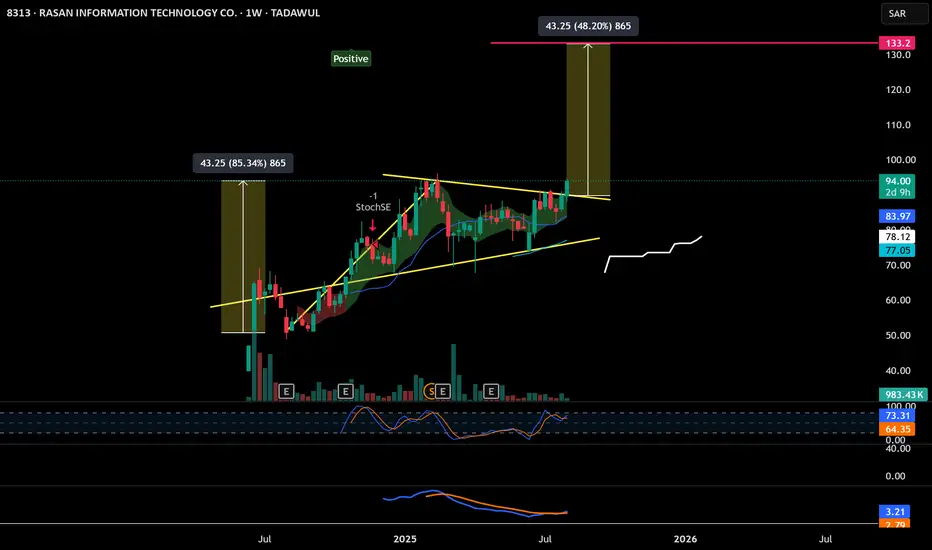
Strong Breakout in flag patternRasan showing a flag pattern and just had a breakout on 1 day period but still need to stay around the current price range for full 1 week breakout in order to establish a strong foundation to target price range between 120-130 SAR.
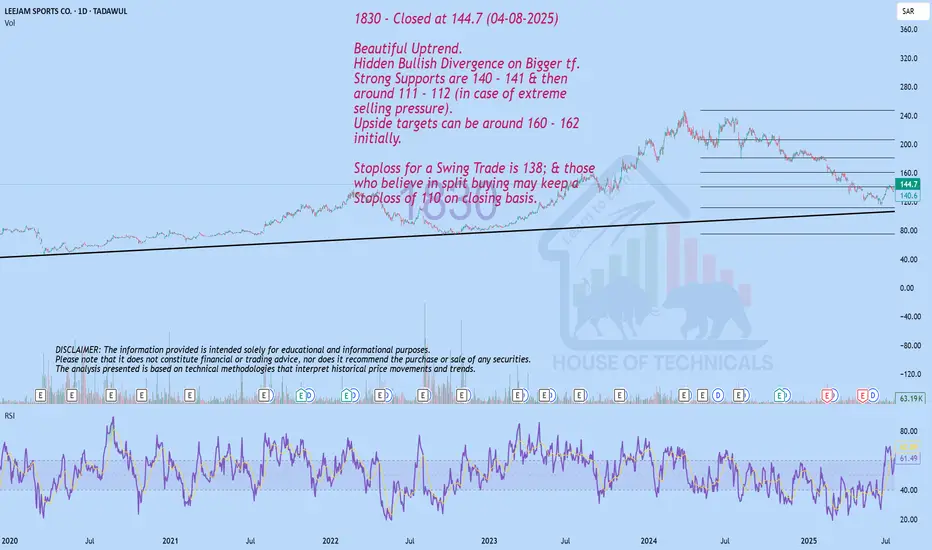
Beautiful Uptrend.1830 - Closed at 144.7 (04-08-2025)
Beautiful Uptrend.
Hidden Bullish Divergence on Bigger tf.
Strong Supports are 140 - 141 & then
around 111 - 112 (in case of extreme
selling pressure).
Upside targets can be around 160 - 162
initially.
Stoploss for a Swing Trade is 138; & those
who believe in split buying may keep a
Stoploss of 110 on closing basis.
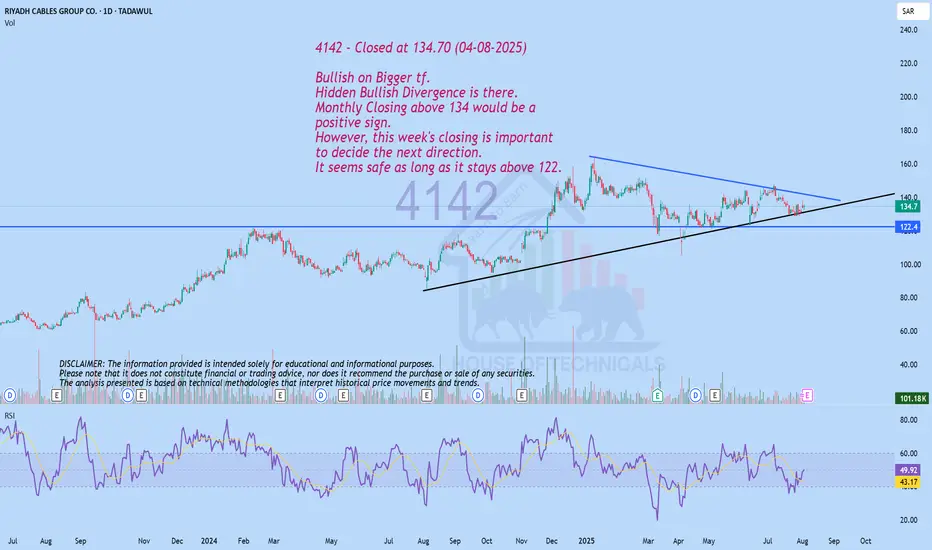
Hidden Bullish Divergence is there.4142 - Closed at 134.70 (04-08-2025)
Bullish on Bigger tf.
Hidden Bullish Divergence is there.
Monthly Closing above 134 would be a
positive sign.
However, this week's closing is important
to decide the next direction.
It seems safe as long as it stays above 122.
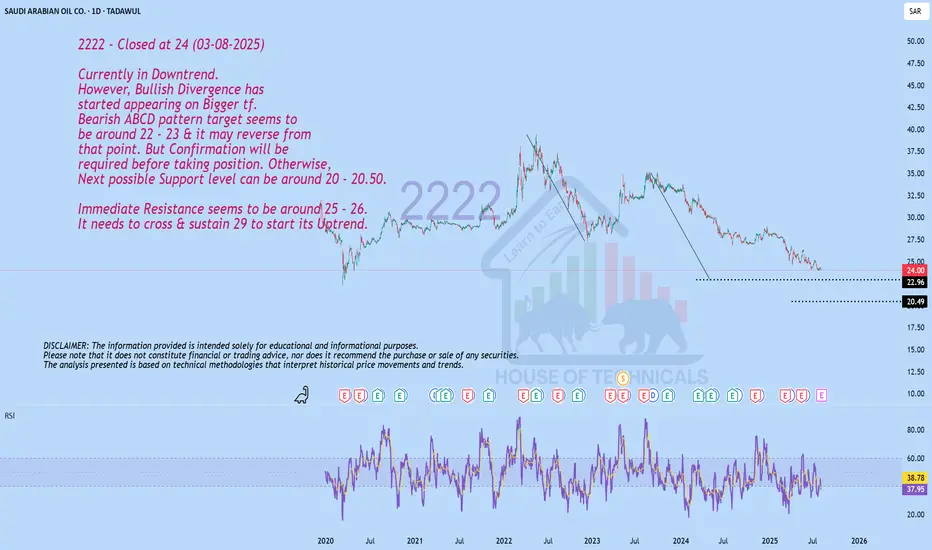
Bullish Divergence appearing!2222 - Closed at 24 (03-08-2025)
Currently in Downtrend.
However, Bullish Divergence has
started appearing on Bigger tf.
Bearish ABCD pattern target seems to
be around 22 - 23 & it may reverse from
that point. But Confirmation will be
required before taking position. Otherwise,
Next possible Support level can be around 20 - 20.50.
Immediate Resistance seems to be around 25 - 26.
It needs to cross & sustain 29 to start its Uptrend.
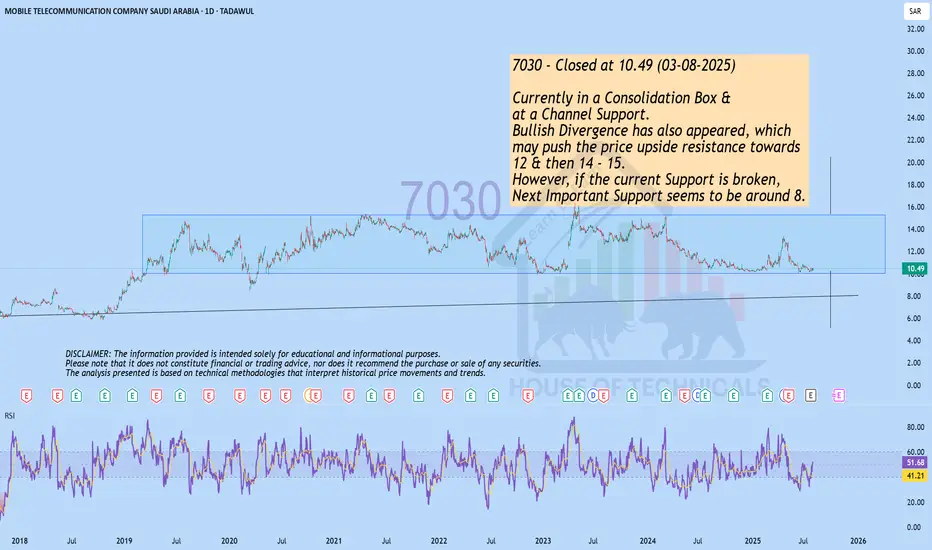
Currently in a Consolidation Box &..7030 - Closed at 10.49 (03-08-2025)
Currently in a Consolidation Box &
at a Channel Support.
Bullish Divergence has also appeared, which
may push the price upside resistance towards
12 & then 14 - 15.
However, if the current Support is broken,
Next Important Support seems to be around 8.
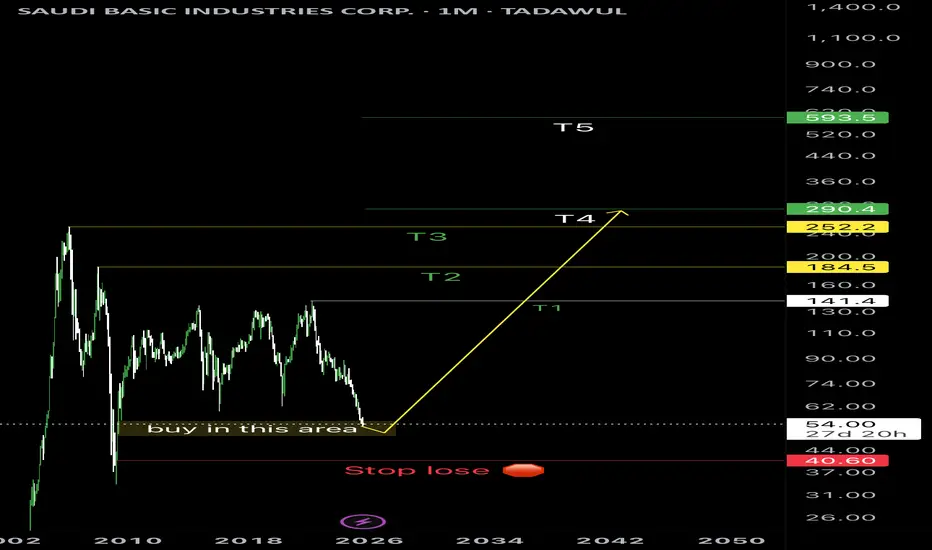
I was waiting this area from long time ago since it was on 140Every thing is clear in the chart, BUT my actual target 🎯 T4
So T1 &T2 & T3 They are just conformation for me for the mine target T4.
T5 is just extra generosity from the market if the economy conditions are good when price reaches T4.
It will be long journey.
Be patient.
Salam
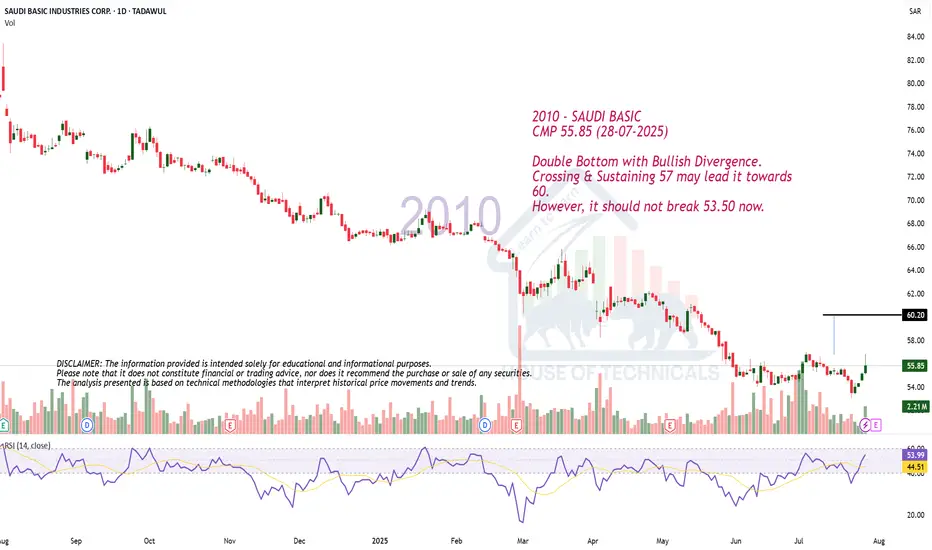
Double Bottom with Bullish Divergence.2010 - SAUDI BASIC
CMP 55.85 (28-07-2025)
Double Bottom with Bullish Divergence.
Crossing & Sustaining 57 may lead it towards
60.
However, it should not break 53.50 now.
AL JOUF CEMENT – BUY PLAN (TADAWUL: 3091)📈 AL JOUF CEMENT – BUY PLAN (TADAWUL: 3091)
✅ Current Status:
Price: 7.09 SAR
Action: Initial entry taken — some shares added to My portfolio.
🔍 Technical Overview:
Sell-side Liquidity Cleared:
Previous lows taken out, triggering liquidity sweep.
Strong reversal suggests potential shift in market sentiment.
Volume Imbalances (Voids):
Bullish targets marked based on unfilled volume gaps:
📍 Target 1: 8.34 SAR (➕17.63%)
📍 Target 2: 10.01 SAR (➕41.19%)
📍 Target 3: 12.93 SAR (➕82.28%)
Trendline Liquidity Above:
Long-term descending trendline can act as a magnet for price, drawing it upward.
Bullish Confirmation:
Price has reacted from a bearish fair value gap.
Clean bullish engulfing and strong volume — suggests start of reversal.
🎯 Buy Strategy Breakdown:
Step Action
✅ Partial buy/entry completed (accumulation started)
📉 Wait for small pullback or bullish continuation to add more
🛡️ Stop Loss: Below recent swing low (around 6.50 SAR)
🚀 Targets: TP1 – 8.34, TP2 – 10.01, TP3 – 12.93
🔁 Re-evaluate plan if price closes below 6.70 with volume

4162 - Technical AnalysisAs I like technical analysis and chart patterns.
I would see that any possible penetration from the down trend may lead to bullish move to future trgets.
NOT an advice to buy or sell
4002 - Technical AnalysisAs seen on the chart ... over a long investment plan.
We have a possible Double Bottom Reversal Pattern
We have a possible Acending Triangle on long term plan

2286 Technical analysis - ONLY 2286 Technical analysis - ONLY showing future targets as indicated on the chart.
This is not an advice to buy or sell.
Continuously in Down Trend but..2082 - ACWA POWER
Closed at 229.60 (23-07-2025)
Continuously in Down Trend but,
bullish divergence appearing.
It may bounce from the current
level (around 225 - 230); however
it needs to Cross & Sustain 274 - 275
to start its Uptrend.
If 275 is Sustained, we may witness 300 - 305.
On the flip side, breaking 220 - 222, may bring
more selling pressure & it may continue its
downtrend.

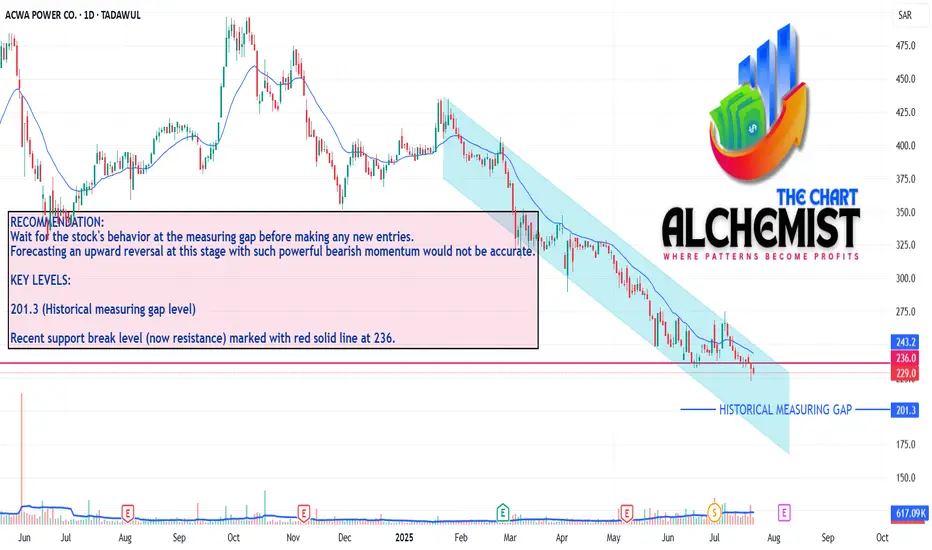
TECHNICAL ANALYSIS: ACWA POWER CO (TADAWUL) 22-07-2025TECHNICAL ANALYSIS: ACWA POWER CO (TADAWUL)
The stock has been in a climatic bearish trend since January this year, trending in a bearish channel marked with light pink colors. The price has continuously been trading under the 20 EMA, and the bearish momentum seems powerful.
The stock has recently broken through a historical major support marked with a red solid line at 236. This broken support is expected to act as a short-term resistance and prohibit any upward movement.
Considering the price action of the last two weeks, we don't expect an immediate upward reversal of the stock before touching the historical measuring gap level located at 201.3.
We expect the stock to touch this level and then consolidate or accumulate in a trading range before showing any signs of upward reversal.
RECOMMENDATION:
Wait for the stock's behavior at the measuring gap before making any new entries. Forecasting an upward reversal at this stage with such powerful bearish momentum would not be accurate.
KEY LEVELS:
201.3 (Historical measuring gap level)
Recent support break level (now resistance) marked with red solid line at 236
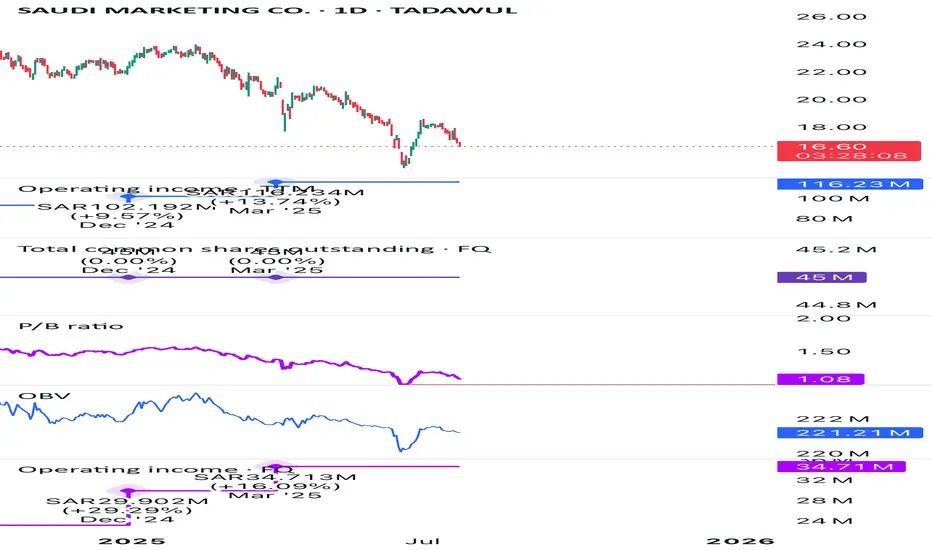
4006 Saudi Marketing is a golden chance Fundamentals say that this stock is a golden chance to make lots of money for value investors. I have no doubts about it. You will almost double your money. 😁
Weekly Buy Plan – 4170 (Tourism Enterprise Co.)📈 Weekly Buy Plan – 4170 (Tourism Enterprise Co.)
Bias: Bullish
Entry: 0.93
Stop Loss: 0.70
Target: 1.33 (2R)
Target Gain: +45%
Reasoning:
✅ Weekly structure break
✅ Bullish FVG respected
✅ Strong impulse move
✅ Pullback to FVG + BOS = High-probability setup
Holding for higher timeframe continuation. Invalidation below 0.70.

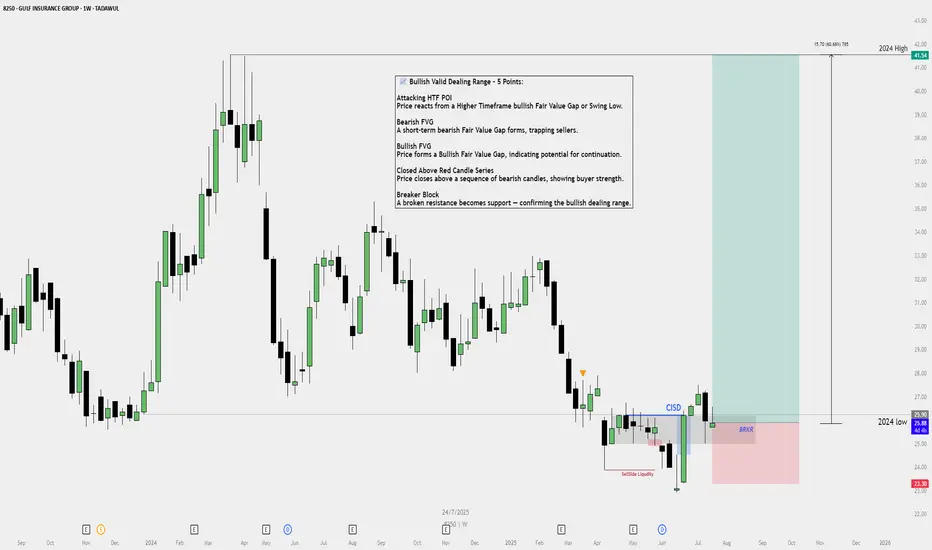
Buy Plan – Gulf Insurance Group (8250)📈 Buy Plan – Gulf Insurance Group (8250)
Bias: Bullish
Timeframe: Weekly
Context: Price reacting from HTF Bullish FVG + Breaker Block
✅ Entry Confirmation – Valid Bullish Dealing Range:
Attacking HTF POI
↳ Price tapped into HTF Bullish Fair Value Gap near 2024 Low.
Bearish FVG Formed
↳ Trap for sellers before reversal.
Bullish FVG Created
↳ Strong bullish impulse confirmed intent.
Closed Above Red Candle Series
↳ Bullish candle closed above multiple bearish candles.
Breaker Block Confirmed
↳ Former resistance now acting as support zone.
🎯 Target:
2024 High at 41.54
~60% potential upside from current price.
🛑 Stop Loss:
Below breaker block: around 23.30
🟩 Risk-Reward:
Reward: ~15.70 points
Risk: ~2.64 points
R:R ≈ 6:1
📌 Plan is active as long as breaker support holds. Monitor for any bearish invalidation signs.
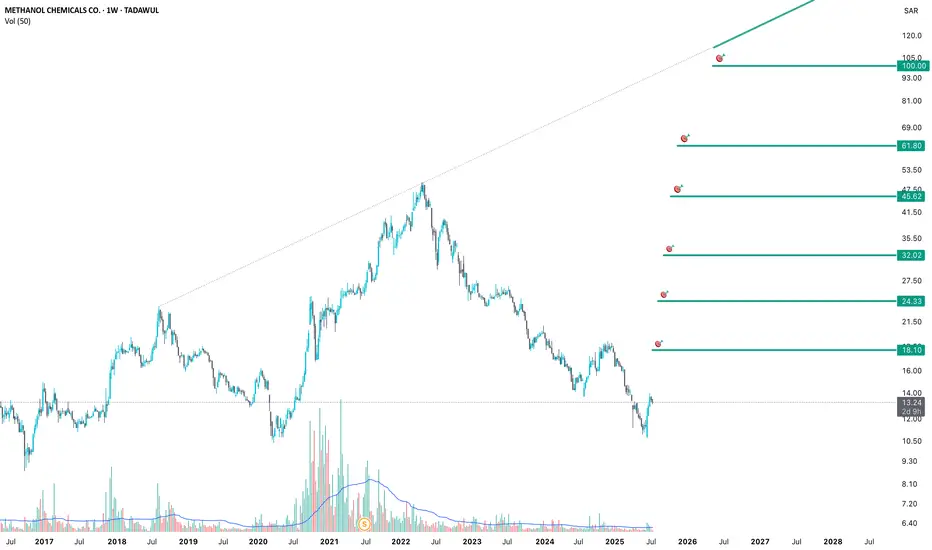
Bullish chart for Methanol 2001Big 5th wave as you can see and now we are making base before trend changes...
I shared one before for the same share but this more clear with just targets
See you there ;)