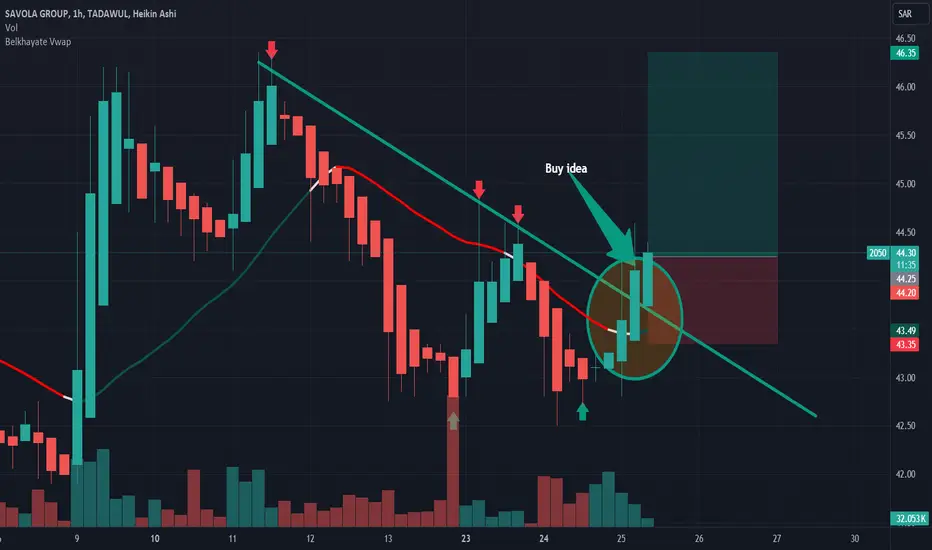
2050: Buy ideaBuy idea on 2050 as you see on the chart because we have the breakout of vwap indicator and also the breakout of the resistance line.
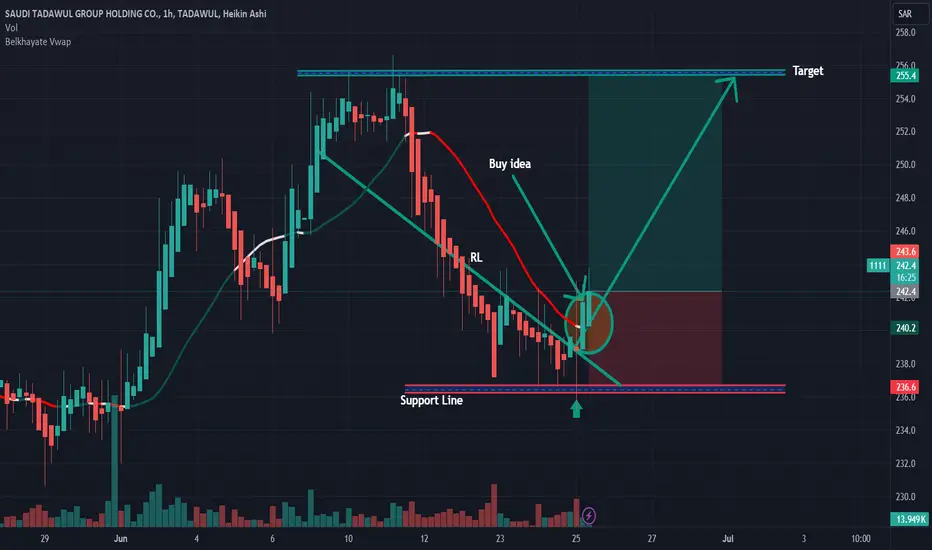
1111: Buy ideaBuy idea on 1111 as you see on the chart because we have the breakout of vwap indicator and the resistance line.
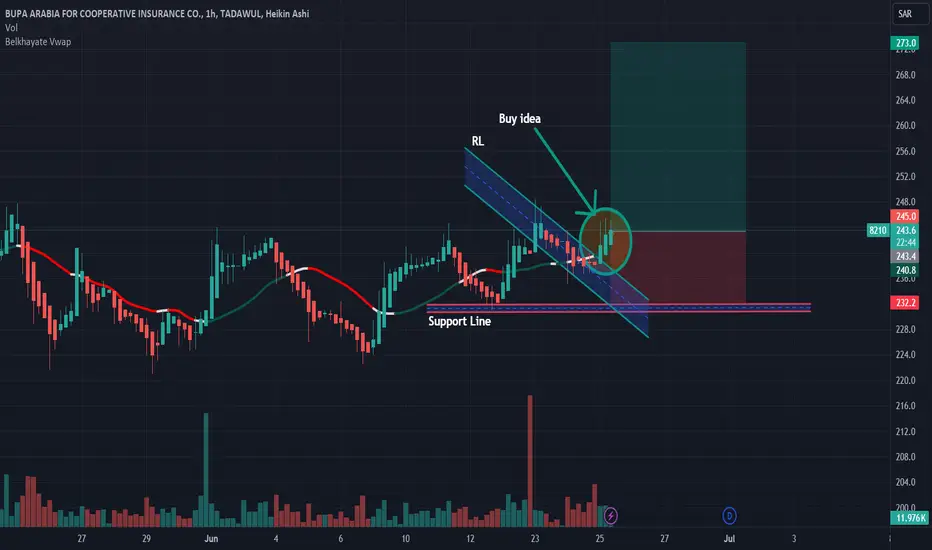
8210: Buy ideaBuy idea on 8210 as you see on the chart because we have the breakout of the vwap indicator and the resistance line.
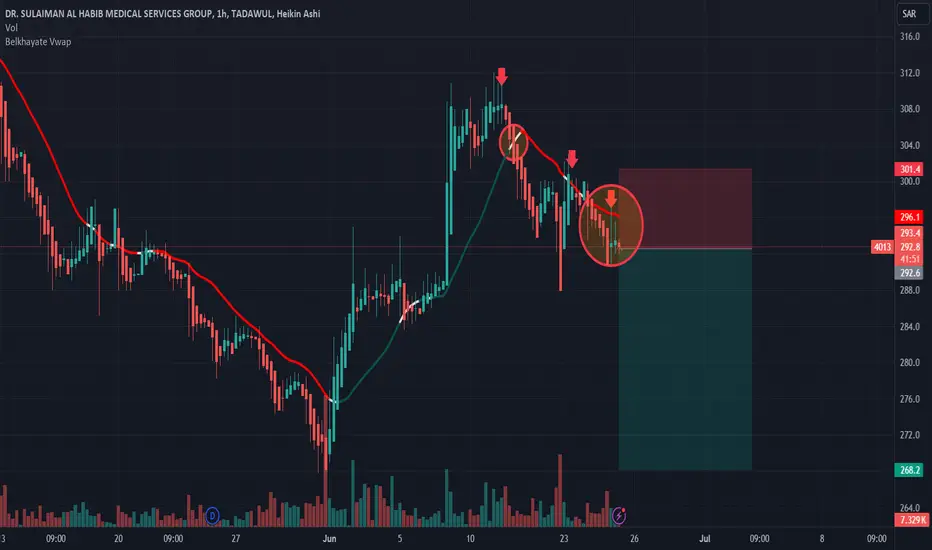
4013: Sell ideaSell idea on 4013 because after the breakout the vwap indicator we have a pullback on the vwap so it's mean that we would have a hight probability to have a downtrend.
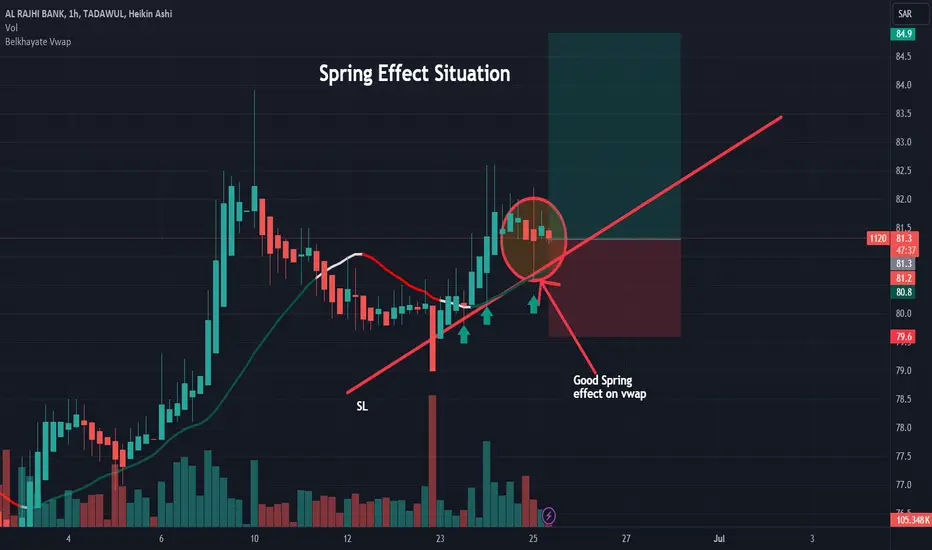
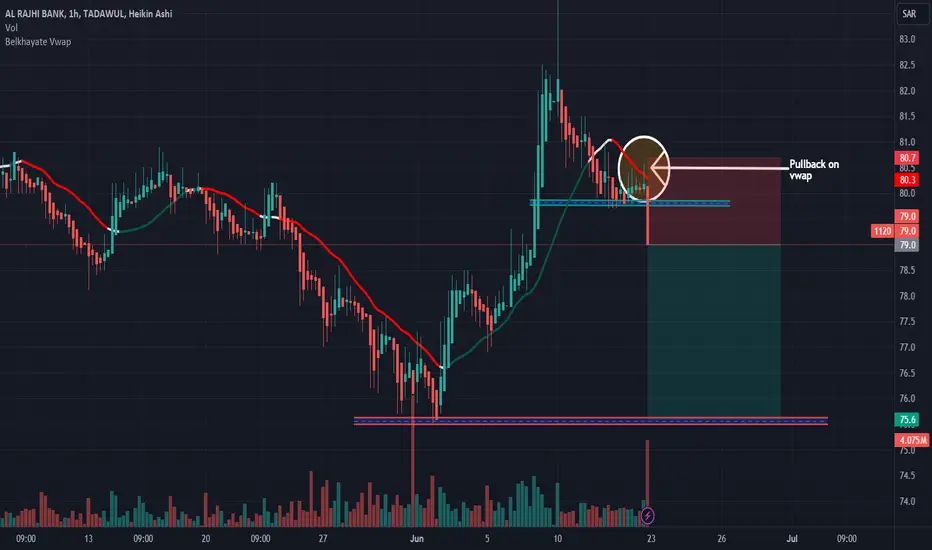
1120: Buy idea: Spring effectOn 1120 we have a very good spring effect on the vwap indicator and this means that we would have a high probability of seeing the market go up.
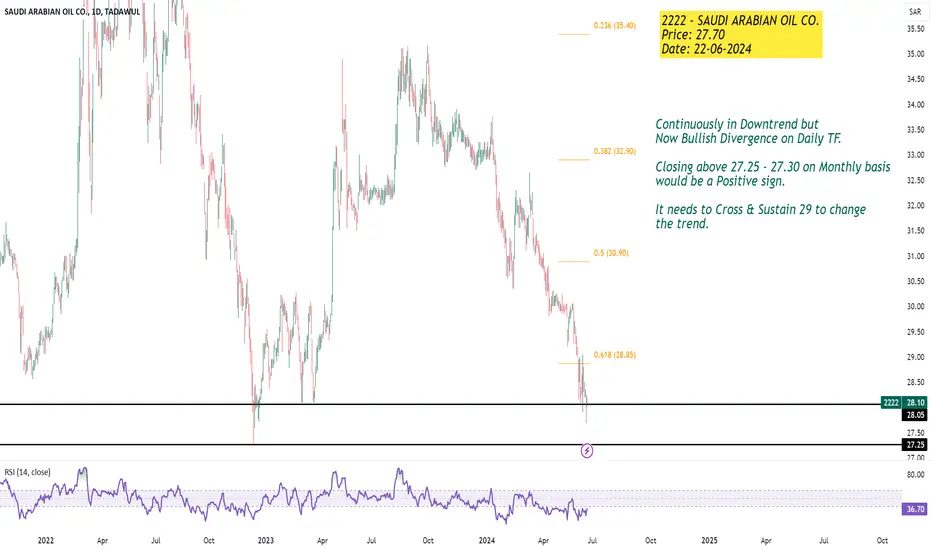
Continuously in Downtrend but Continuously in Downtrend but
Now Bullish Divergence on Daily TF.
Closing above 27.25 - 27.30 on Monthly basis
would be a Positive sign.
It needs to Cross & Sustain 29 to change
the trend.
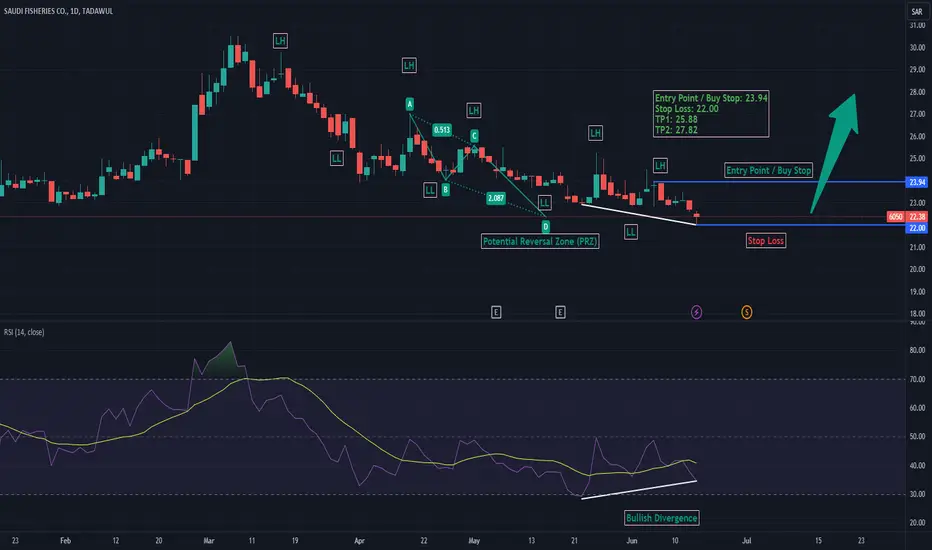
Bullish divergence in Saudi FisheriesA bullish divergence is observed in Saudi Fisheries in a daily timeframe. The current downtrend is expected to reverse into an uptrend due to divergence. Another important factor contributing to this is the price level being close to point D i.e. Potential Reversal Zone (PRZ) of the previously formed ABCD pattern. If the last LH is broken, then it will be a confirmation of the reversal and can be a good opportunity to take a long position.
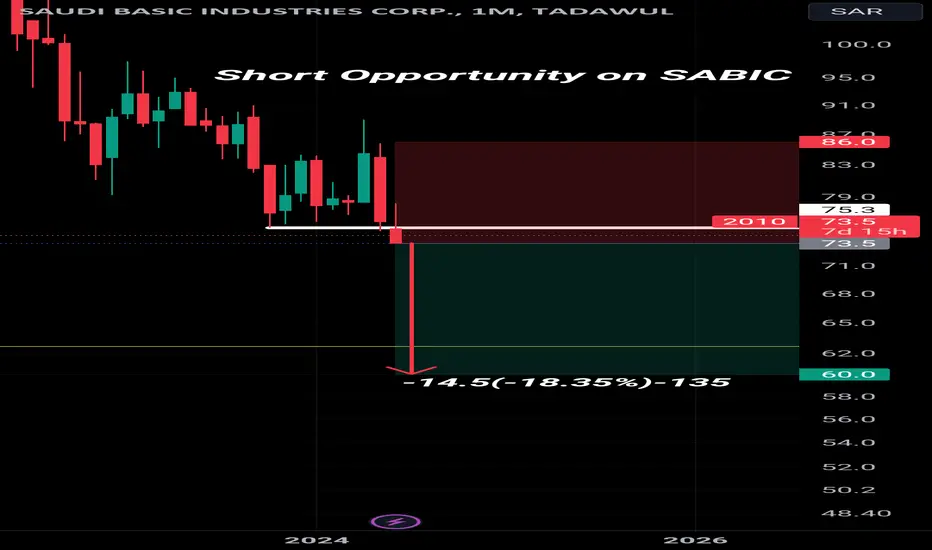
Short Opportunity on SABIC Hello,
We've identified a Fantastic current opportunity to Short SABIC with a high probability According to my analysis on the Monthly chart .
The target is set at 60SAR within a couple of Months.
Ibrouri
1120: Pullback: Sell ideaOn 1120 after the breakout of the vwap indicator as you can see on the chart we have a pullback on the vwap and this means that we have a high probability of seeing the market go down.
2230 - Saudi CHemical CO Short Set upForming Double top pattern with bearish divergence. Have my sell stop / entry at 10.80.
entry - 10.80
stoploss - 11.32
tp-1 - 10.28
tp-2 9.77
#Trading #Technical #Crypto #Stocks #commodities

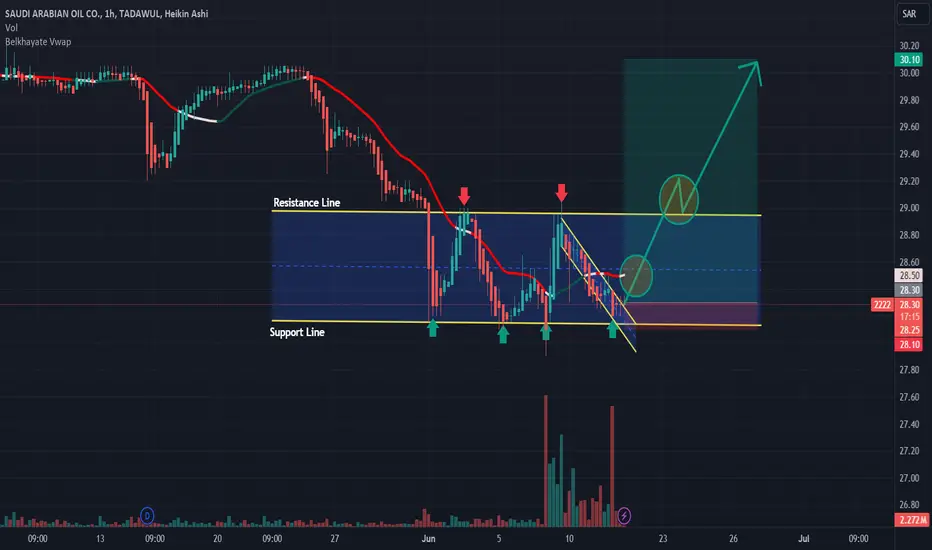
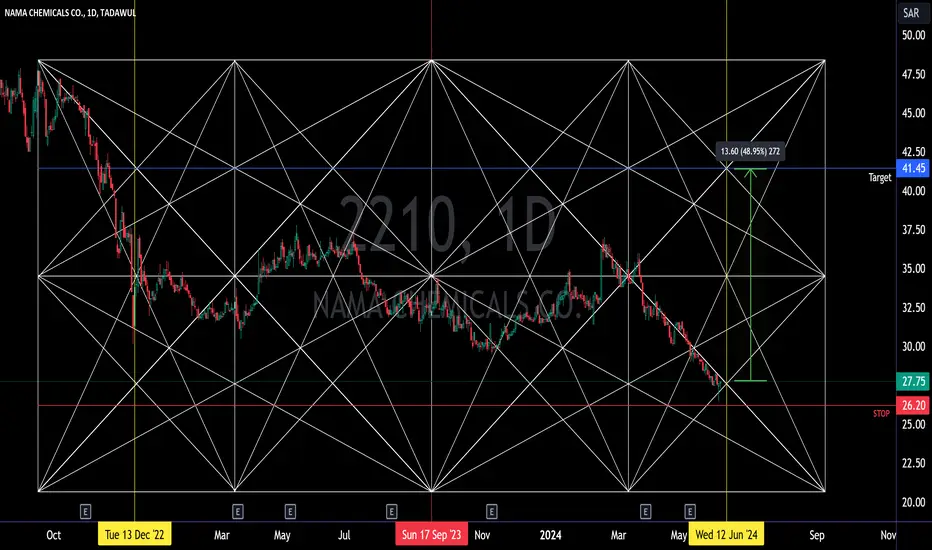
2222: Buy ideaWe would have a high probability of having an uptrend if and only if the vwap indicator as well as the resistance line is broken forcefully by a large green candle and followed by a large green volume..
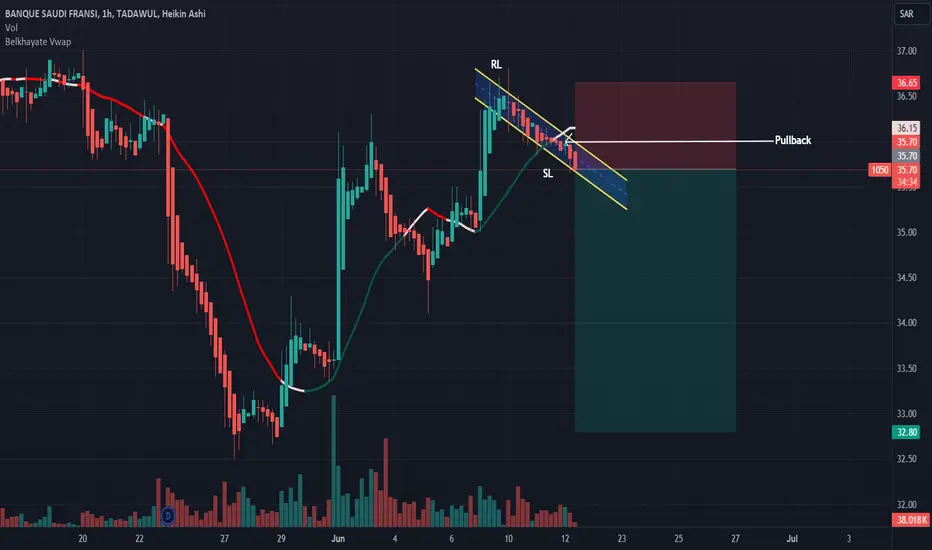
1050: Sell ideaOn 1050 we have a pullback on the vwap indicator. This means that we would have a high probability of having a bearish trend.
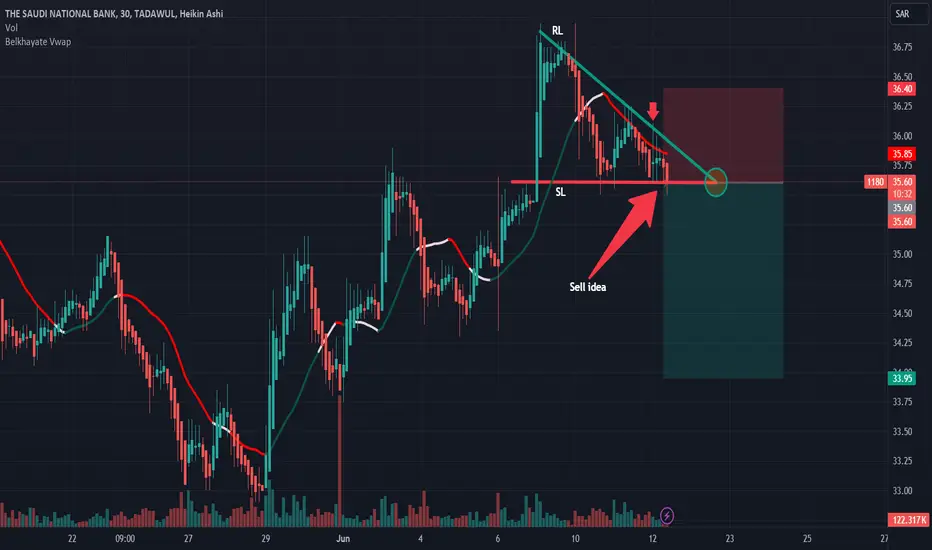
1180: Sell ideaWe would have a high probability of having a downtrend however if the support line is broken forcefully by a large red candle accompanied by large red volume.
2160 - in progress triangle waveIt is expected that it has finished the c wave and is in the process of targeting the d wave from a triangle...
d-wave is expected to be targeted at 28-29 zones..

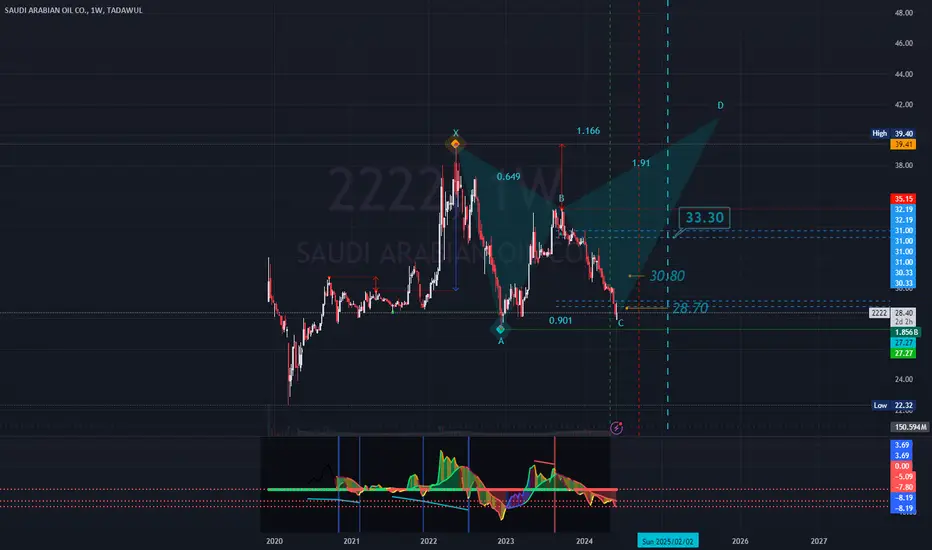
The big move on February 2, 2025 for Saudi Aramco 2222By studying the chart of the Aramco stock, the following can be observed:
A green timeline was previously drawn on May 12, and there was an expectation of a reversal at that time.
However, the secondary was put forward, which formed pressure and a qualitative test on the stock, which led to the postponement of the reversal to the accumulation area until September 22.
There is an expectation of breaking the resistance level at 33 Saudi riyals with strong momentum by February 2, 2025, and God knows best.
The chart shows sharp fluctuations in the stock price over the past months, with a general upward trend in the long term.
The technical indicators at the bottom of the chart indicate the presence of positive signals that support the possibility of the continuation of the upward trend of the stock in the future.
In general, it seems that the Aramco stock is currently going through a stage of fluctuation and accumulation, with expectations of a strong bullish breakout during the next year, God willing. But of course, these remain mere analyses and interpretations, and financial markets are characterized by dynamism and unpredictability.
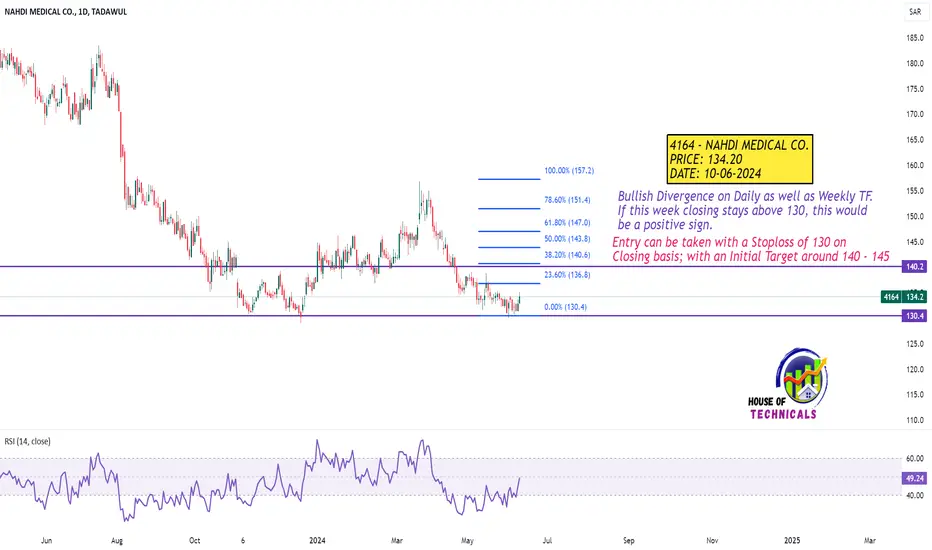
longBullish Divergence on Daily as well as Weekly TF.
If this week closing stays above 130, this would
be a positive sign.
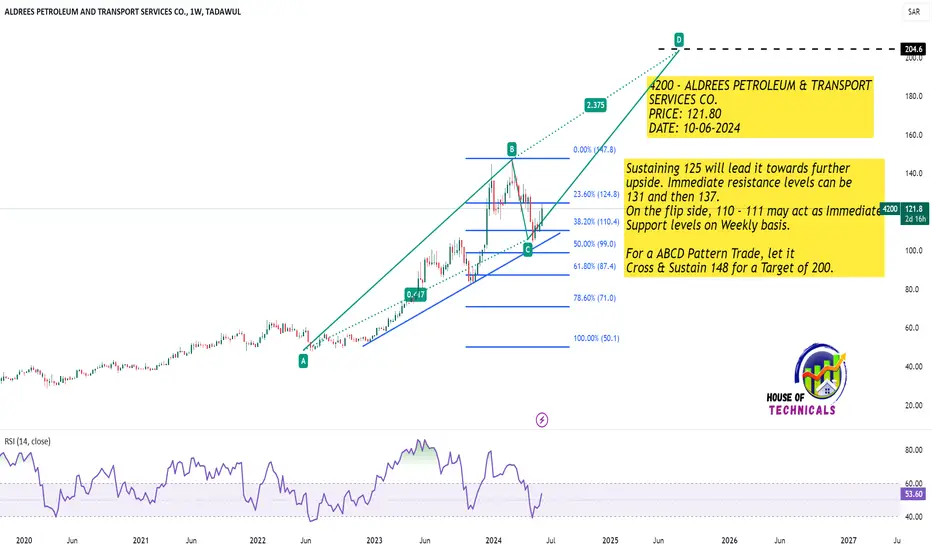
Sustaining 125 will lead it towards further upsideSustaining 125 will lead it towards further
upside. Immediate resistance levels can be
131 and then 137.
On the flip side, 110 - 111 may act as Immediate
Support levels on Weekly basis.
For a ABCD Pattern Trade, let it
Cross & Sustain 148 for a Target of 200.
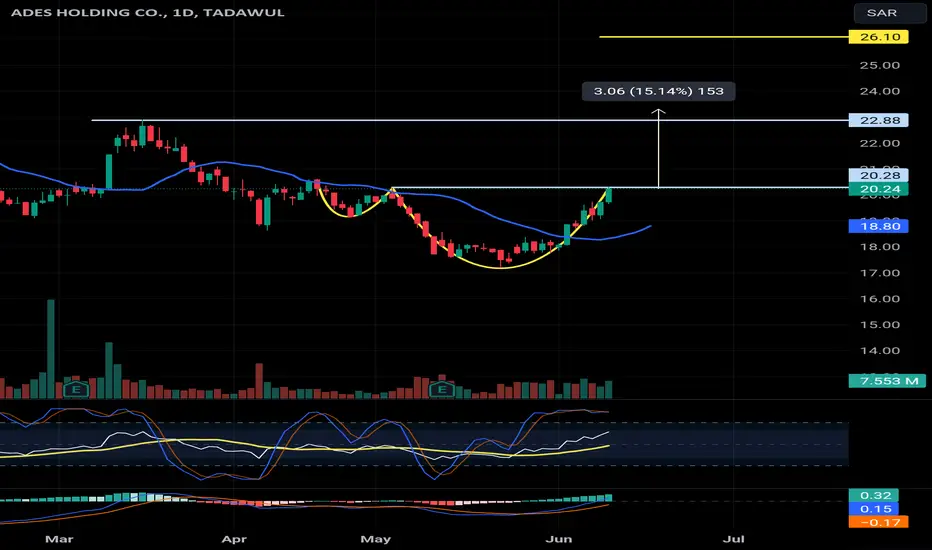
ADES near breakout ADES near breakout after completing a cup and handle pattern, for observation..... Breaking 20.28 is very positive
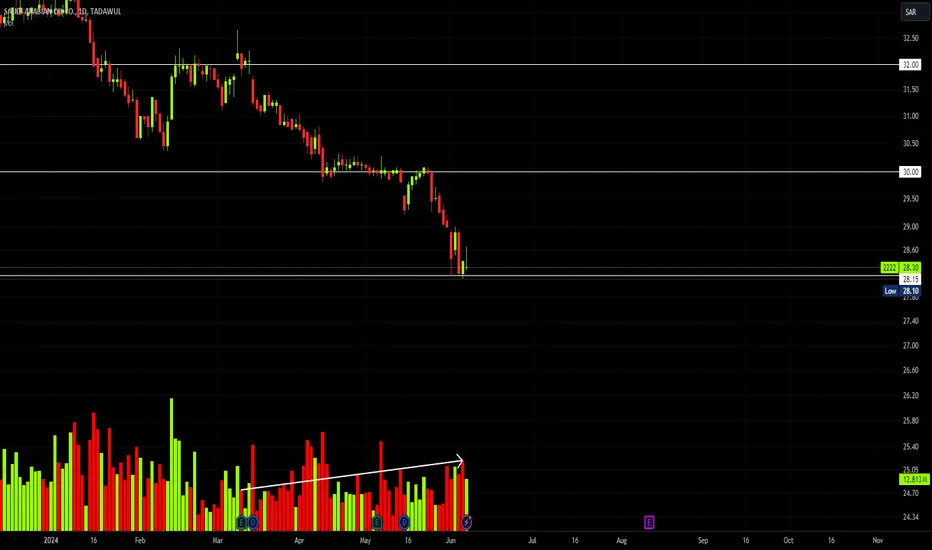
DON'T BUY 2222I got questions from people if they can buy 2222 or no,
My answer is don't buy it, and if you have any position you're holding just close it since the stock is still pushing downwards and there's no indication now to buy.
You can notice on the volume that the sellin power is still high so there's no point of buying now.
For further question or suggestions for stocks to buy, don't hesitate to ask!
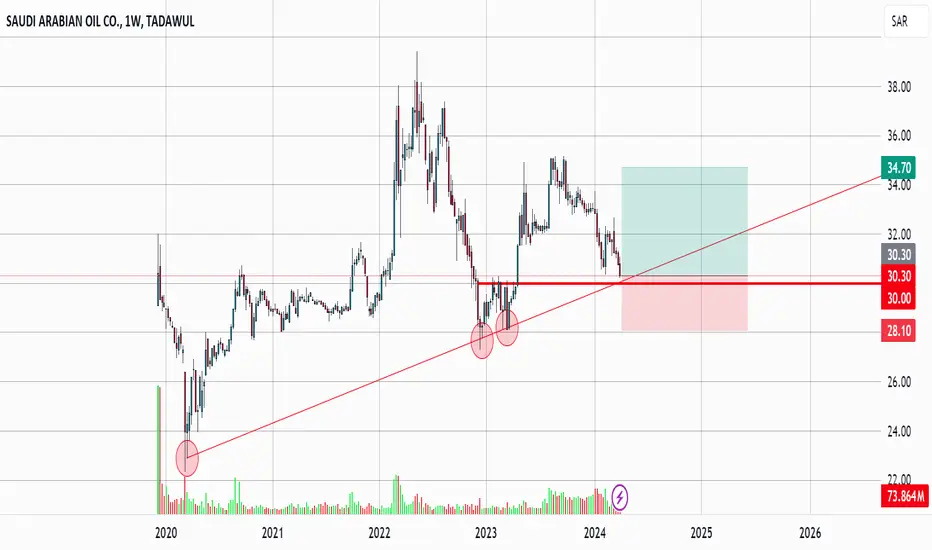
SAUDI ARABIAN OIL CO.Long trade with positive ratio.
if you have any questions do not hesitate to contact me.
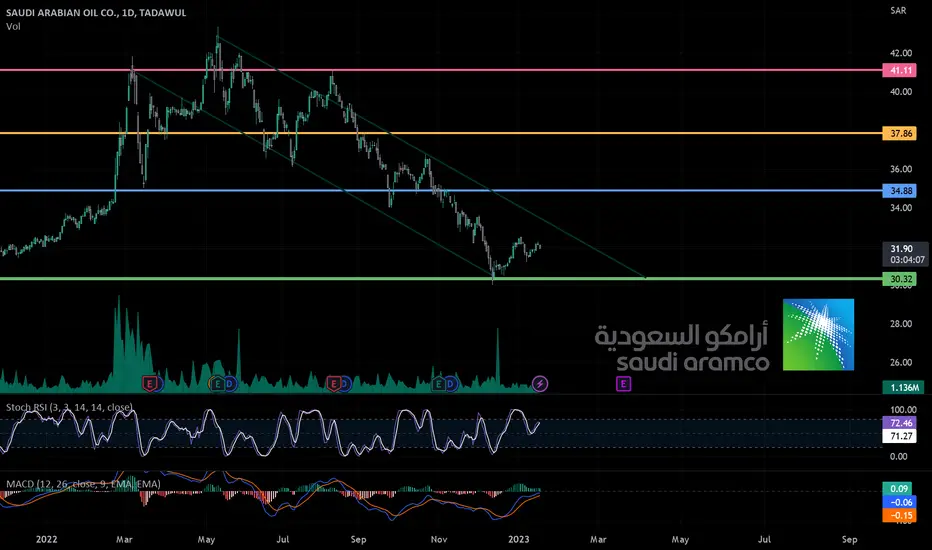
Saudi Arabian Oil Co / AramcoMarhaba
Saudi Arabia stocks were lower after the close on Sunday, as losses in the Cement, Hotels & Tourism and Energy & Utilities sectors led shares lower. at the close in Saudi Arabia, the Tadawul All Share lost 0.17%.the best performers of the session on the Tadawul All Share were Wafrah for Industry and Development Company SJSC (TADAWUL:2100), which rose 5.74% or 1.75 points to trade at 32.25 at the close. Meanwhile Aramco couldn't break 32.40 now heading to lower level 31.50,as you see we still in down trend, the biggest support level for Aramco is 30$ and I think its one of the good buy zones too
Crude oil for March delivery was unchanged 0.00% or 0.00 to $80.11 a barrel. Elsewhere in commodities trading, Brent oil for delivery in March rose 1.74% or 1.46 to hit $85.49 a barrel, while the February Gold Futures contract rose 1.29% or 24.55 to trade at $1,923.35 a troy ounce.
Analyzing Current Downtrend and Strategic Trading Opportunity.Current Market Conditions
Saudi Aramco’s stock (2222.SR) has recently been showing a clear downward trend, closing at 28.20 SAR with a drop of 2.76%. This analysis aims to provide a comprehensive overview of the current technical indicators, patterns, and price action to forecast potential price movements and suggest strategic trading positions.
Candlestick Patterns and Price Action
The weekly candlestick chart reveals persistent bearish momentum. The latest candlestick pattern is a significant red candle, indicating strong selling pressure. The stock has been consistently making lower highs and lower lows, a clear indicator of a bearish trend.
Key Technical Indicators
1. Relative Strength Index (RSI): The RSI is at 23.04, which is deep in the oversold territory. This suggests that the stock is currently under heavy selling pressure, but it could also indicate a potential for a short-term rebound if buyers step in.
2. Stochastic Oscillator: The %K and %D lines are both below 20, further confirming the oversold condition. However, the lines have not yet crossed, suggesting that the bearish momentum may continue for a bit longer.
3. MACD (Moving Average Convergence Divergence): The MACD line is below the signal line, and both are in the negative territory, indicating that the bearish trend is well-established and likely to continue.
4. Moving Averages: All major moving averages (10, 20, 50, 100, 200) are indicating a sell. The stock price is below these moving averages, which act as resistance levels in the current downtrend.
5. Ichimoku Cloud: The price is well below the Ichimoku Cloud, and both the Conversion Line and Base Line are bearish, with the Leading Span A below Leading Span B, reinforcing the bearish outlook.
6. Awesome Oscillator and Momentum: Both indicators are showing negative values, indicating bearish momentum.
Market Sentiment and News
Recent news surrounding Saudi Aramco has been mixed, with market reactions to global oil price fluctuations and geopolitical tensions affecting investor sentiment. The bearish technical indicators align with broader market concerns, reflecting the overall negative sentiment.
Price Targets and Trading Strategy
Given the current technical setup, the stock appears to be in a strong downtrend. Here are the speculative price targets and suggested trading strategies:
Short Position: Enter a short position if the stock breaks below 28.00 SAR with a target price of 25.00 SAR, setting a stop loss at 29.00 SAR to manage risk.
Long Position: Consider a long position only if the stock shows a clear reversal signal, such as a bullish divergence in the RSI or a strong bullish candlestick pattern. Enter above 29.50 SAR with a target price of 32.00 SAR, and a tight stop loss at 28.00 SAR.
Conclusion
Based on the current analysis, Saudi Aramco’s stock is likely to continue its bearish trend in the short term. Traders should be cautious and look for confirmation signals before entering any positions. The suggested short and long strategies provide a balanced approach to capitalize on the stock’s movements while managing risk effectively. As always, stay updated with the latest news and market developments to adjust your trading strategy accordingly.
