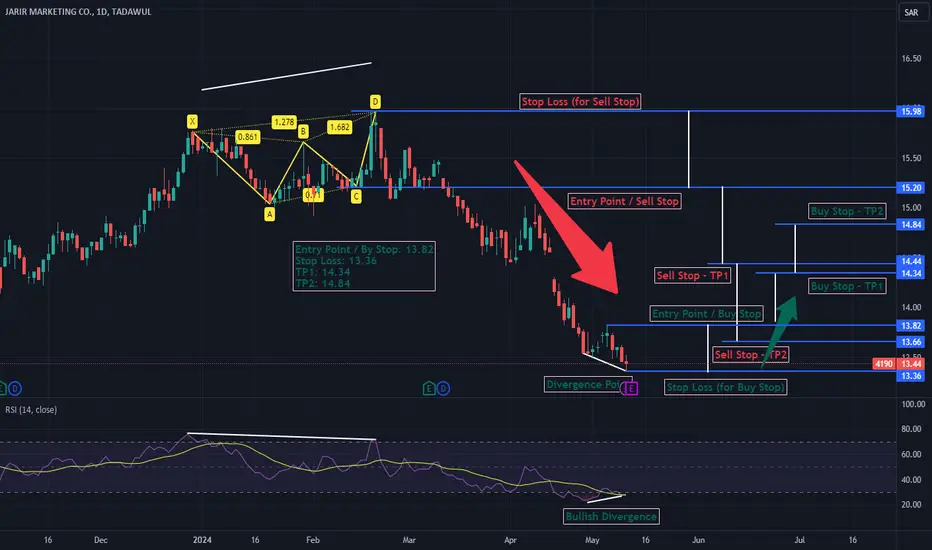
Bullish Divergence in JARIR after Bearish Butterfly patternBullish Divergence observed in JARIR after Bearish Butterfly (bearish harmonic reversal) pattern completion. As expected the Bearish Butterfly pattern reversed from point D (potential reversal zone) and created a bearish trend on a daily time frame. A bullish divergence is now observed and the trend will likely reverse and a bullish trend will likely start. If the bullish trend is confirmed, this can be a good point to take long positions.
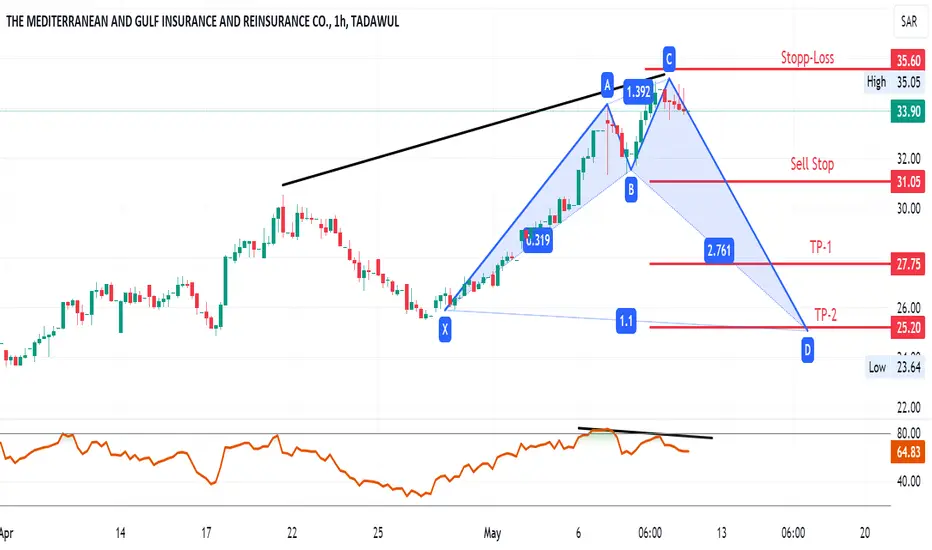
8030THE MEDITERRANEAN AND GULF INSURANCE AND REINSURANCE CO.The bullish butterfly is another harmonic pattern in technical analysis, similar to the bearish bat pattern but indicating a potential bullish reversal instead. Like other harmonic patterns, it relies on Fibonacci ratios to identify potential entry and exit points in the market.
Here are the key features of a bullish butterfly pattern:
1. **Initial Move (XA)**: This is the first leg of the pattern, representing the initial impulse in price.
2. **Retracement (AB)**: Following the XA move, there is a retracement in price, typically falling within the range of 0.382 to 0.786 Fibonacci retracement of XA.
3. **Extension (BC)**: After the AB retracement, the price extends in the opposite direction, forming the BC leg. This move usually extends beyond the XA move, ranging from 1.618 to 2.618 Fibonacci extension of AB.
4. **Final Move (CD)**: Finally, the price retraces a significant portion of the BC move, forming the CD leg. This retracement typically ranges from 0.382 to 0.886 Fibonacci retracement of BC.
The bullish butterfly pattern suggests a potential reversal to the upside. Traders may look for buying opportunities when they identify this pattern, anticipating that the price will reverse its previous downtrend and start moving upwards.
As with any trading pattern, it's crucial to combine the bullish butterfly pattern with other technical analysis tools and risk management techniques to improve the probability of success in trading decisions.
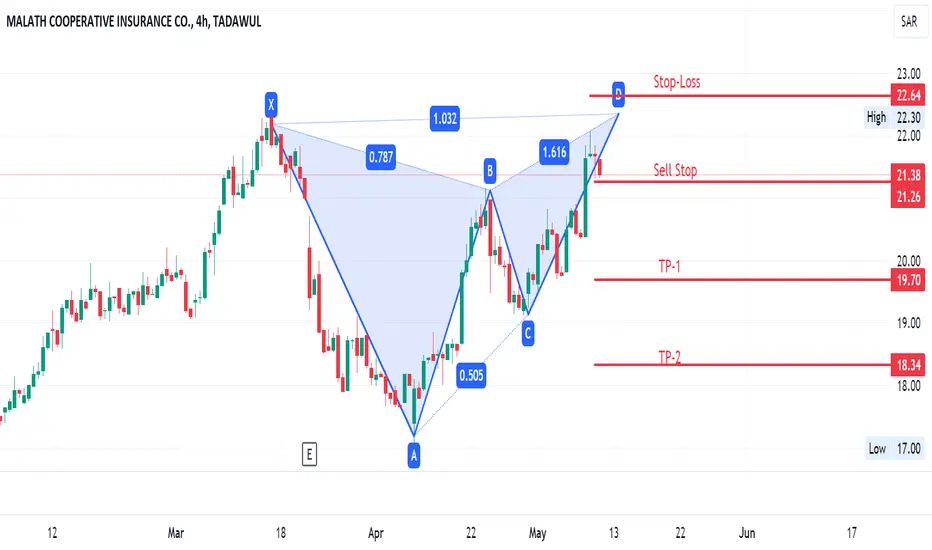
8020MALATH COOPERATIVE INSURANCE CO.In financial trading, a "bearish bat" is a specific pattern identified within the field of technical analysis. It's considered a harmonic pattern, which means it's based on geometric price patterns found in the market.
The bearish bat pattern consists of four price moves, which form specific Fibonacci ratios. These moves are labeled XA, AB, BC, and CD. The pattern suggests potential bearish reversal opportunities. The main characteristics of a bearish bat pattern include:
1. **Initial Move (XA)**: This is the first move in the pattern, usually representing the initial impulse in price.
2. **Retracement (AB)**: After the initial move, the price retraces a certain percentage of the XA move. This retracement typically falls within the range of 0.382 to 0.50 Fibonacci retracement of XA.
3. **Extension (BC)**: Following the AB retracement, the price makes a move in the opposite direction, known as BC. This move typically extends beyond the XA move, usually by a ratio of 0.382 to 0.886 Fibonacci extension of AB.
4. **Final Move (CD)**: Finally, the price makes another move against the BC move, forming the CD leg. This move usually retraces a significant portion of the BC move, often ranging from 0.382 to 0.886 Fibonacci retracement of BC.
When all these moves align according to specific Fibonacci ratios, traders may identify a potential bearish reversal opportunity. However, as with any technical analysis pattern, it's essential to combine it with other forms of analysis and risk management techniques before making trading decisions.
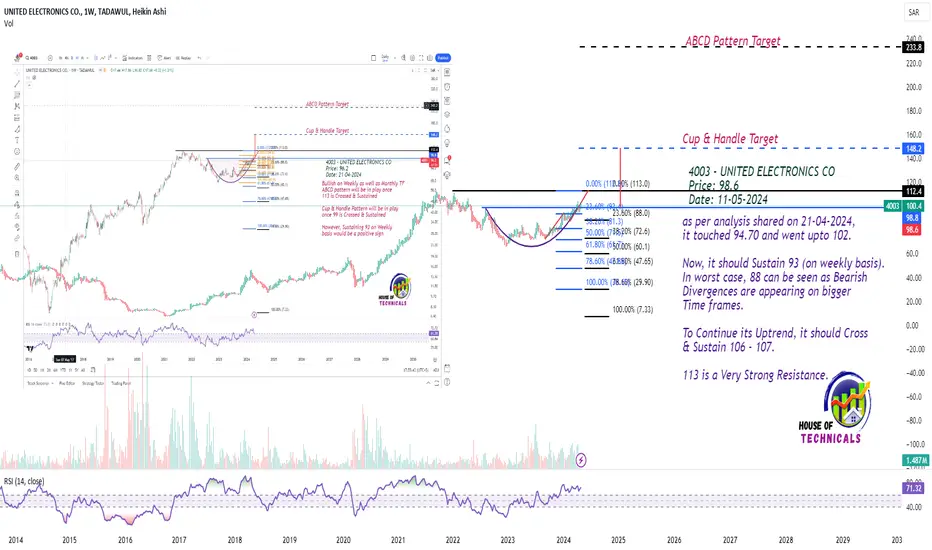
Trade Wiselyas per analysis shared on 21-04-2024,
it touched 94.70 and went upto 102.
Now, it should Sustain 93 (on weekly basis).
In worst case, 88 can be seen as Bearish
Divergences are appearing on bigger
Time frames.
To Continue its Uptrend, it should Cross
& Sustain 106 - 107.
113 is a Very Strong Resistance.
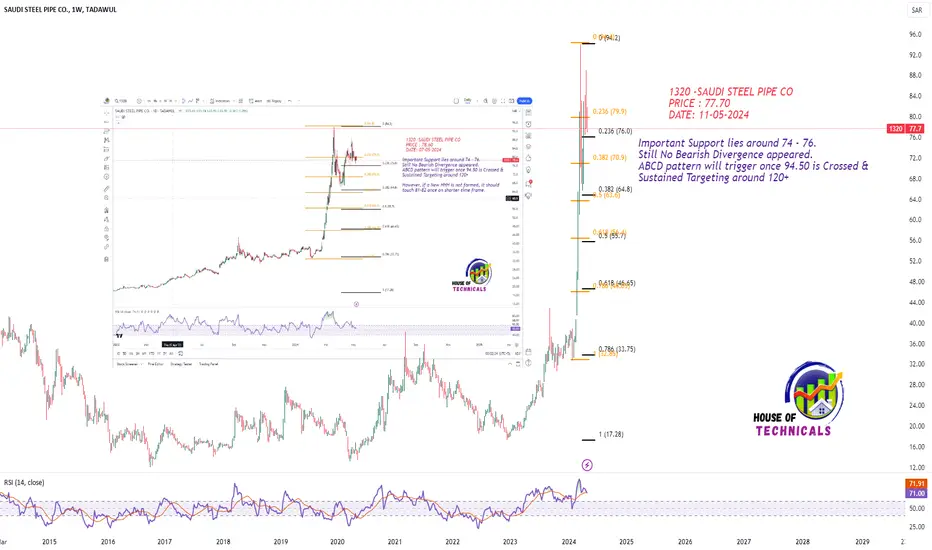
Now again at 77.70 🙃
as mentioned if HH is not formed, even then it would touch 81-82 once.
on 08-05-2024, it made a High of 81.90
Now again at 77.70 🙃
Current Stance: We may look around 74 - 76 if it takes support...
4080The price action is currently near the test of ascending trend line after got rejection from 15.52 level where bearish divergence with RSI is observed and closes at 12.40 in the last trading session. Upon sustaining the trend line support price can pull back towards its resistance levels of 13.50. If it breaks down ward then further bearish momentum can be seen.

Aseer Possible Scenario Aseer stock may retrace a little to complete w-4 before continuing its impulse wave. 12.42 is the upper price channel and also a confirmation. It either penetrates right away or retrace to the mid channel 11.36 but not more than that otherwise it cancels the whole analysis.

United Electronics Possible TargetsThe stock has retraced to complete W-4 at Fib 0.618 golden ratio. It is on the way to the fifth wave. Watch out for the upcoming resistance. Wave -5 could be a failure so when getting on the target just before that, it may some aggressive selling.
Everything I present here is for educational purposes, and it is not a recommendation for selling or buying.

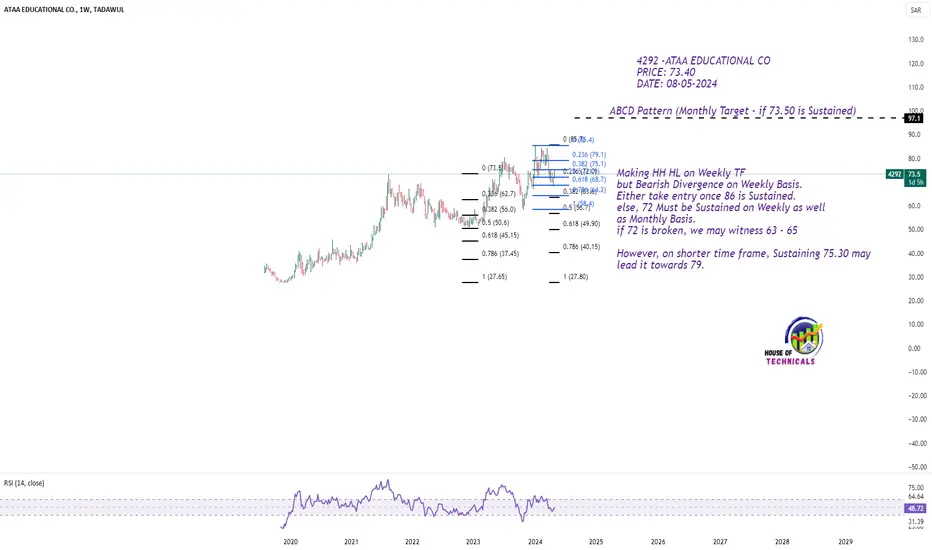
Making HH HL on Weekly TFMaking HH HL on Weekly TF
but Bearish Divergence on Weekly Basis.
Either take entry once 86 is Sustained.
else, 72 Must be Sustained on Weekly as well
as Monthly Basis.
if 72 is broken, we may witness 63 - 65
However, on shorter time frame, Sustaining 75.30 may
lead it towards 79.
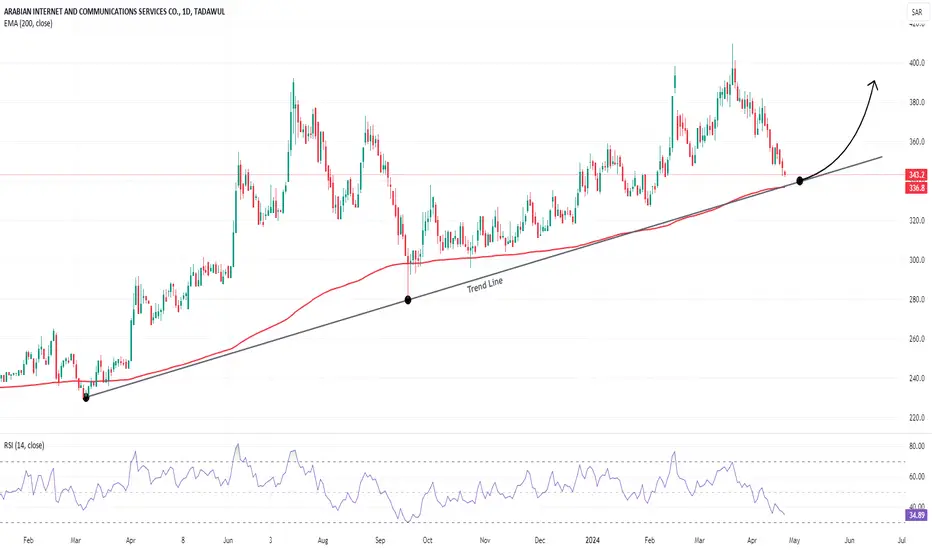
7202 | Arabian Internet And Communications Services CompanyArabian Internet And Communications Services Company displays a promising bullish pattern followed by ascending trend line. Moreover, the price is testing 200 EMA around 340 which can be consider for a long position, while setting stop loss orders below the bottom of support around 330. Initial target define around 360, upon sustaining this level secondary target would be 390.
Bullish on Weekly TFLevels shared on 25-03-2024 played well.
256 was broken & it reversed from 232.
ABCD Pattern will triggers 300 is Crossed.
Crossing & Sustaining 300 will lead it
towards 350 then 400
On the flip side, Should Not Break 252 on
Monthly Basis

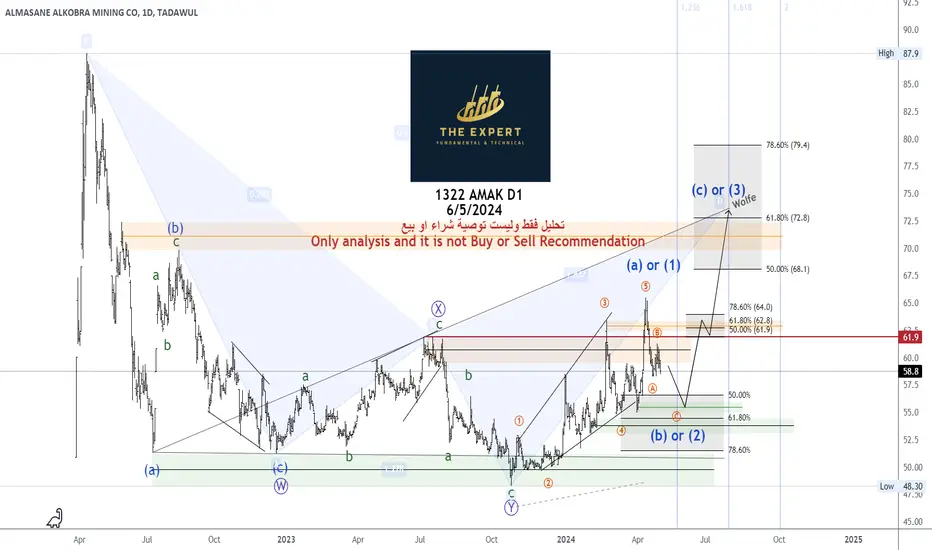
1322 AMAK D1 - 6/5/2024 (TASI Market)1322 AMAK D1 - 6/5/2024 (TASI Market):
Elliott Wave
Trend Analysis
Harmonic
Regards,
Making HH HL on Daily TF
Immediate Resistance is 4.25 and then 4.41
Breaking & Sustaining this level will lead it towards 5.30
initially


Americana to around 4The stock is preparing for a strong move up to above 4.. absorption completed .

ADES: Diamond pattern Breakout Diamond pattern with intense low volume trading just recently made a breakout

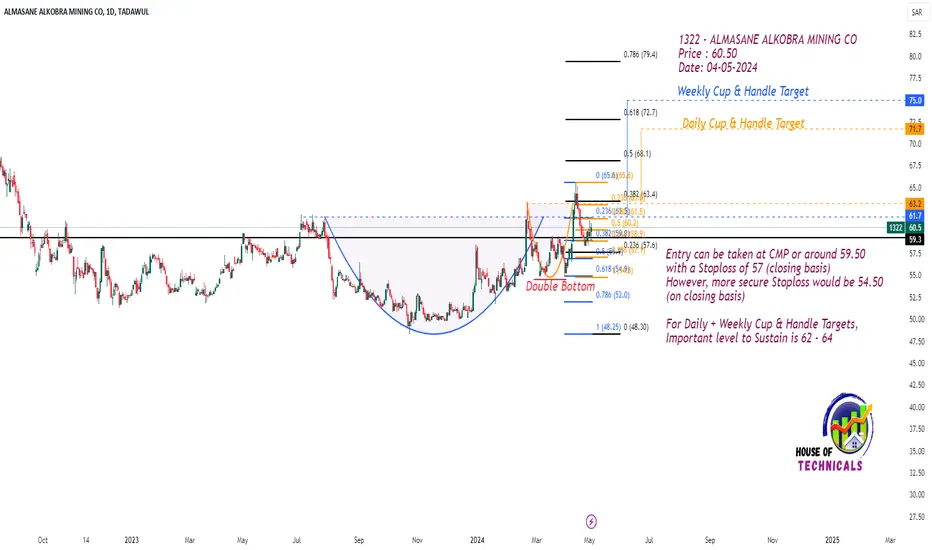
Cup & Handle FormationsEntry can be taken at CMP or around 59.50
with a Stoploss of 57 (closing basis)
However, more secure Stoploss would be 54.50
(on closing basis)
For Daily + Weekly Cup & Handle Targets,
Important level to Sustain is 62 - 64
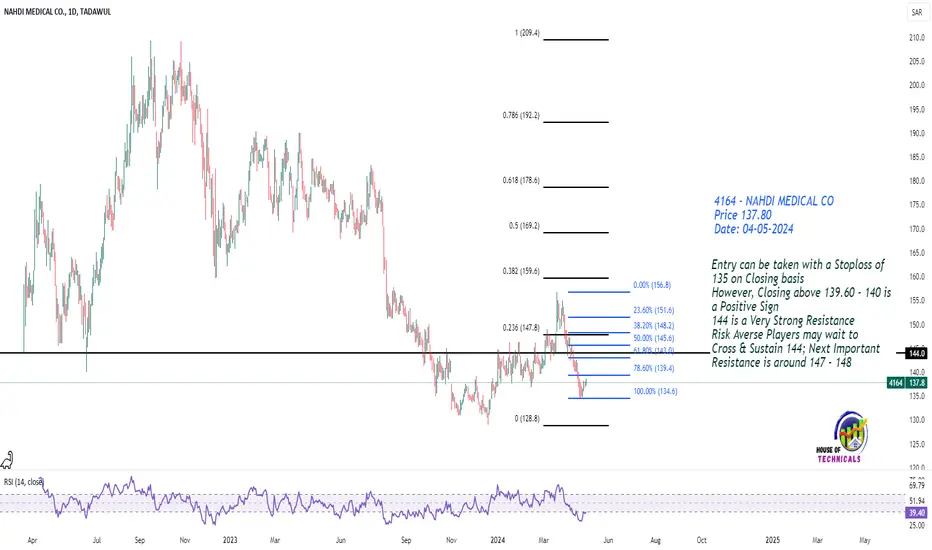
Long
Entry can be taken with a Stoploss of
135 on Closing basis
However, Closing above 139.60 - 140 is
a Positive Sign
144 is a Very Strong Resistance
Risk Averse Players may wait to
Cross & Sustain 144; Next Important
Resistance is around 147 - 148
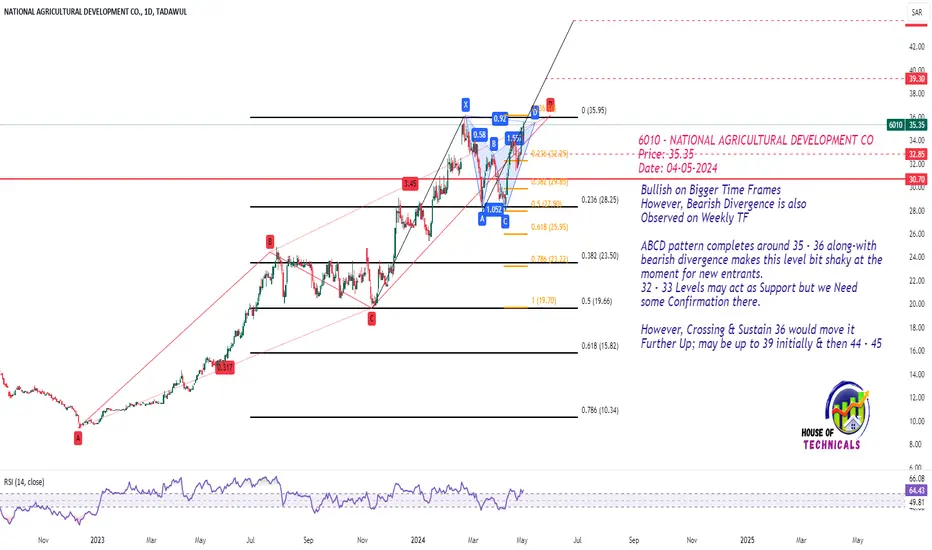
Bullish on Bigger Time Frames
However, Bearish Divergence is also
Observed on Weekly TF
ABCD pattern completes around 35 - 36 along-with
bearish divergence makes this level bit shaky at the
moment for new entrants.
32 - 33 Levels may act as Support but we Need
some Confirmation there.
However, Crossing & Sustain 36 would move it
Further Up; may be up to 39 initially & then 44 - 45
Bullish Divergence on Daily TF
133 is an Important Level that should be Crossed
& Sustained for further upside
Initial Targets can be 144 then 158
& if 158 is Sustained, we may witness
On the flip side, 129 then 122 - 123 are
Important Supports that seems to be respected

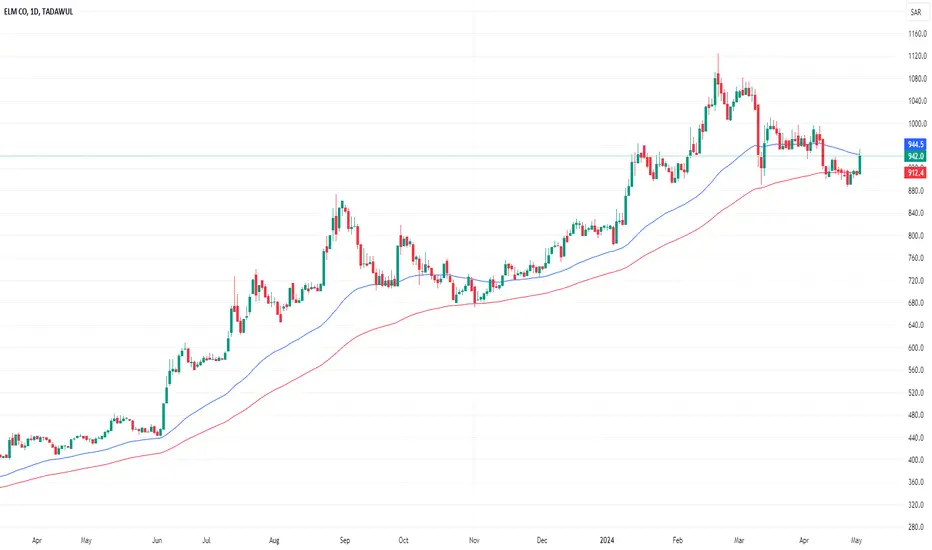
7203The price action is in uptrend making higher highs and higher lows and currently pulls back from 100 day EMA and currently testing 50 day EMA and closes at 942 in the last trading session. Initial resistance lies around 1,000 and secondary resistance lies around 1,120, upon breaching these levels the stock has potential to make more higher highs. Use stop loss below 910 to manage risk.
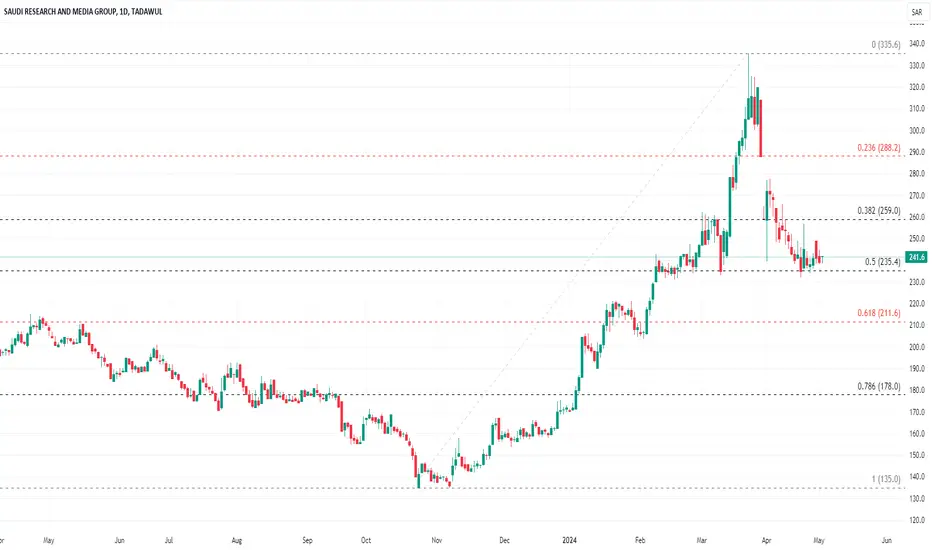
4210Saudi Research and Media Group displays a promising bullish reversal pattern, currently its sustaining its support level of 235 which is 50% Fibonacci retracement. Our plan entails accumulating the stock around 235, while setting stop loss orders if the support breaks to manage risk effectively. Initial resistance lies around 259 and secondary resistance lies around 288, upon breaching these levels the stock has potential to test previous high of 335.
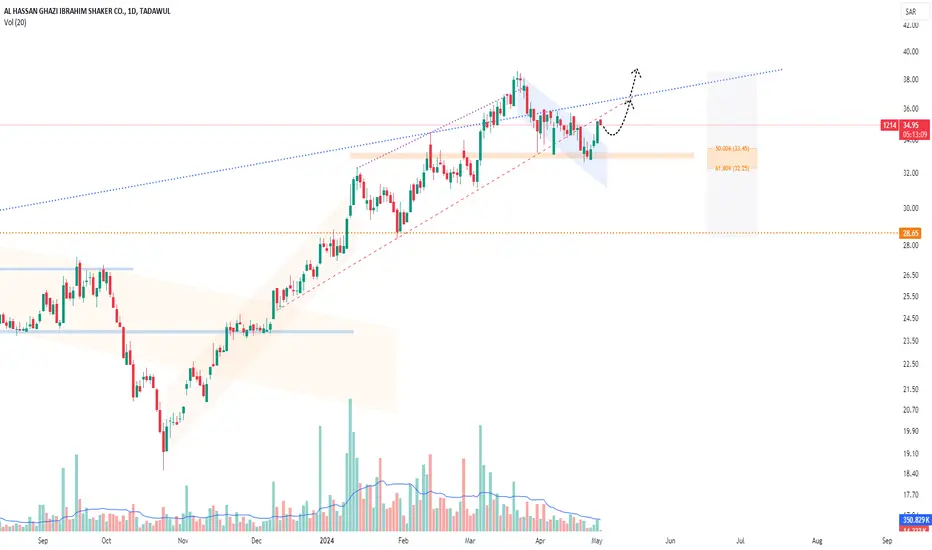
1214: Breakout after CorrectionPrice took a correction and is taking support from golden pocket
Breakout of Descending parallel channel is observed
Retest of breakout is expected after pullback from resistance line
Take entry for TP until trendline resistance
Another entry after breakout of trendline resistance