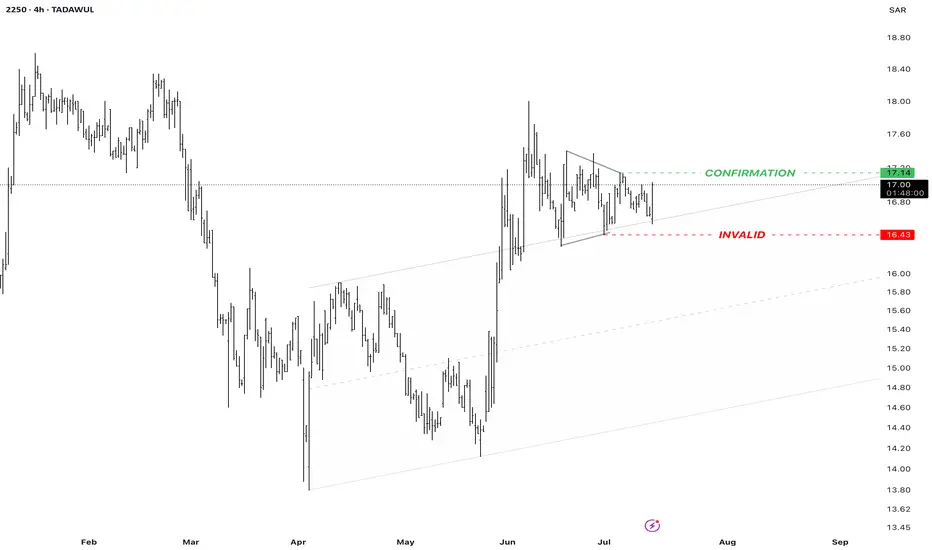
2250
On the chart:
Confirmation and failure zones.
After the triangle, the price is targeting a new high as a near-term target.
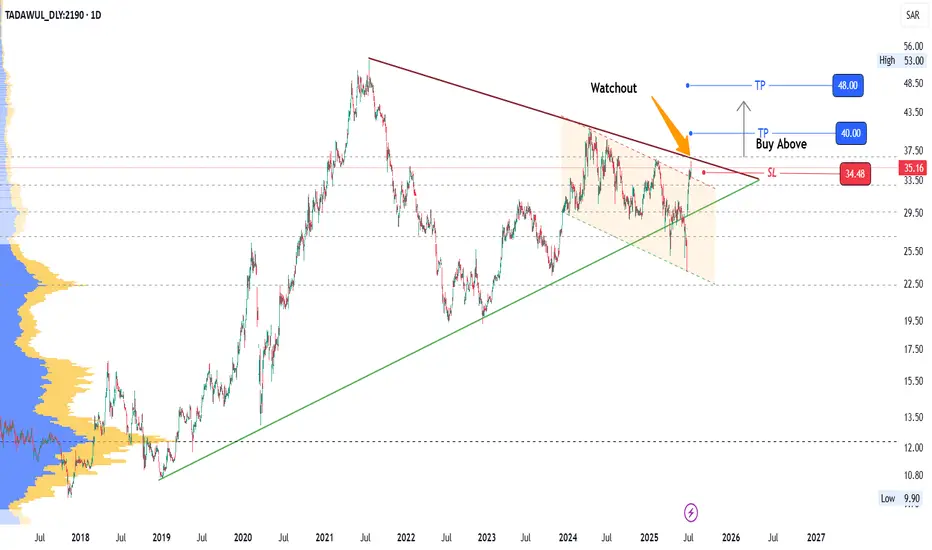
2190: Watch for Breakout2190 has reached Triangle Top (Trendline resistance) breaching a descending parallel channel resistance recently.
Watchout for the breakout of resistance.
Levels are marked.
Manage your risk with proper SL.
Enjoy the ride!
Bullish Signs on 2230 TASI Trade was on 2230 reason to enter:
Bounce from Monthly level blue line which also MONTH FVG.
Fake breakout white line in Monthly.
Entry in Daily FVG.
Target 2RR
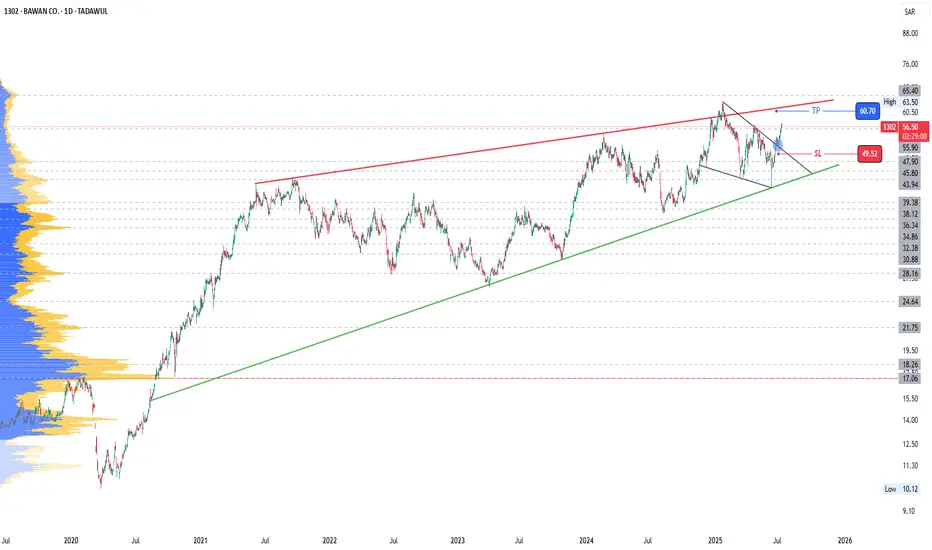
1302: Breakout of trendline resistance1302
Moving within a Rising Wedge
Price has just broken a short term resistance.
Short trade up to the top of rising wedge can be taken
Levels are marked
Trail SL accordingly.
Do proper risk management.
Watch for breakout of Rising Wedge top (Resistance)
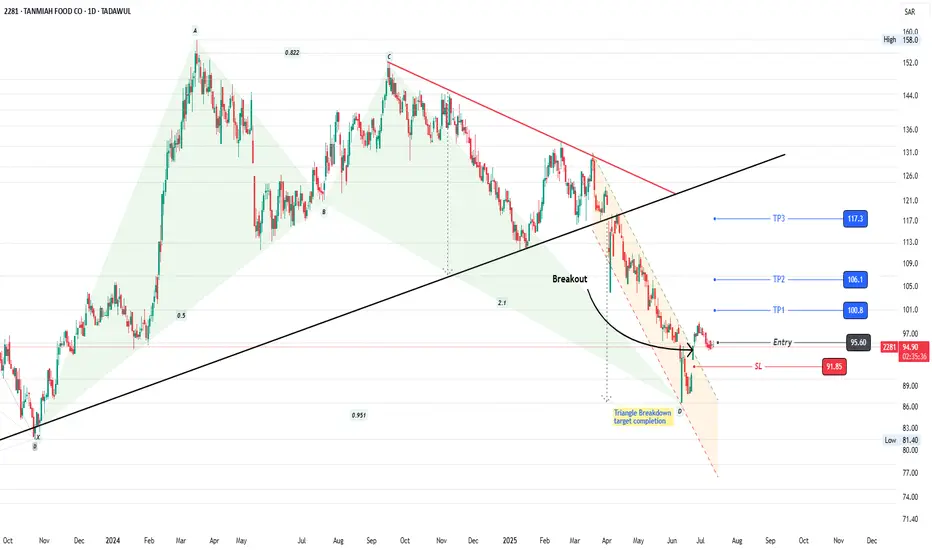
2281: Bullish Harmonic Pattern2281: Bullish Harmonic Pattern
2281 is struggling since last ATH in Sept 2024. Beautifully forming a Bullish harmonic pattern at significant support level.
Breakout of descending parallel channel is observed. Formation of HH and HL confluence is also favoring bulls.
Take Entry now or
After formation of another HH (breakout of psychological support level of 100)
Trail your stop loss accordingly.
Manage your risk.
Enjoy the ride!

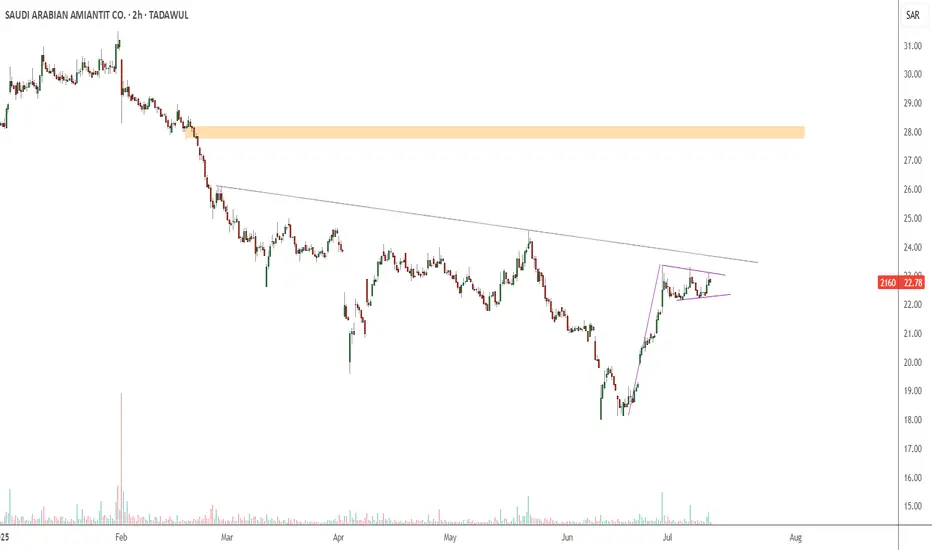
2160 Saudi Arabian Amiantit Co.Hello Traders,
One of my favorite Saudi stock is Amiantit Co,
It clears analysis,
Good Luck for all
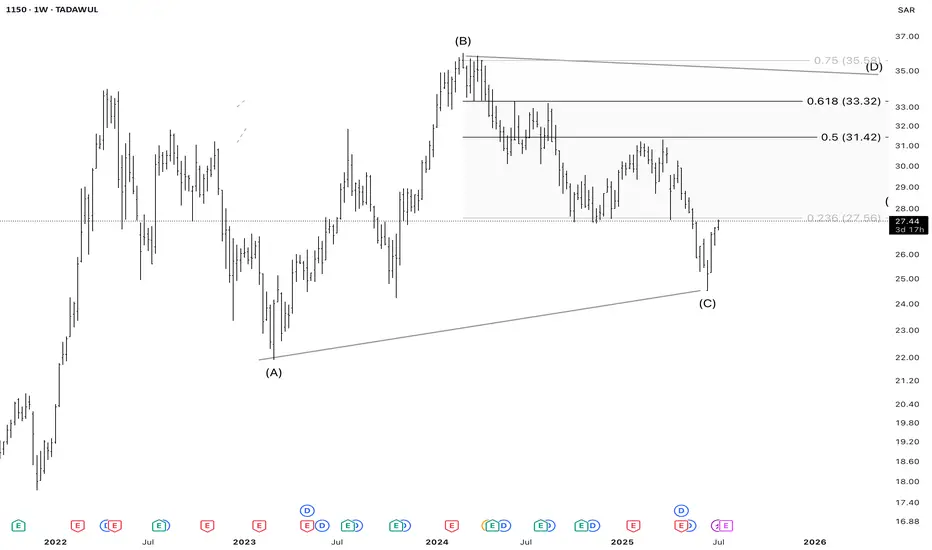
#1150We're following the stock chart.
It's forming a triangle.
You can zoom out and see the rise in five impulse waves.
If it then declines in a corrective pattern, there will be a chance for the rise to continue.
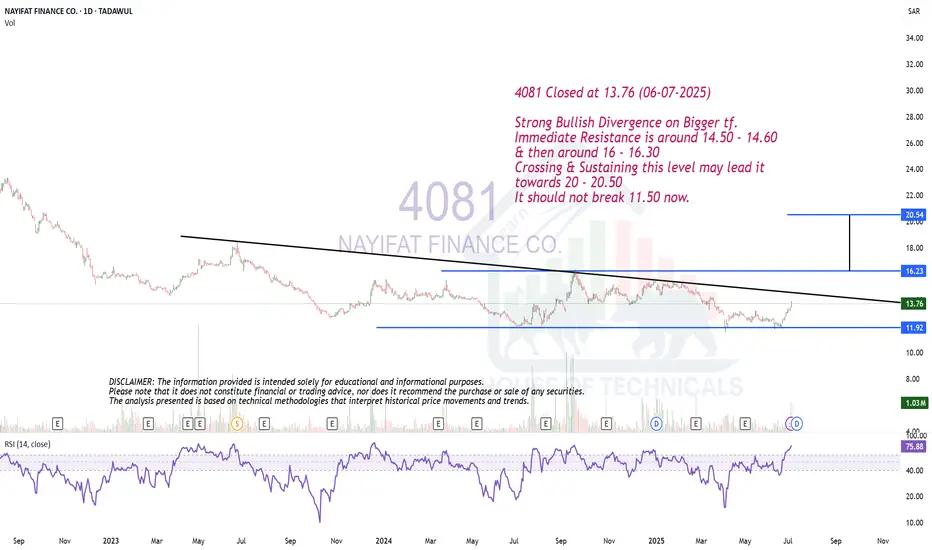
Strong Bullish Divergence on Bigger tf.4081 Closed at 13.76 (06-07-2025)
Strong Bullish Divergence on Bigger tf.
Immediate Resistance is around 14.50 - 14.60
& then around 16 - 16.30
Crossing & Sustaining this level may lead it
towards 20 - 20.50
It should not break 11.50 now.
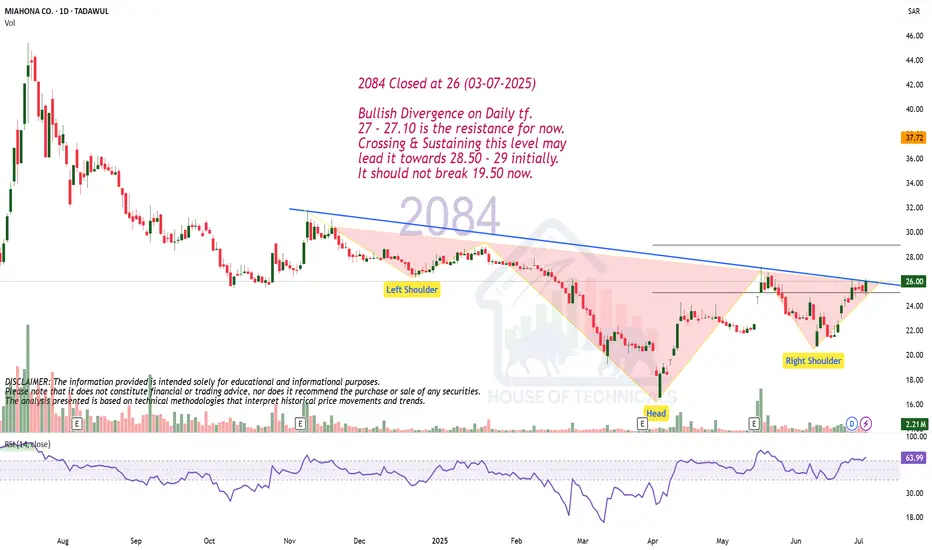
Bullish Divergence on Daily tf.2084 Closed at 26 (03-07-2025)
Bullish Divergence on Daily tf.
27 - 27.10 is the resistance for now.
Crossing & Sustaining this level may
lead it towards 28.50 - 29 initially.
It should not break 19.50 now.
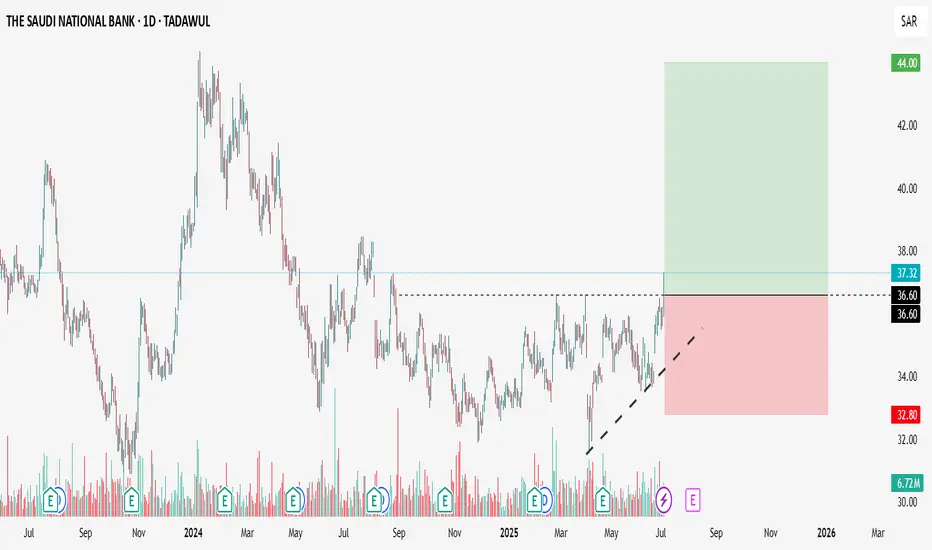
THE SAUDI NATIONAL BANKIf you like my Idea, Don't forget to Boost and comment on my Analysis. The recommendations are purely for educational purpose only, consult you financial advisor before trading.
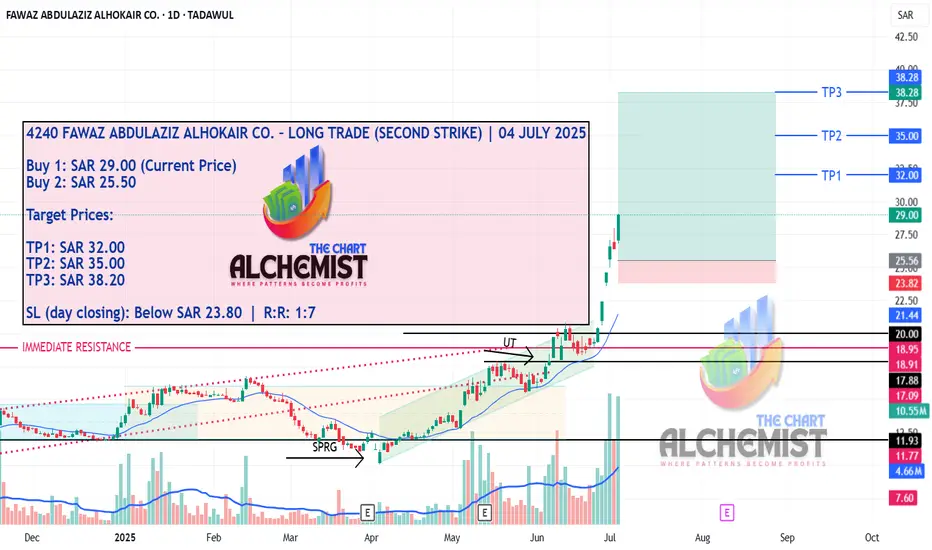
FAWAD ABDULAZIZ ALHOKAIR CO.–LONG TRADE (2nd STRIKE) 4/7/20254240 FAWAZ ABDULAZIZ ALHOKAIR CO. – LONG TRADE (SECOND STRIKE) | 04 JULY 2025
TADAWUL TRADE SIGNAL
After achieving all targets in our previous First Strike call, 4240 has now set up for a compelling Second Strike. The current price structure is showing strong continuation potential, with high-probability momentum likely to resume from this support zone. The risk-reward ratio remains highly favorable.
📌 Execution Strategy:
Caution: Please buy in 3 parts within the buying range. Close at least 50% of your position at TP1 and trail the stop loss to protect profits in case of unforeseen market conditions.
📢 Disclaimer: Do not copy or redistribute signals without prior consent or proper credit to The Chart Alchemist (TCA).
✨ Kindly support our efforts by boosting and sharing this idea!
Double Bottom + Bullish DivergenceDouble Bottom Formation on Weekly basis.
Bullish Divergence appeared.
Crossing & Sustaining 25 may lead it towards 26 - 27
& then around 33 - 34.
However, it should not break 21.90

4040 Reversal candle at key trendline resistanceA significant monthly reversal candlestick has formed right at the long-term descending trendline, supported by historical price action.
SAUDI TELECOM CO.If you like my Idea, Don't forget to Boost and comment on my Analysis. The recommendations are purely for educational purpose only, consult you financial advisor before trading.

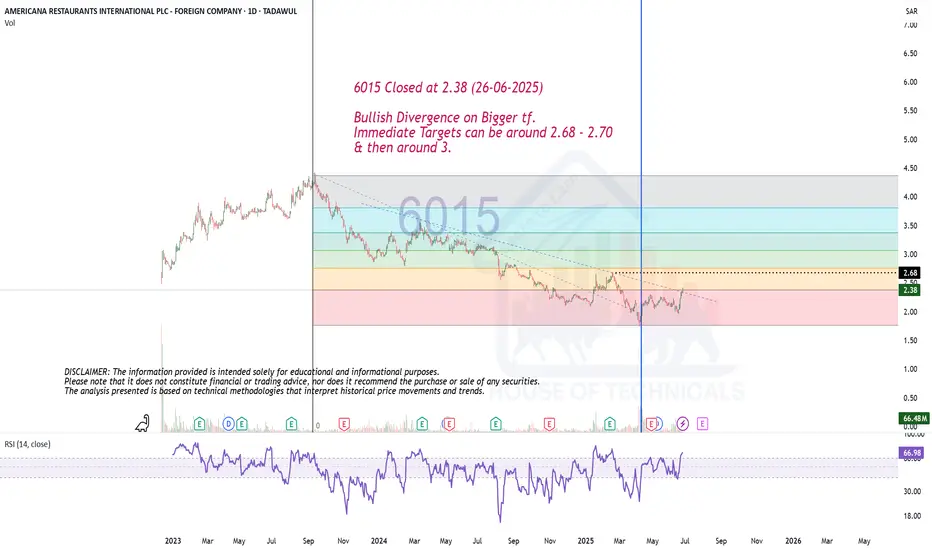
Bullish Divergence on Bigger tf.6015 Closed at 2.38 (26-06-2025)
Bullish Divergence on Bigger tf.
Immediate Targets can be around 2.68 - 2.70
& then around 3.
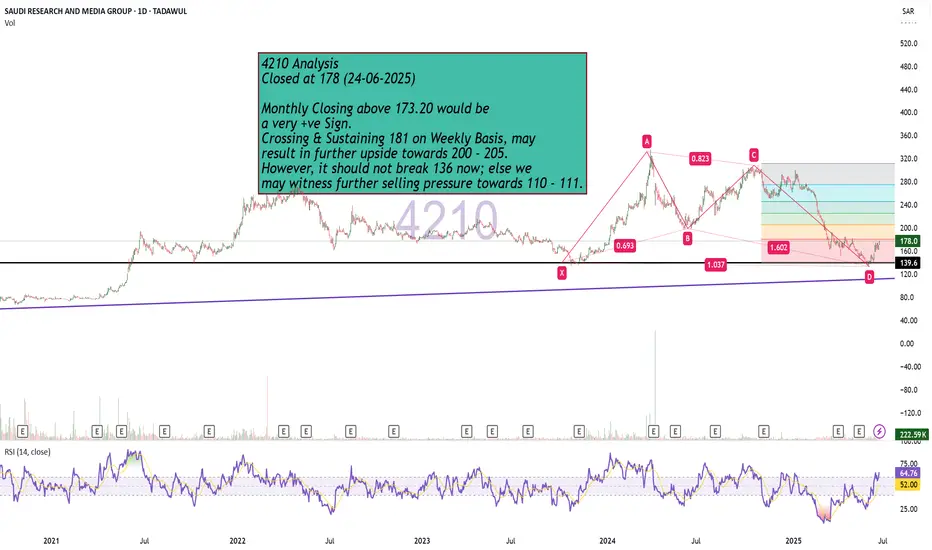
Bullish Monthly Candle Expected?4210 Analysis
Closed at 178 (24-06-2025)
Monthly Closing above 173.20 would be
a very +ve Sign.
Crossing & Sustaining 181 on Weekly Basis, may
result in further upside towards 200 - 205.
However, it should not break 136 now; else we
may witness further selling pressure towards 110 - 111.
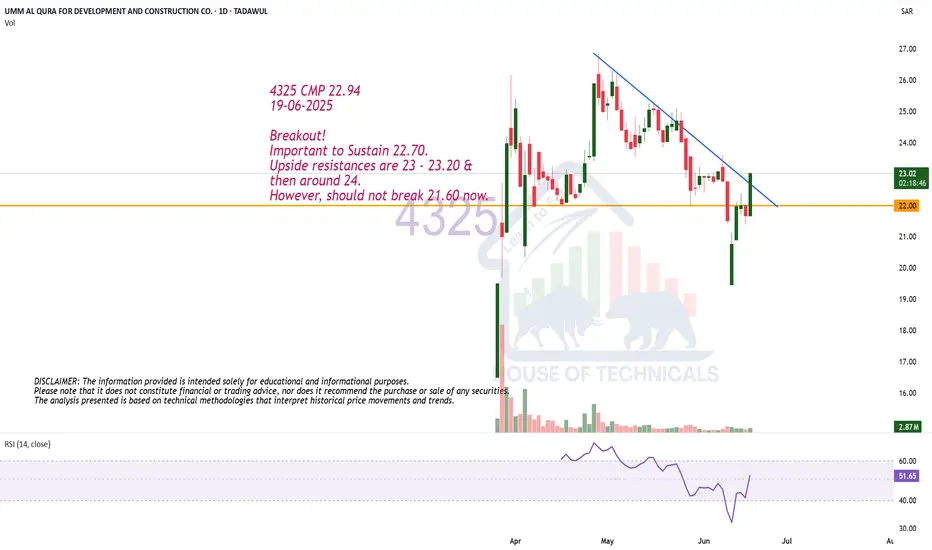
Breakout!4325 CMP 22.94
19-06-2025
Breakout!
Important to Sustain 22.70.
Upside resistances are 23 - 23.20 &
then around 24.
However, should not break 21.60 now.
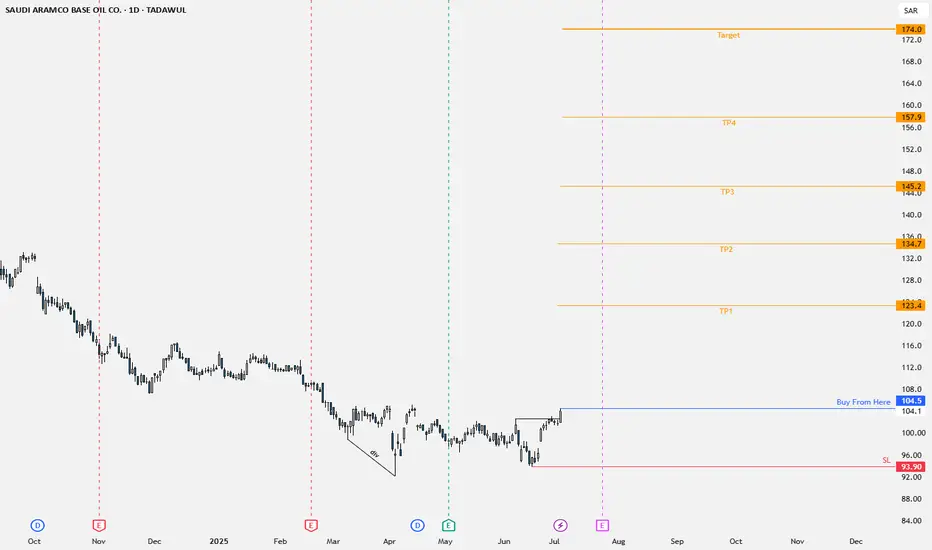
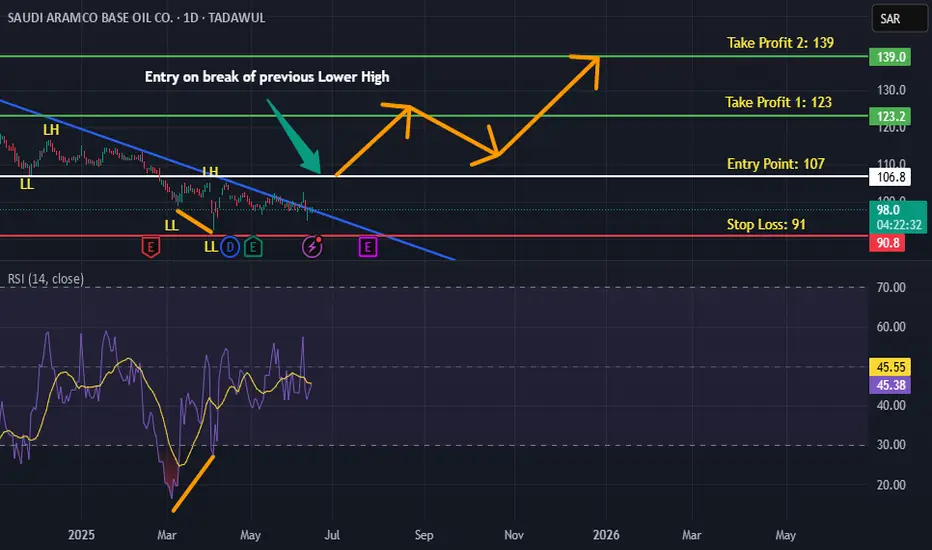
ARAMCO is BullishPrice is in a strong downtrend printing lower lows and lower highs continuously. However, the eight month long trendline seems to be breaking. Moreover, accumulation at current levels is also an indication that bulls are trying to assume control of the price action. If previous lower high is broken with good volume then we can expect a bullish reversal as per Dow theory. Targets are mentioned on the chart.
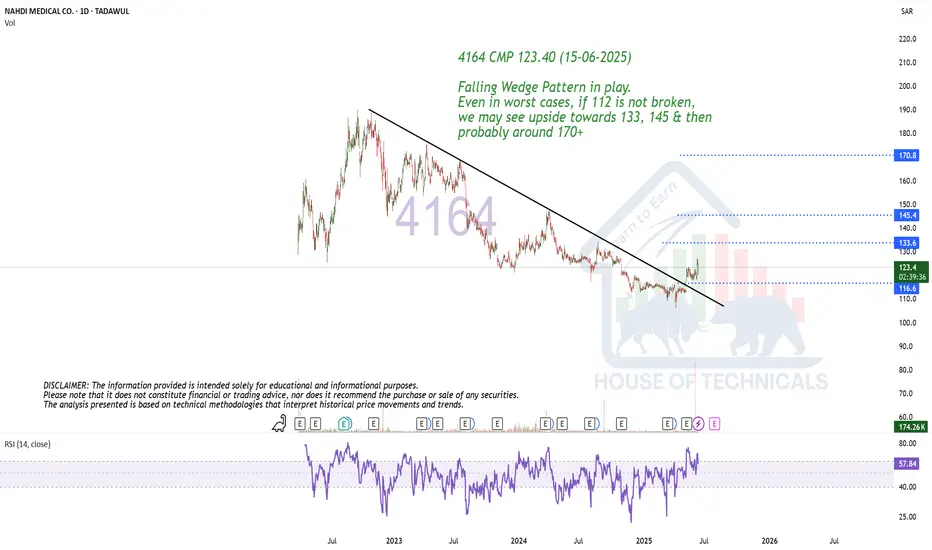
Falling Wedge Pattern in play.4164 CMP 123.40 (15-06-2025)
Falling Wedge Pattern in play.
Even in worst cases, if 112 is not broken,
we may see upside towards 133, 145 & then
probably around 170+