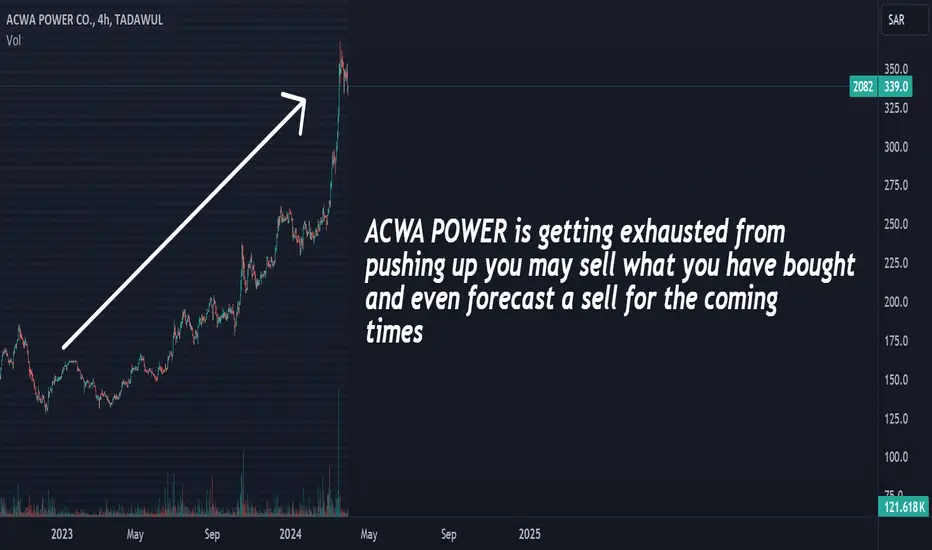
ACWA POWER is getting exhaustedACWA POWER is getting exhausted from pushing up you may sell what you have bought and even forecast a sell for the coming times
AL hammadi holoding KSA stocks bullish this chart for Hammadi hospital in KSA, showing bullish trend on 1H timeframe.

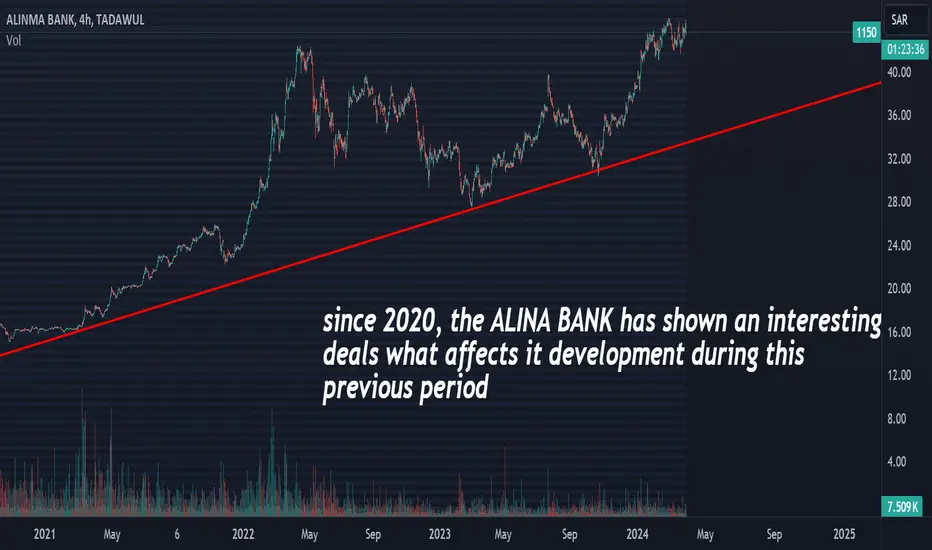
ALINA BANK has shown an interesting deals since 2020, the ALINA BANK has shown an interesting deals what affects it development during this previous period
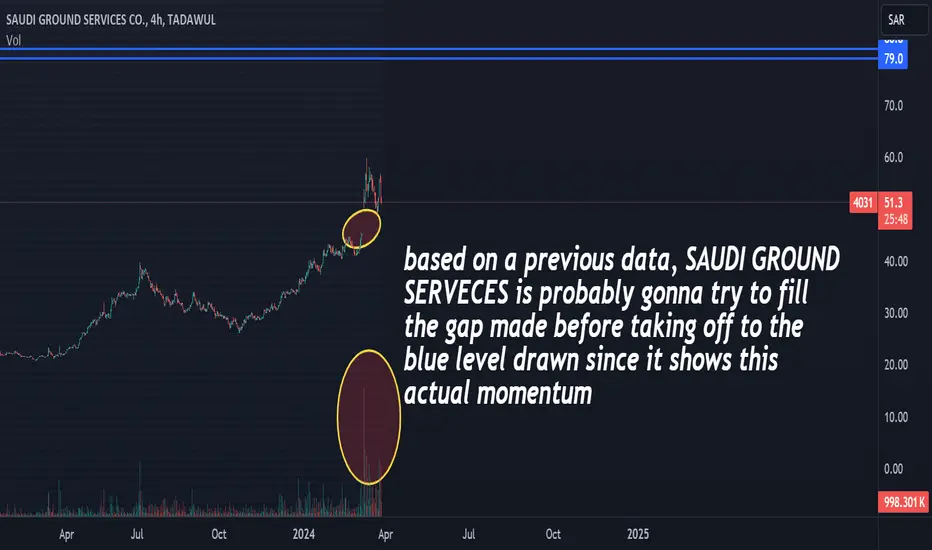
SAUDI GROUND SERVICES to the moon after it fills the gapbased on a previous data, SAUDI GROUND SERVICES is probably gonna try to fill the gap made before taking off to the blue level drawn since it shows this actual momentum
4016 Longset up an Anchor VWAP from the last bottom and re test this vewap. the ieda is is long after announcing good finance reporting

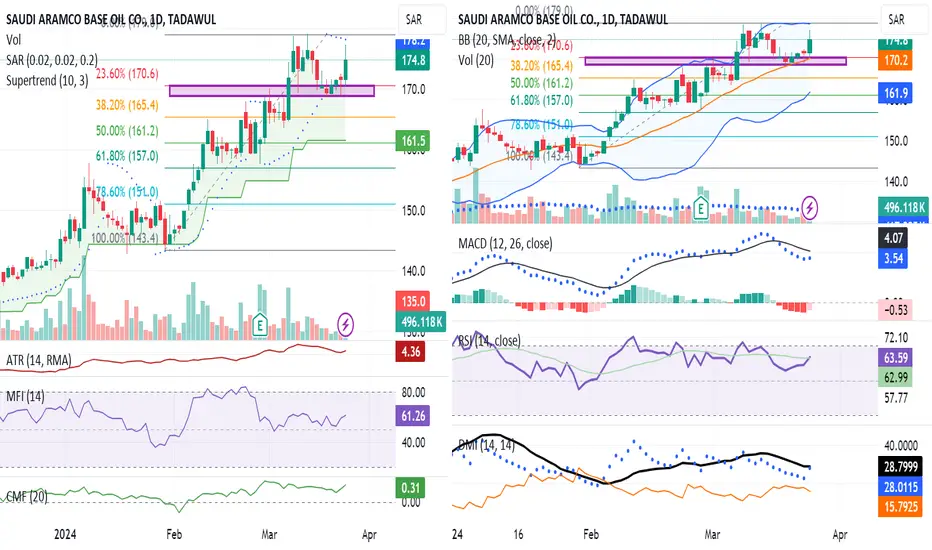
Saudi Aramco 2223As it's showing a stock in an uptrend, the stock enters a correction phase but rebounds to Fibonacci levels. However, it's worth noting that the volume is not supportive, unlike what we observe with other indicators, especially MACD, which will give a buy signal if the next candle confirms with a green. Similarly, in Bollinger Bands, touching its support level, just like the last time, the volume did not support, then it will be an uptrend. However, we are also observing that the trend is showing signs of weakness; if volumes increase, then we will consider it.
As we are already in a position, for safety, we are keeping our stop-loss at 167.84 AED.
Conclusion: All signs support an uptrend; the bullish trend is stronger, but we must primarily consider volume and other indicators and run with a stop-loss for safety.
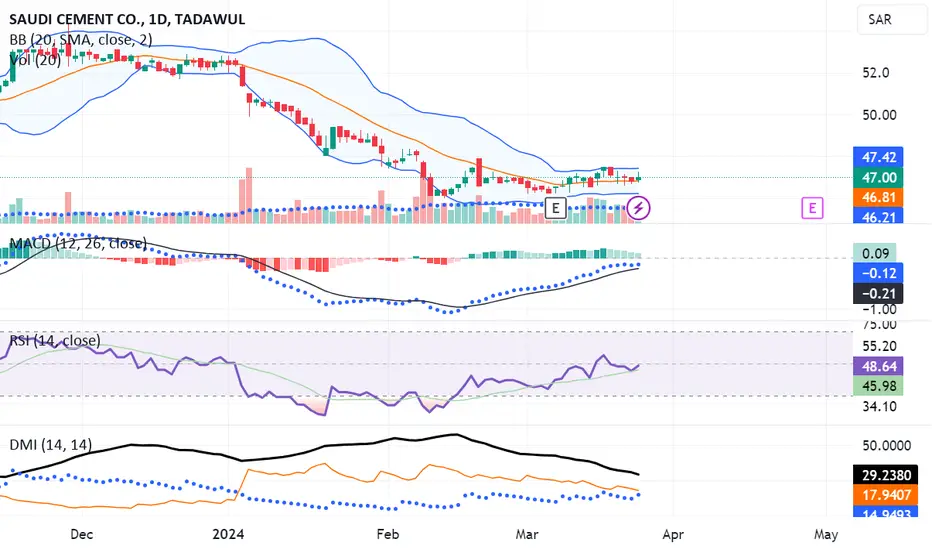
SAUDI CEMENT CO 3030Stock in consolidation phase if stock goes upward then we will take position but due to volume still undecided
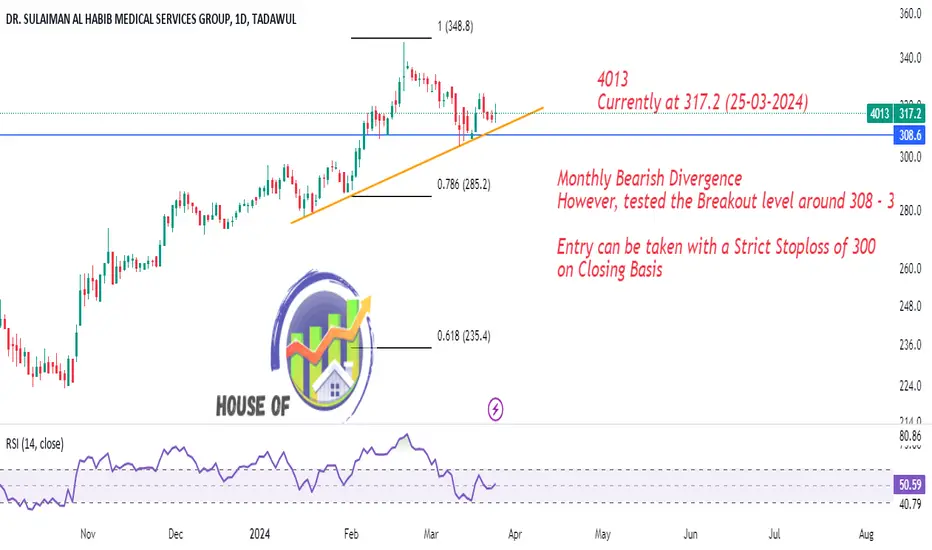
Trade WiselyMonthly Bearish Divergence
However, tested the Breakout level around 308 - 309
Entry can be taken with a Strict Stoploss of 300
on Closing Basis
forcasting up wardafter franchising this important level with an interesting momentum the JAMJOOM is tending to stay up this area and keeps moving up

4230 Red Sea International, possible uptrend .....week candlesa positive diversion showing in a weekly charts as an indicator to a possible uptrend ,,,, technically by closing above 25.70 with high volume, 1st target 29.30 then 31.05 then38.85 and long term target is 53.30

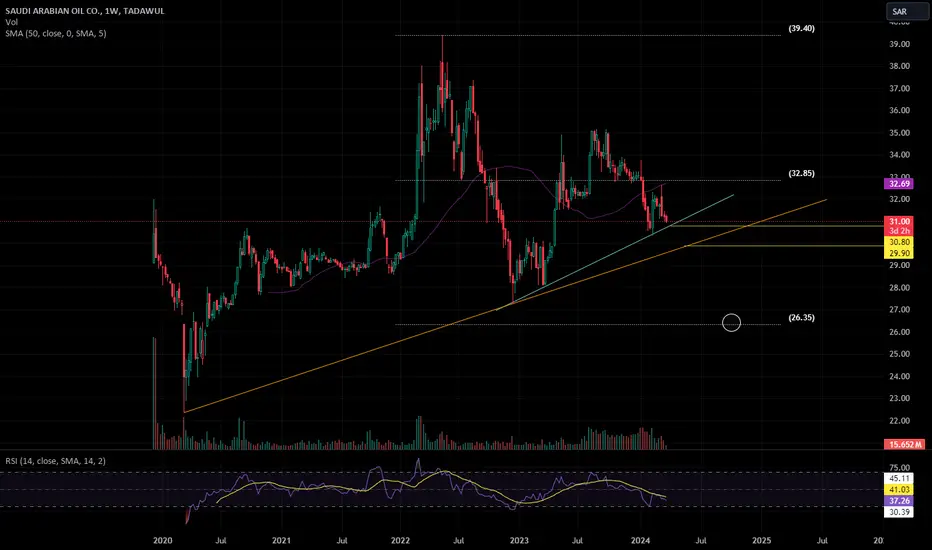
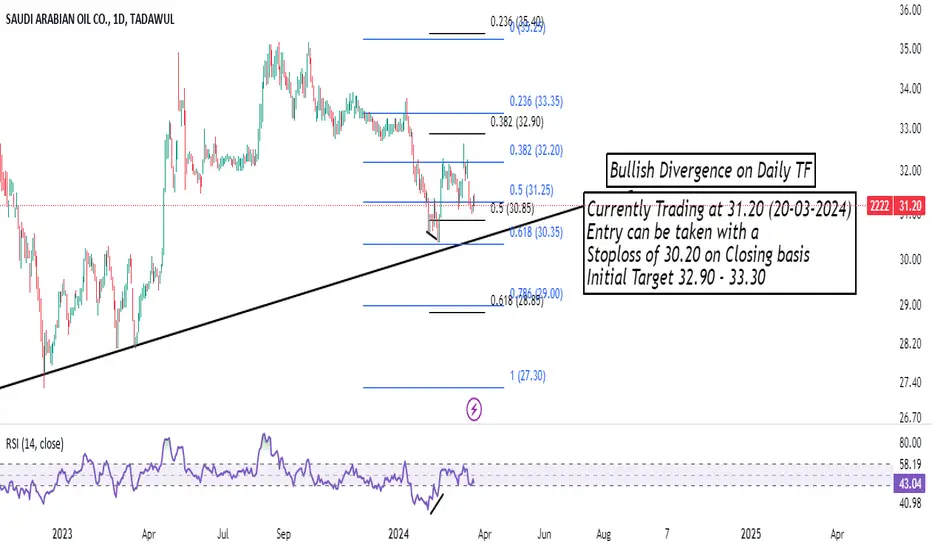
2222 Aramco, Possible downtrend possible a downtrend to 26.35 technically, only if break down the orange trend line around 29.90
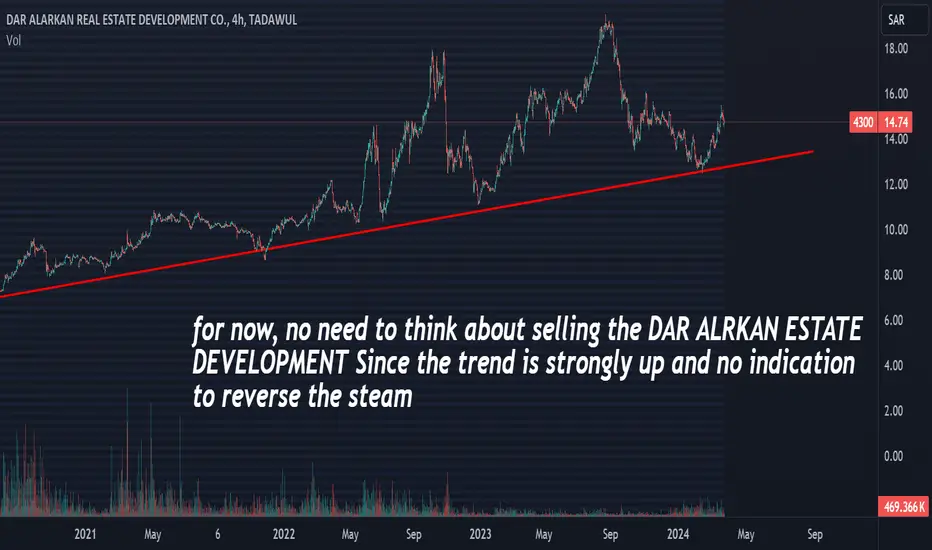
high to highfor now, no need to think about selling the DAR ALRKAN ESTATE DEVELOPMENT Since the trend is strongly up, and no indication to reverse the steam
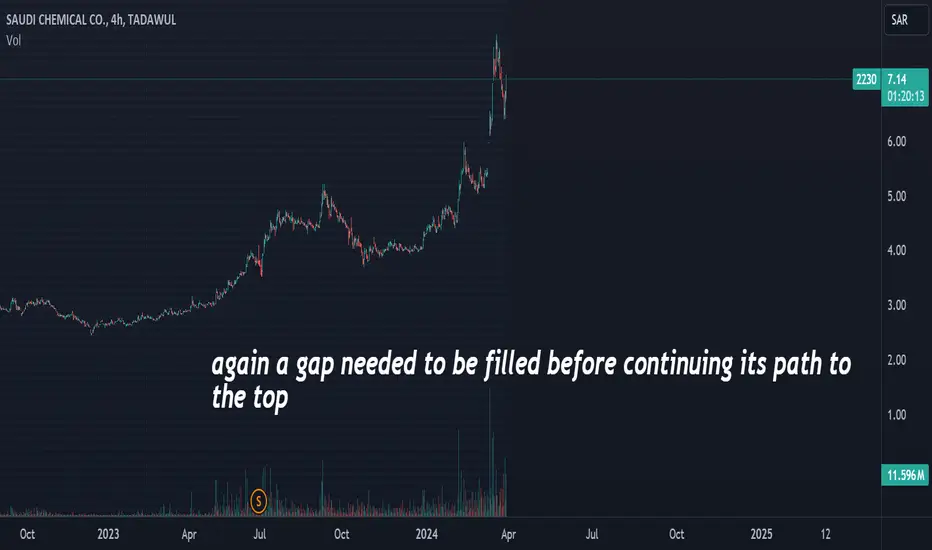
2230 is hitting 5.5 SRThe price is going to hit 6-5.5 for closing the gabs/retesting/Simple correction
then it is going to hit the green zone again up as a retest

UNITED WIRE FACTORIES to upUNITED WIRE FACTORIES tries to attend the drawn-level after showing this interesting momentum inside a quasi-stable movement

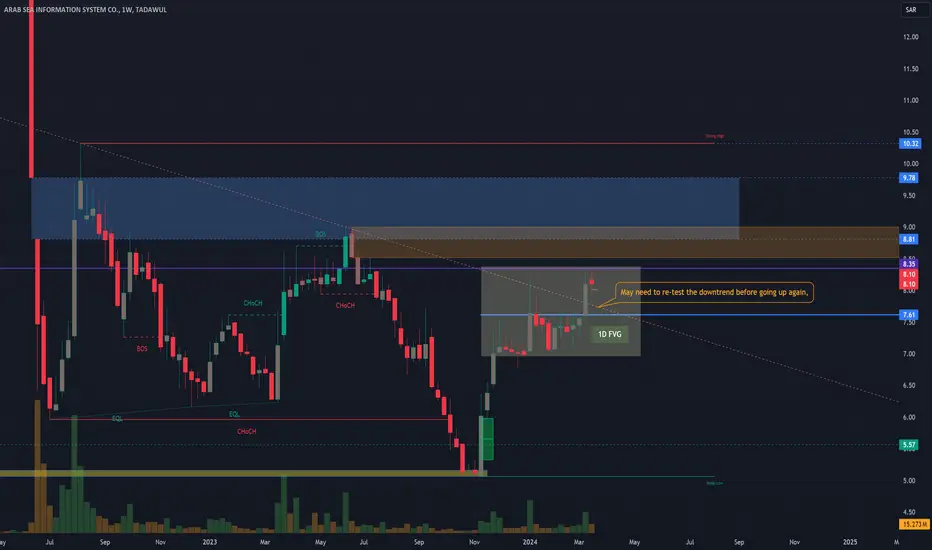
ARAB SEA TO DRIVE LONG WAY TO NEW DESITNATIONSLooking at weekly frame analysis:
* Close Previous price gaps formed in June 12th to 19th 2022
- Price to hit 8.81 (Lower previous price gap)
- Price to hit 9.78 (Upper previous price gap)
New targets to hit after gap is closed and stabilize above 10.32
There seems to be a bullish rectangle which might be broken if bullish buyers are serious
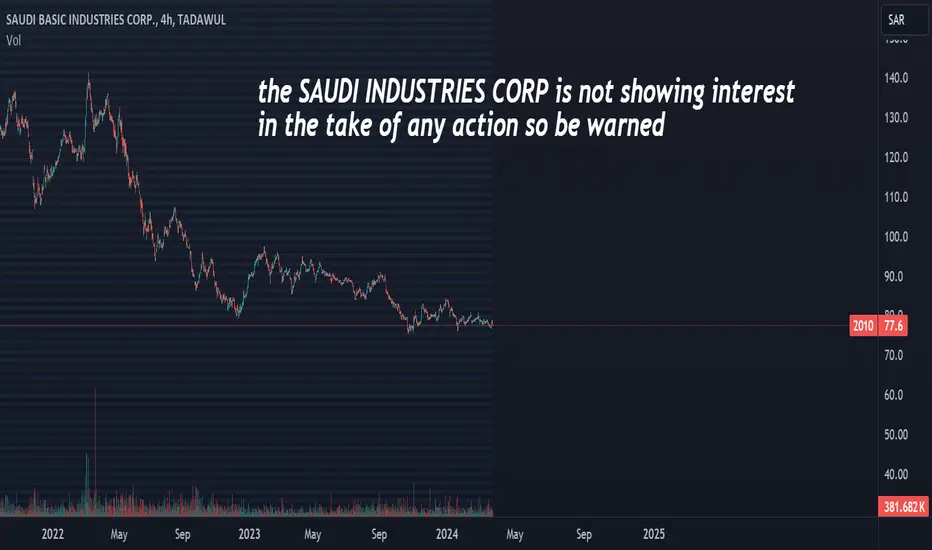
SAUDI INDUSTRIES CORPthe SAUDI INDUSTRIES CORP is not showing interest in the take of any action so be warned
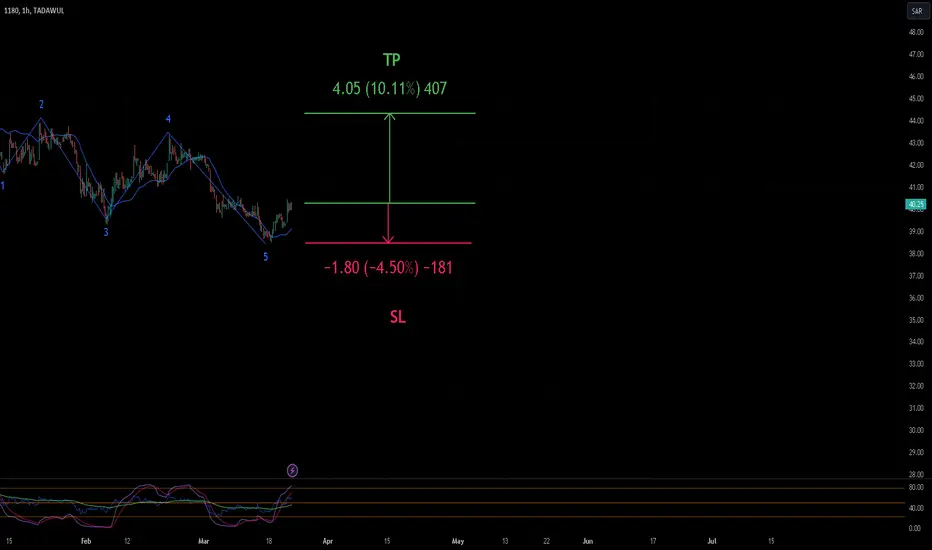
#NSB_1180I expect, and God knows best, that it will be a model of the Wolfe wave as shown in the drawing, and I do not bear responsibility for anyone’s purchase.
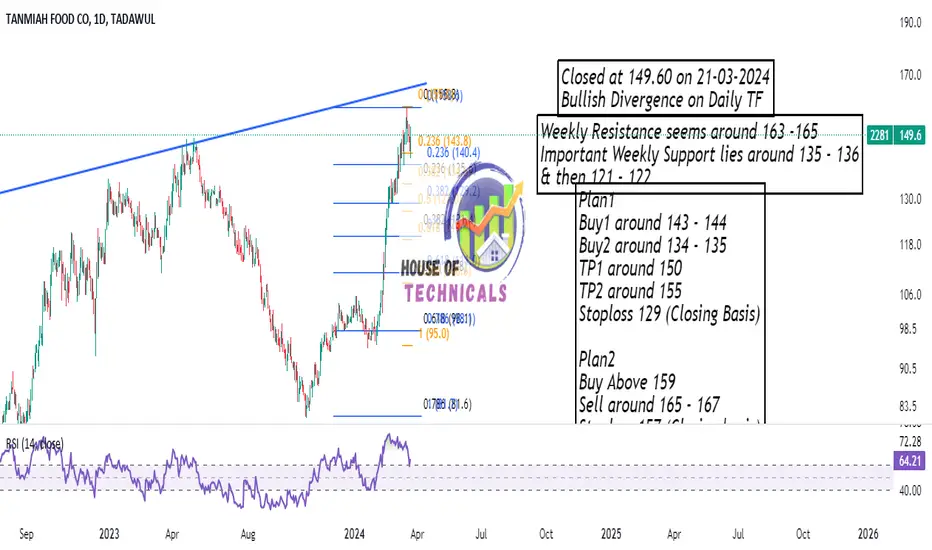
Bullish Divergence is thereWeekly Resistance seems around 163 -165
Important Weekly Support lies around 135 - 136
& then 121 - 122
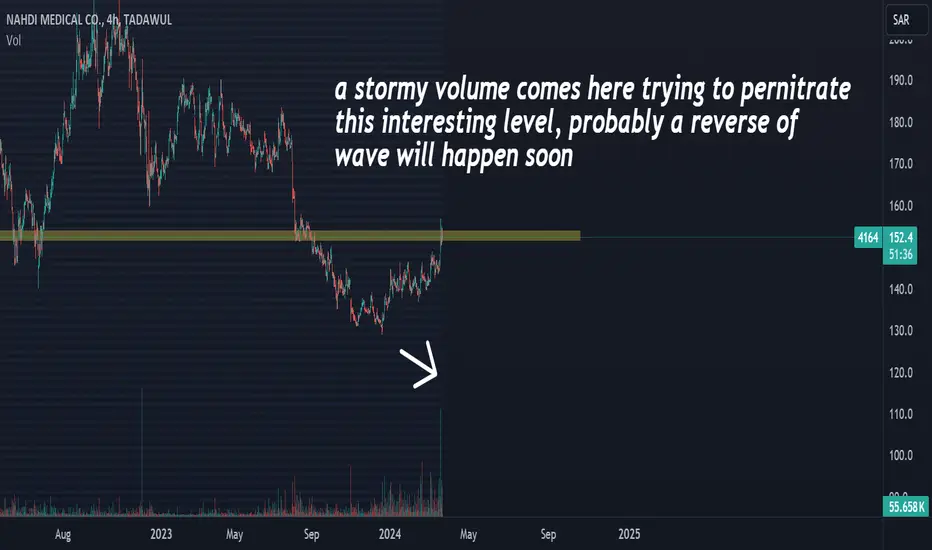
NAHDI dropinga stormy volume comes here trying to pernitrate
this interesting level, probably a reverse of
wave will happen soon

Bullish on Daily TFInvestment Checklist
14.42% Expected Annual Return
Based on 1 year median target stock price of SAR 34.49 and annual dividend yield of 3.88%
Very Low Risk
This stock is 0.39x as volatile as the KSA
3.88% Dividend Yield
This stock offers higher dividend yield compared to the market dividend yield of 2.27%
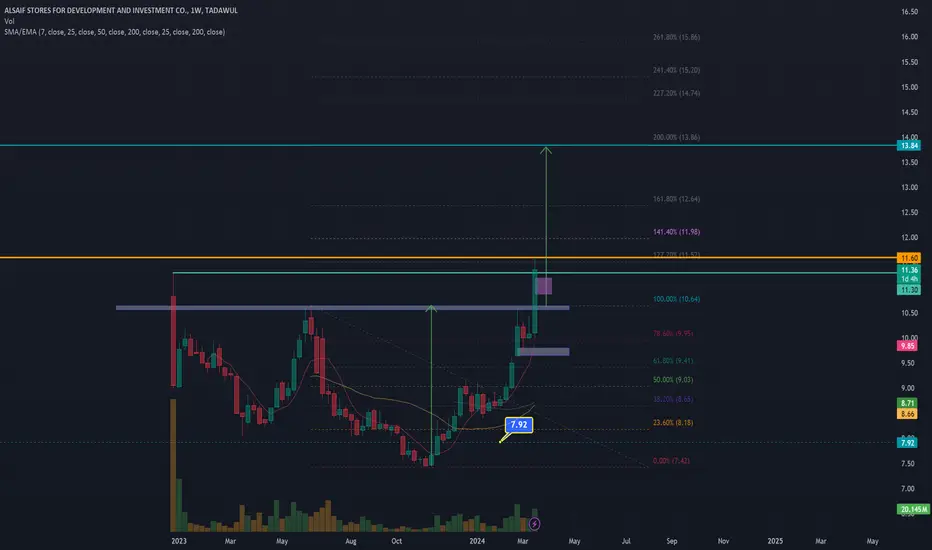
4192 ALSAIF STORES on Historic Bullish TrendWith proper Fibonacci retracement ... the door is open for 13.82 (200% FIBO)