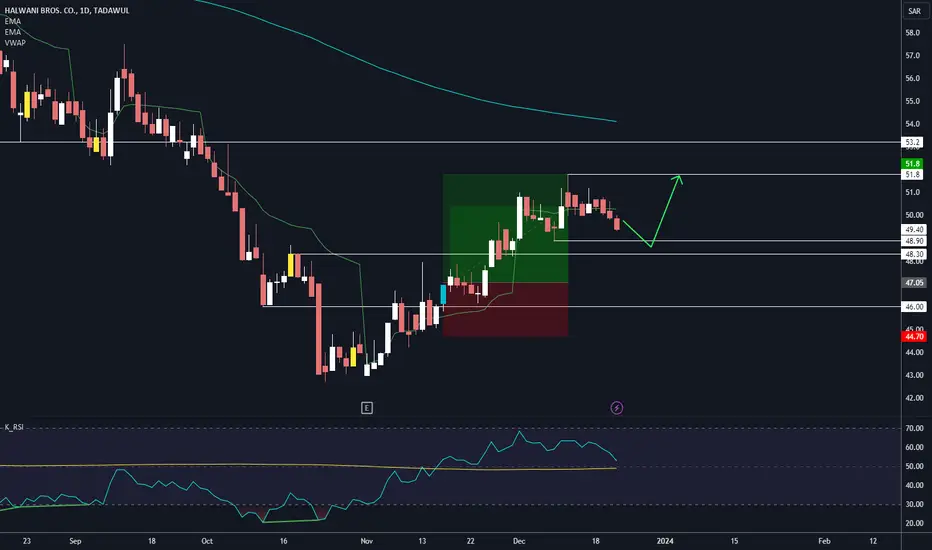
HALWANI BROS. CO. 6001 - Bullish Pullback to 200 Daily MAbullish pullback opportunity towards the 200-day moving average. Several strong indicators support this potential upward movement:
RSI Value Near 50: The Relative Strength Index (RSI) is hovering close to the neutral 50 level, suggesting a balanced market sentiment and potential for upward momentum.
Support Holding at 48.5 Level: The stock has demonstrated resilience by holding a crucial support level at 48.5, indicating buyer interest and a potential bounce.
As the price retraces, there's an opportunity for a second entry around the 48.5 level.
Target Levels:
Take Profit 1 (TP1): 53.2 level or 200 moving average
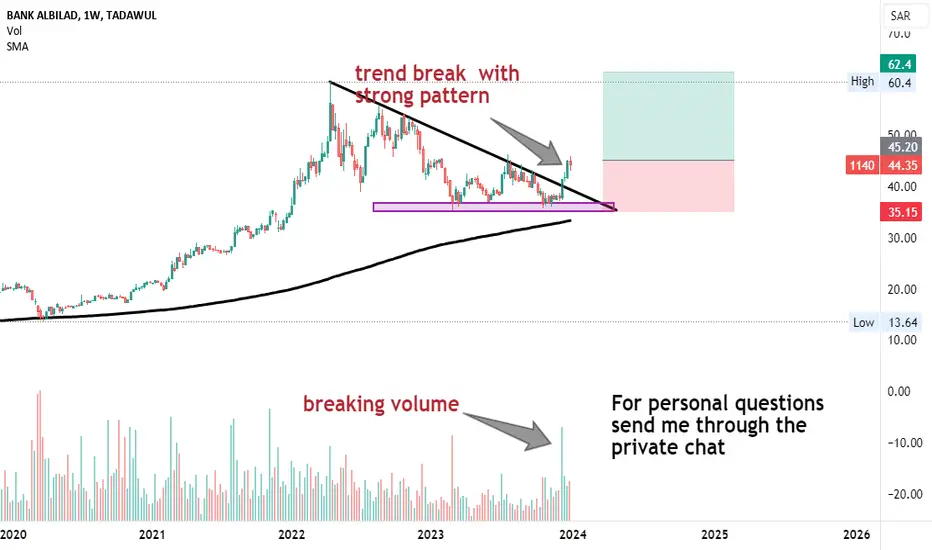
BANK AL BILAD IN WEEKLY CHART .Hello to all tradingview investors, according to my previous analysis I see a great opportunity with good probability, the details are reflected in the chart, greetings and good luck to al
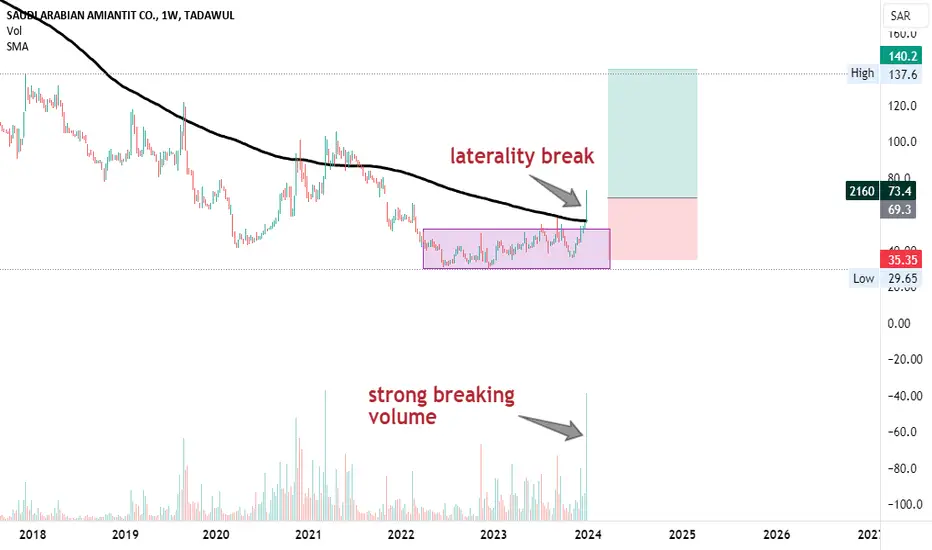
SAUDI ARABIAN AMIANTIT in weekly chart Hello to all tradingview investors, according to my previous analysis I see a great opportunity with good probability, the details are reflected in the chart, greetings and good luck to all
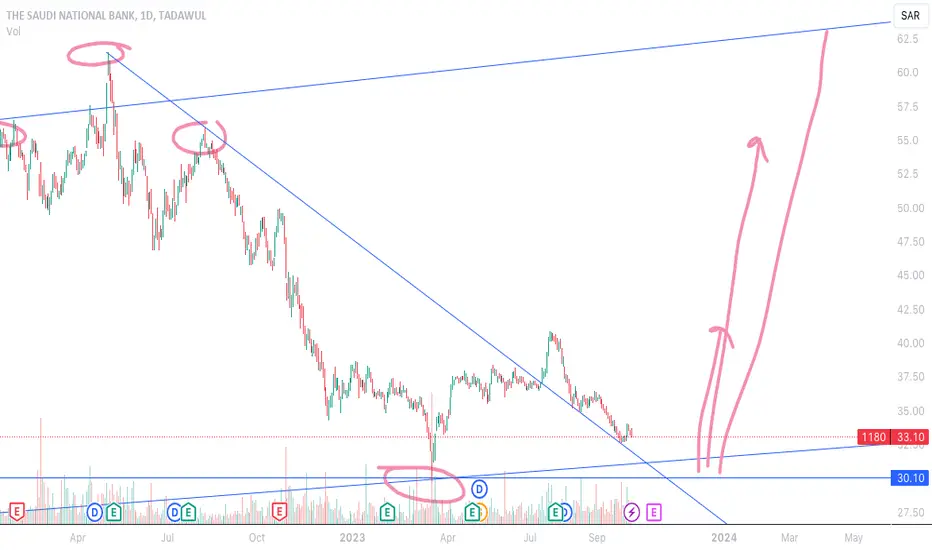
analysis of 1180analysis of 1180 in saudia market
the major trend is uptrend
watch the video and comment us if there is any thing missing

SABIC (2010) will target 102 after crossing resistanceDaily chart, SABIC (2010) stock is trading in an ascending channel for a year.
Now, it is showing positive signals for upwards movement to test the resistance line (BLUE). After crossing (around 86.3), the target will be 96, then 102
Positively, the technical indicator MACD crossed the zero line up.

Yanbu Petrochem (2290) to target 47.5 after crossing resistanceDaily chart, the stock is about to cross the resistance up, and then will go bullish to target 47.5, passing through some minor resistance levels as shown on the chart.
Technical indicators:
MACD is about to cross up zero line - positive
RSI is positive

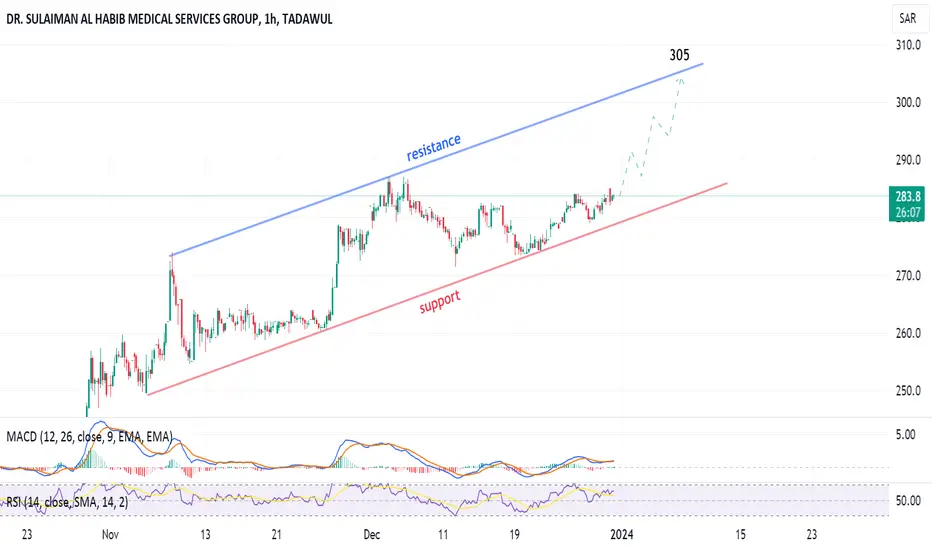
Dr Sulaiman Medical (4013) seems going bullish1-hour chart, the stock is trading in a rising channel.
After crossing resistance blue line (around 305), the target will be 311
Tech. Indicators RSI and MACD are positive
stop loss under support line (red) to be considered
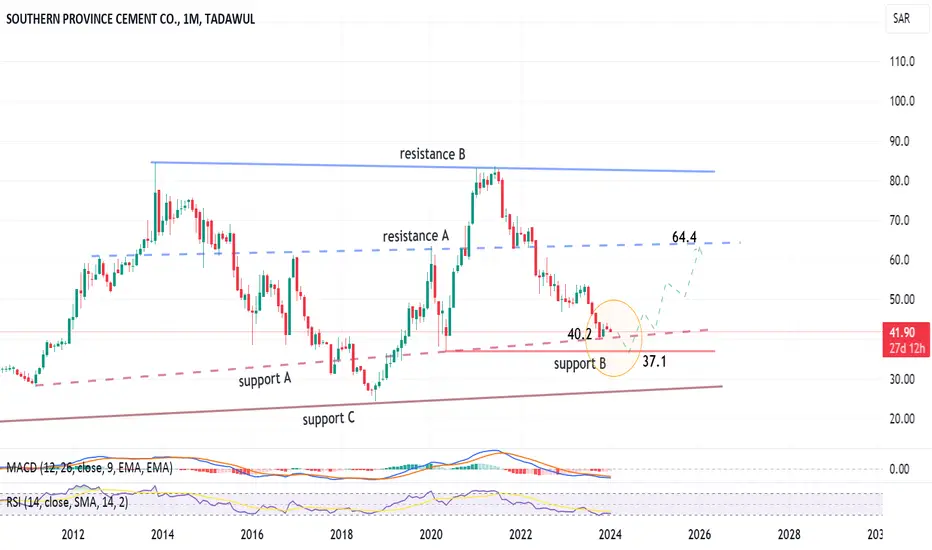
South Province Cement (3050)Monthly chart, the stock is trading in a critical zone, either rebound or fall down.
Probable rebound from support A, then next probability at support B level.
After rebounding the target will be to test the resistance A at around 64.4
Note: rebounding from support C is possible as well. Be careful!
After crossing up 68.5, the next target will be resistance line B at around 81
This is a long term view.
TABUK CEMENT CO Trading below Support Area -Rebound will occurThis company is trading below the support level and one of the beaten up stock.
Recovery will start soon.
RSI,SMA ,STOCH,BB all shows that good upmove will be starting soon.
This is really at good accumulation level .

Alamar Foods (6014) is waiting a reboundDaily chart, the stock was trading in a descending wedge, broke down, and the target is 73.
However, it seems there is a tendency to re-test the previous trough at 88.6 and rebound from it.
Above the red line (103 - 104), the next target will be 121 (the blue resistance line)

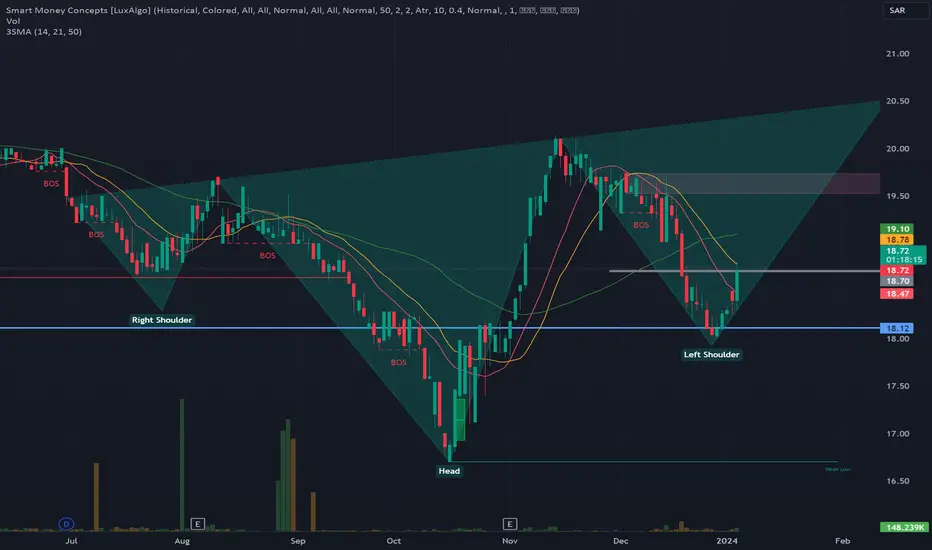
1183 SHL Finance - Inverted Head and Shoulder Pattern A technical view on this stock shows that it is within an inverted head and shoulder pattern waiting for a complete formation followed by a retest and then breakout
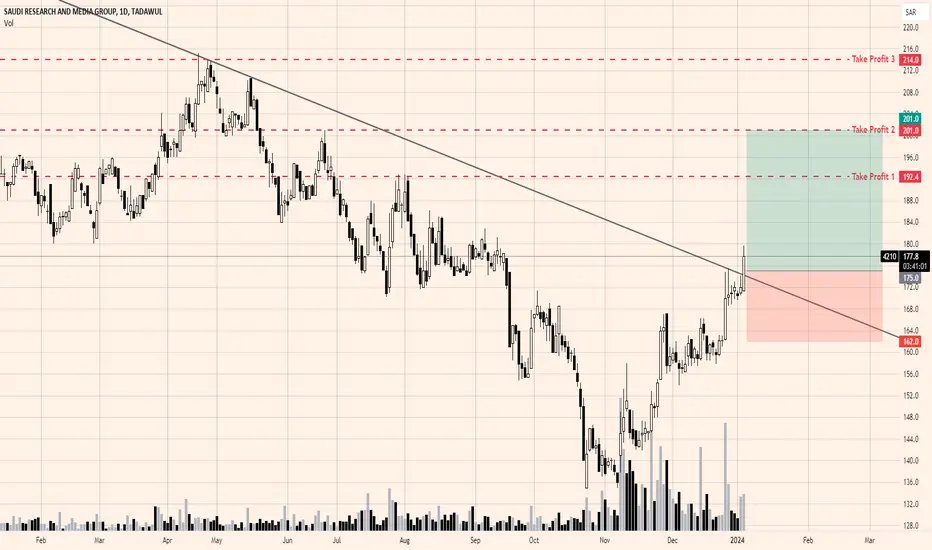
4210Saudi Research and Media group show breakout of trend line in daily time frame. Long position can be consider on the retest of the trend line at 175. First and second targets are 192.4 and 201 respectively. Stop loss below 162.
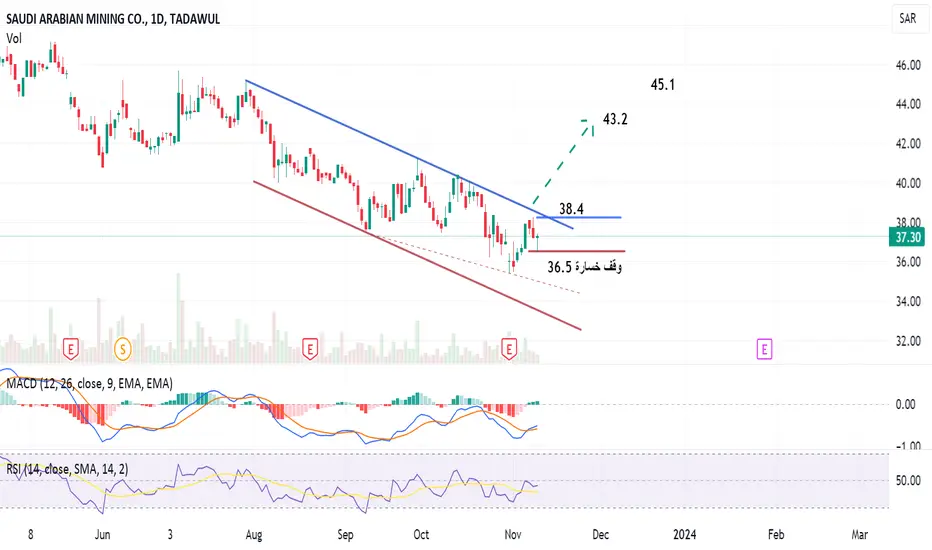
1211 Maaden, to target 43.2Maaden stock is showing a tendency to cross the channel upwards, supported by the technical. indicators RSI and MACD.
On the daily chart, after crossing 38.4, the target will be 43.2 then 45.1
Stop loss should be considered.
Warming up to the next level Gold is Gold The share is trading closed order block
That order is supported to jump the next level
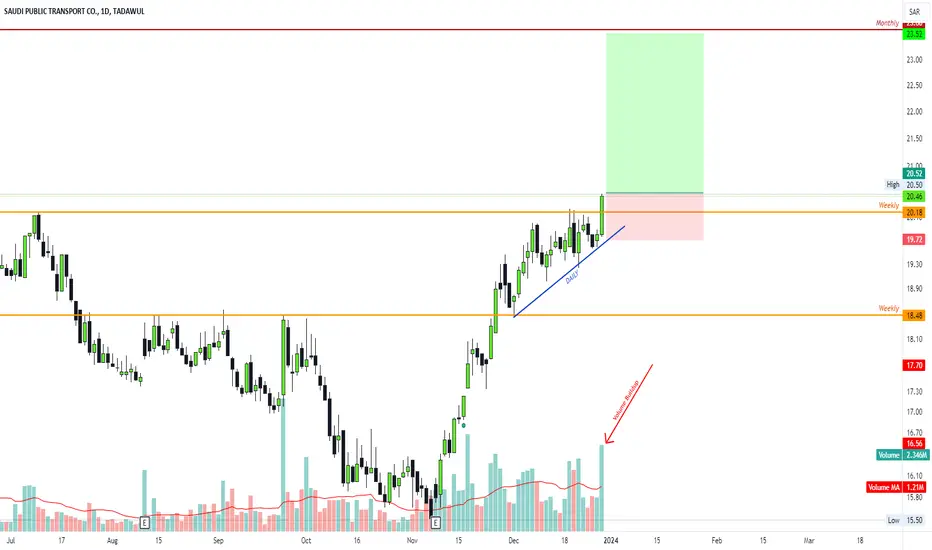
4040 - SAUDI PUBLIC TRANSPORT CO. LOOKS BULLISHSAUDI PUBLIC TRANSPORT CO. looks bullish and a possible 15% move is expected as per previous price action which was supported by huge volume
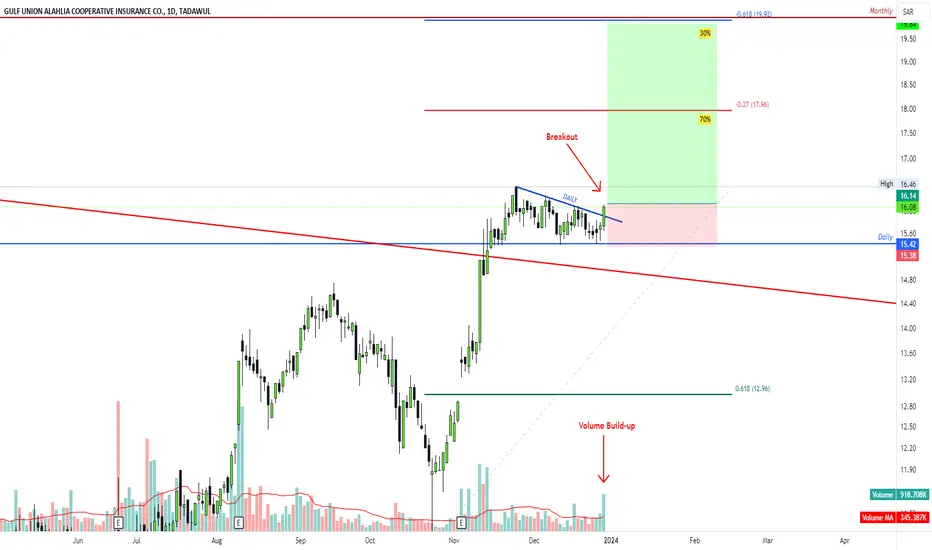
8120 - GULF UNION ALAHLIA COOPERATIVE INSURANCE CO.8120 looks bullish as it gave a breakout supported with volume and it is above 200 EMA

2382ADES is ready to archives the target 23.36 in to several days
it's importins don't trade below the 18.32

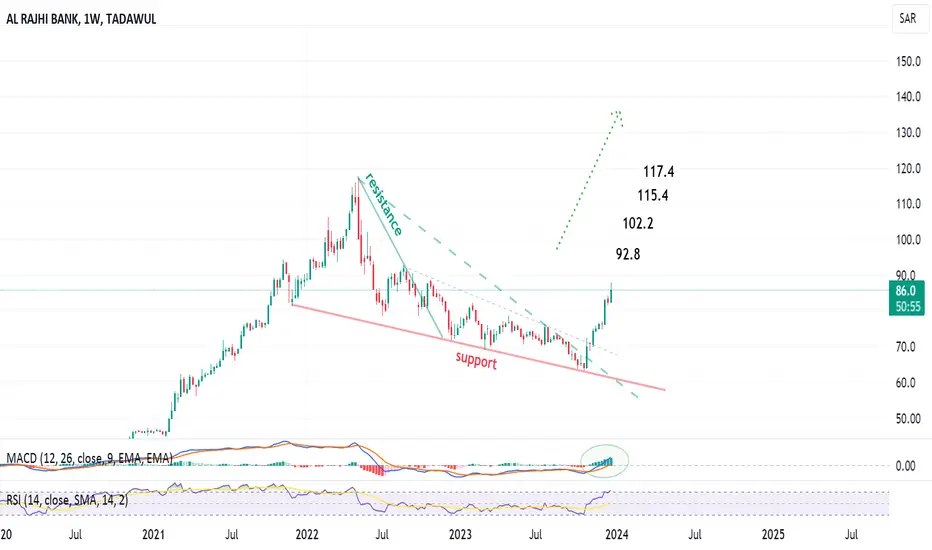
Rajhi Bank (1120) has a bullish potential to 117.4 and moreWeekly chart, the stock formed a bullish chart pattern falling wedge,
the target is 92.8, then 117.4 passing through the shown resistance levels
Technical indicator MACD is positive and crossed its signal above zero line.
Catering Holding (6004) formed a pattern, to target 181.5Weekly chart, the stock (6004) has formed a bullish chart pattern, and the first target is 143.6
Technical indicators RSI and MACD are positive.
Then Fibonacci extension indicates the following targets 161.4, 171.6, 181.5

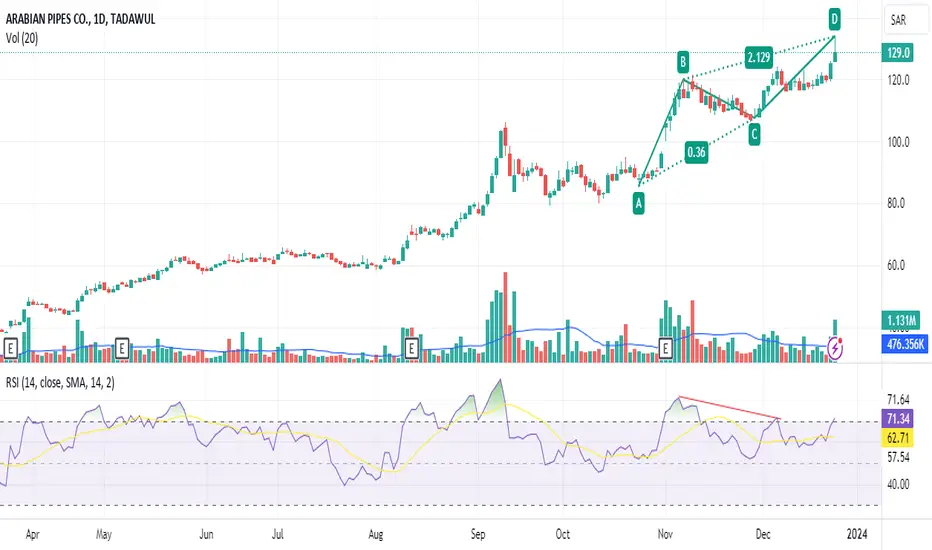
ARABIAN PIPESbears are expected to take control for short term with confluence of evidence from divergence
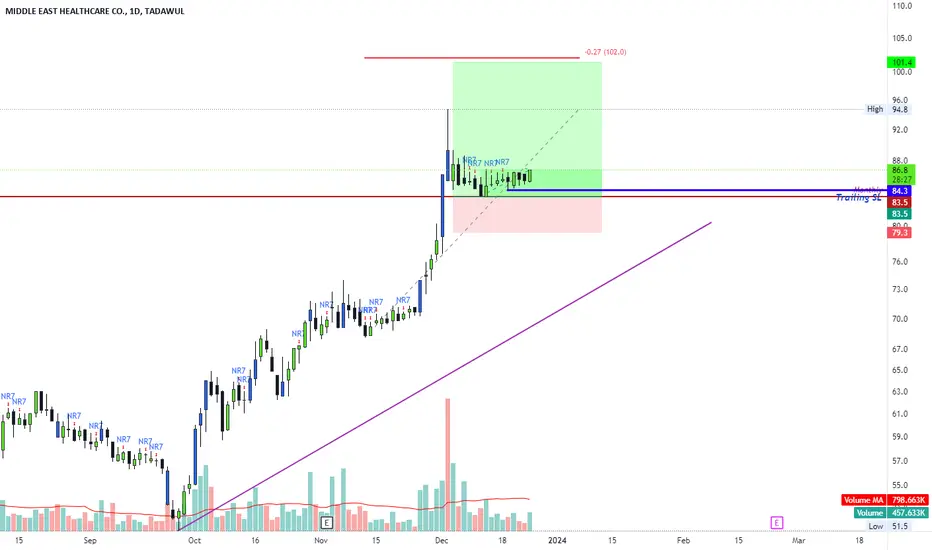
POTENTIAL UPSIDE MOVE IN MIDDLE EAST HEALTHCARE CO. (4009)4009 is making higher highs and higher lows and it has recently broken the all-time high.