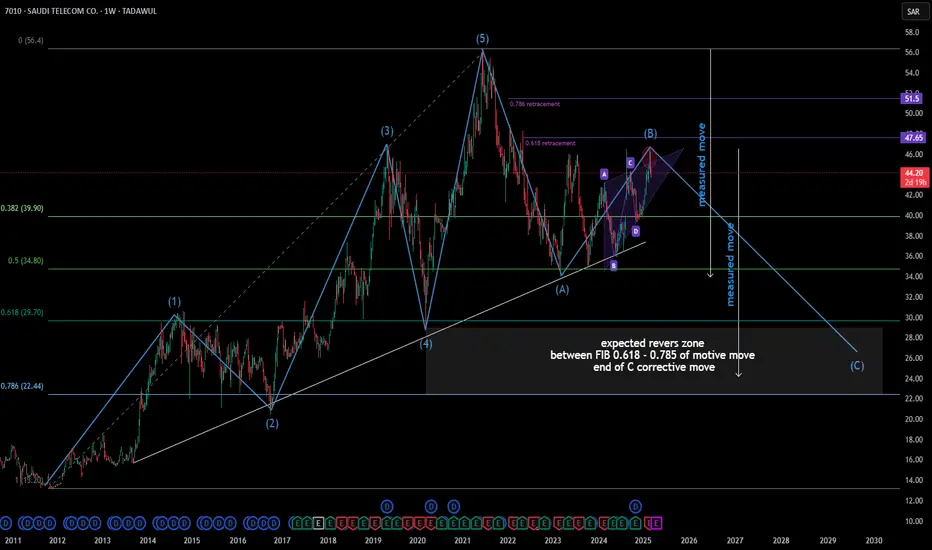
STC Saudi Telecom Weekly chartmotive move 1,2,3,4 and 5 clearly finished
now the market playing A,B and C corrective wave
I draw a zone between 0.618 -0.785 FIB of the motive wave
and compared with measured move
I expect the STC stock price to revers in the zone
good luck trade safe
2360: False Breakdown at Support levels!On the weekly chart, a divergence has formed, while the daily chart shows a false breakdown.

Bearish Divergence on Monthly TF but Bounce ExpectedBearish Divergence on Monthly TF.
Very important Support lies around
160 - 162; and a Bounce is Expected if this level
is Sustained on Monthly Support.
Bullish Divergence on Short TF; so a bounce can be seen
up to 177 & then 194 (if 177 is Sustained)

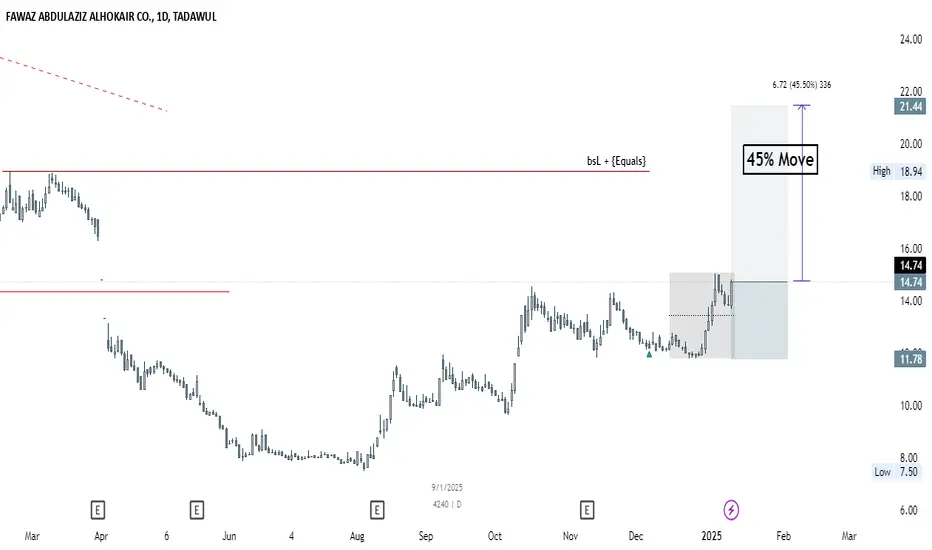
Fawaz Abdulaziz Al Hokair Co 4240 January 2025Trading Setup Overview
Break of Structure (BOS): A strong move upward has likely broken a key structural resistance level.
Target: Equal highs (liquidity zones) are present above, which might act as magnets for price.
Bias: Keep this idea in view for a short-term bullish continuation unless a reversal pattern forms.
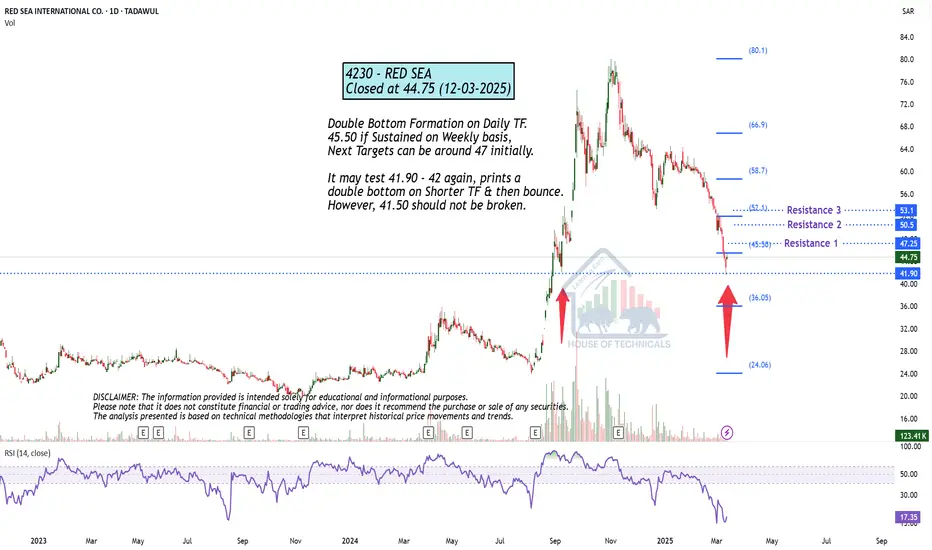
@ Important Support LevelDouble Bottom Formation on Daily TF.
45.50 if Sustained on Weekly basis,
Next Targets can be around 47 initially.
It may test 41.90 - 42 again, prints a
double bottom on Shorter TF & then bounce.
However, 41.50 should not be broken.
Play on Levels124 - 124.50 Very Important Support on Monthly Basis.
Bearish Divergence on Weekly TF that is why it pushed the
price downwards.
Now Hidden Bullish Divergence & Bullish Divergence on Hourly
TF has triggered the price up. Bullish Momentum will resume
once 146 is Crossed & Sustained. Now it is Important to Sustain 134
on Monthly TF & if 165 is Crossed & Sustained, Next Target
can be around 190+
On Daily TF, 134 - 135 is a Resistance. Crossing it will
touch the price around 138-139

6015 IS ABOUT TO GIVE US AN ENTRY TO TAKECouple days ago, I posted that 6015 will come lower to 2.14, if you listened and followed my advice and closed your positions, congrats!
But if you don't and you kept holding, I hope you didn't lose too much of your funds.
For now there's no clear entry to take, we'll keep waiting for the price to give us a proper entry to follow, which I will post a bit late, 2/3d after I share it to my clients so you can see how it goes.
Follow for more!

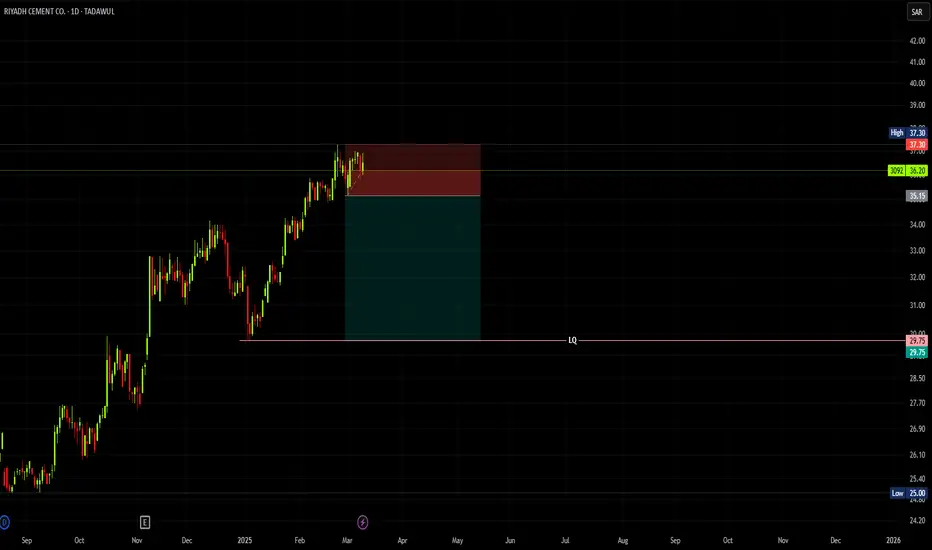
3092 IS GOING BEARISHWhile searching for some trades for my clients to buy, I found this on RIYADH CEMENT tn which the price is giving a reversal point in which it will go at least to 29.75.
If you're holding any profitable shares, you'd better close and enjoy your profits!
Follow for more!
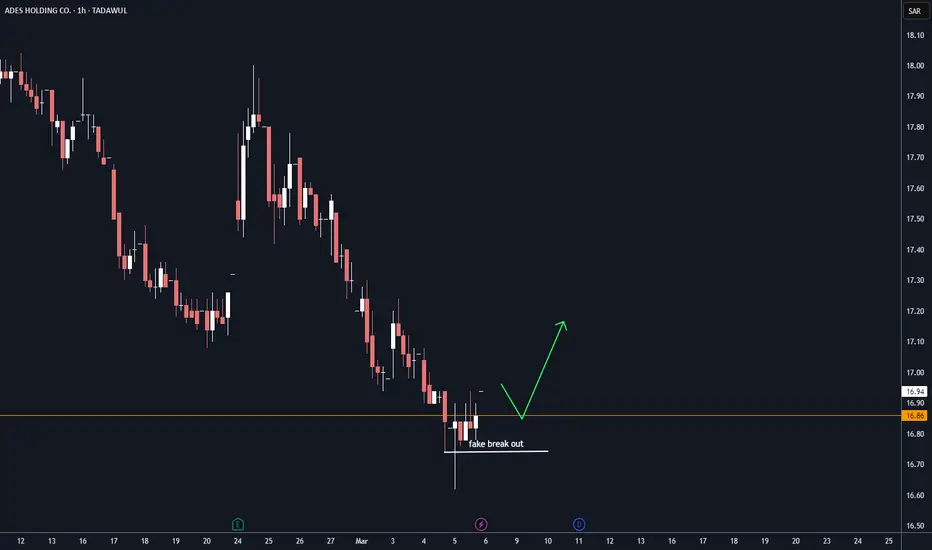
Bullish on 2382 ADES TASI Fake breakout on 1H and close daily above Monthly level (orange line)
Wait for retest and target 17.18 price level
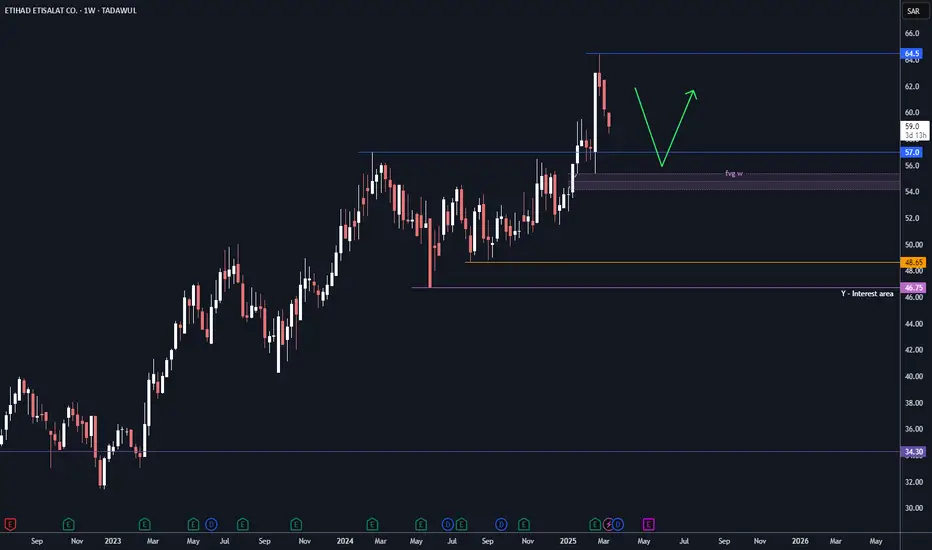
Wait for retrace on 7020 MOBILY TASI Wait for retrace to test old high + Weekly FVG
Then looking for entry
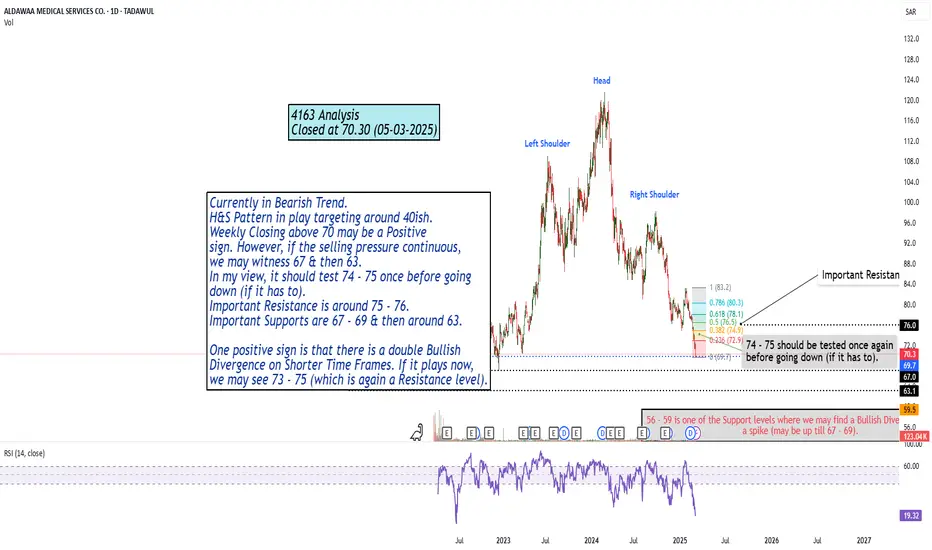
Currently in Bearish Trend. Currently in Bearish Trend.
H&S Pattern in play targeting around 40ish.
Weekly Closing above 70 may be a Positive
sign. However, if the selling pressure continuous,
we may witness 67 & then 63.
In my view, it should test 74 - 75 once before going
down (if it has to).
Important Resistance is around 75 - 76.
Important Supports are 67 - 69 & then around 63.
One positive sign is that there is a double Bullish
Divergence on Shorter Time Frames. If it plays now,
we may see 73 - 75 (which is again a Resistance level).
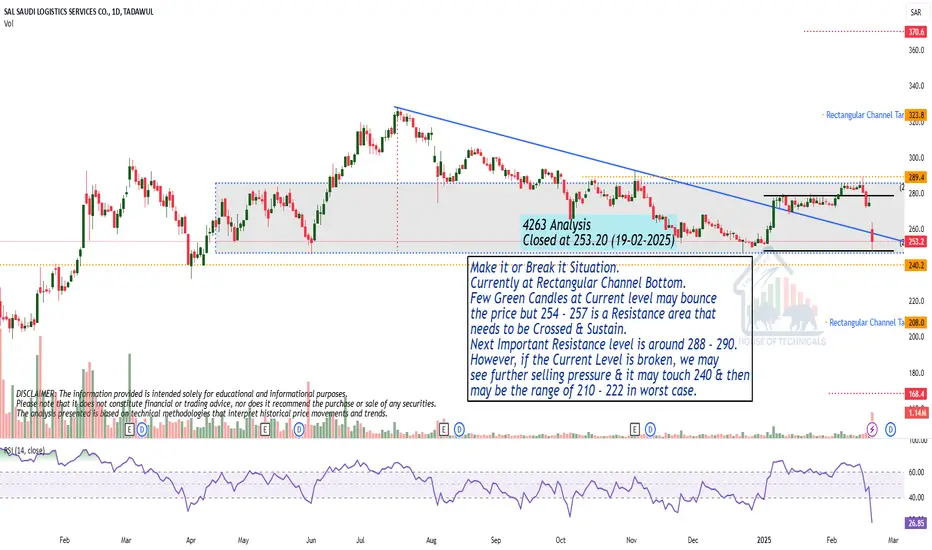
Make it or Break it Situation.
Currently at Rectangular Channel Bottom.
Few Green Candles at Current level may bounce
the price but 254 - 257 is a Resistance area that
needs to be Crossed & Sustain.
Next Important Resistance level is around 288 - 290.
However, if the Current Level is broken, we may
see further selling pressure & it may touch 240 & then
may be the range of 210 - 222 in worst case.
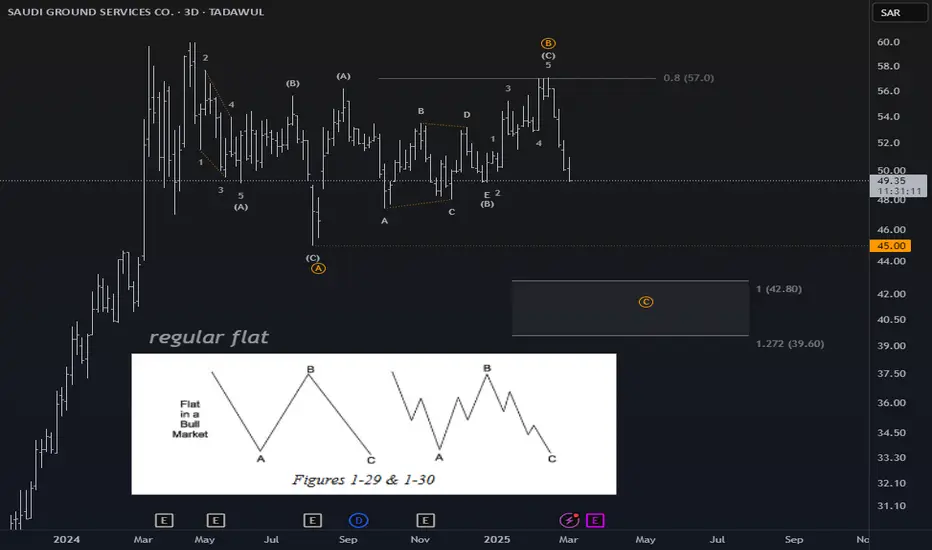
#4031 SAUDI GROUND SERVICES CO.Trading the stock below 57 is not good,
The continuation of momentum in the downward leg means taking this path.
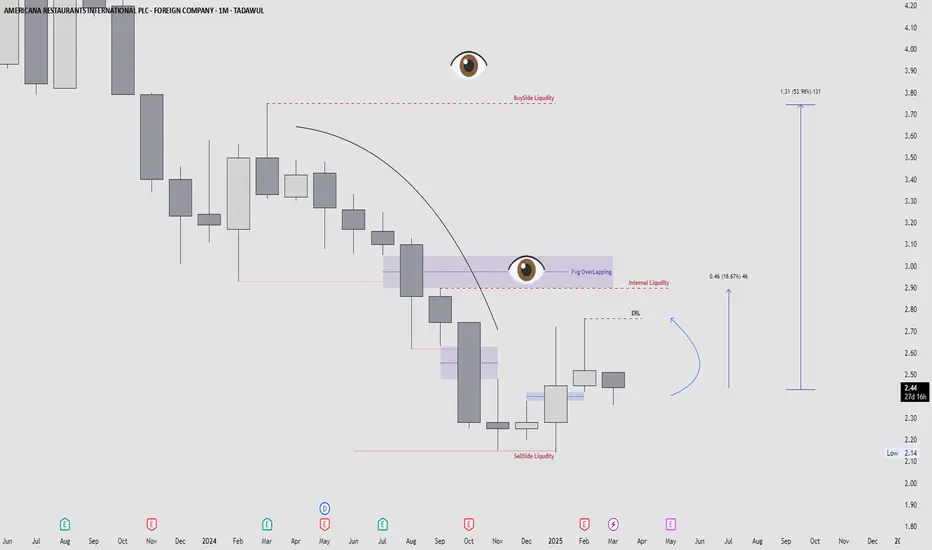
Americana Restaurants International PLC
### **Key Observations:**
1. **Sell-Side Liquidity (SSL) Taken:**
- The price has previously swept the **sell-side liquidity** (lower stop orders), indicating a potential **reversal or accumulation phase**.
2. **Fair Value Gap (FVG) Overlapping:**
- A **bullish FVG** is visible, meaning that price might revisit this area as part of a retracement before continuing upward.
3. **Internal Liquidity Target:**
- The first **internal range liquidity (IRL)** target is around **18.67%** from the current level.
4. **Buyside Liquidity Target:**
- The **major target** is at **53.98%** from the current price, indicating a strong bullish potential move.
5. **Expected Price Movement:**
- If the price respects the **ERL (Equilibrium Range Level)** and does not drop below key liquidity levels, a **bullish continuation** could be expected toward the **FVG** and then toward the **buy-side liquidity**.
### **Potential Trading Plan:**
- **Entry:** Look for confirmation near **internal liquidity** or the FVG area.
- **Target 1:** **18.67% move** toward **internal liquidity**.
- **Target 2:** **53.98% move** toward **buy-side liquidity**.
- **Invalidation:** A break below **sell-side liquidity** could invalidate the bullish setup.
This setup suggests a possible **bullish market structure shift** if the price holds key liquidity levels. 🚀
Morning Star formation on Daily TF but..Morning Star formation on Daily TF.
Monthly Closing above 29 would be a Positive Sign.
However, 28 - 29 can be a Good Support Zone.
28.50 should not be broken, otherwise further
Selling Pressure can be witnessed.
On the flip side, 32 - 32.50 is an Important Resistance.
However, only Morning Star formation is not enough, because
it is currently at Strong Resistance around 32 - 32.5, so
let it sustain this level.
Sustaining this level may give 2-4 riyals gain.

NOT A GOOD TIME TO BUY 4007If you have a look at the chart, you'll see that the price started going higher and higher since Dec 2024, grabbed the liquidities we have at 41.80 and 44.35, to give us a confirmation of a reversal right on the liquidity at 44.35.
Today the price grabbed the LQ we have at 41.80, and it will keep pushing down to 37.90 before giving us an entry to take.
For now, if you still haven't bought, you just wait. And if you already holding any shares, you can tell me in the comment section your entry so I can give you some help in your situation.
Follow for more!

6015 IS STILL GOING BEARISH DONT BUYAs you can notice on the chart, the price is still pushing bearish since Sept 2023 where it gave us the ATH.
In Jan 2025, it did a quick jump towards the LQ to grab it, and now ir is coming down towards the LQ level at 2.14, the least point we'll expect the price to reach is 2.19 where we have our OB.
Anything that than is just a wish.
NB: I follow the things I have in front of me on the chart combined with the Fundamentals. So please if you have any other POV you can discuss it politely.
Follow for more!

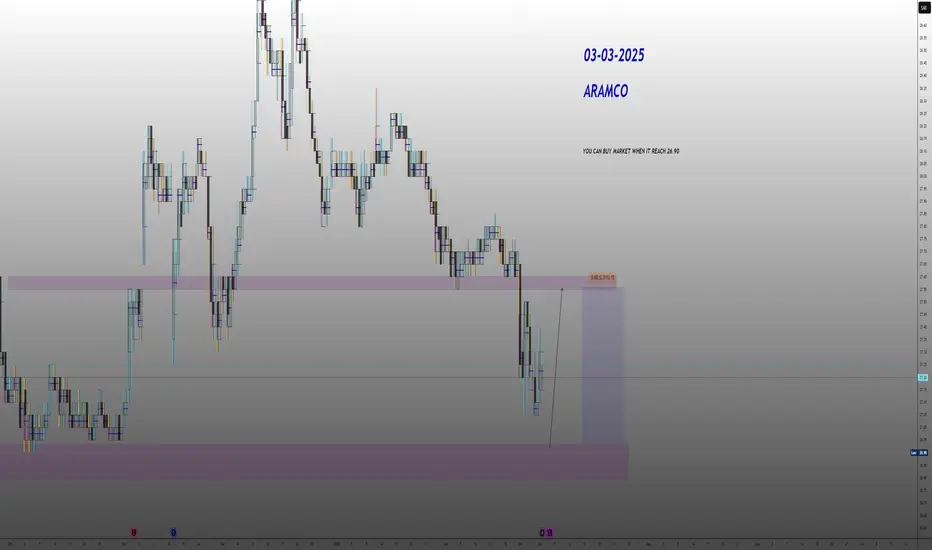
aramco 03-march-2025dear investors and traders we see market was in down trend since december 2024 price now reach a very strong support and i recommand you to buy this action when he reach 26.90$ next correction will be at 27.55$ its 2.31% see u later [
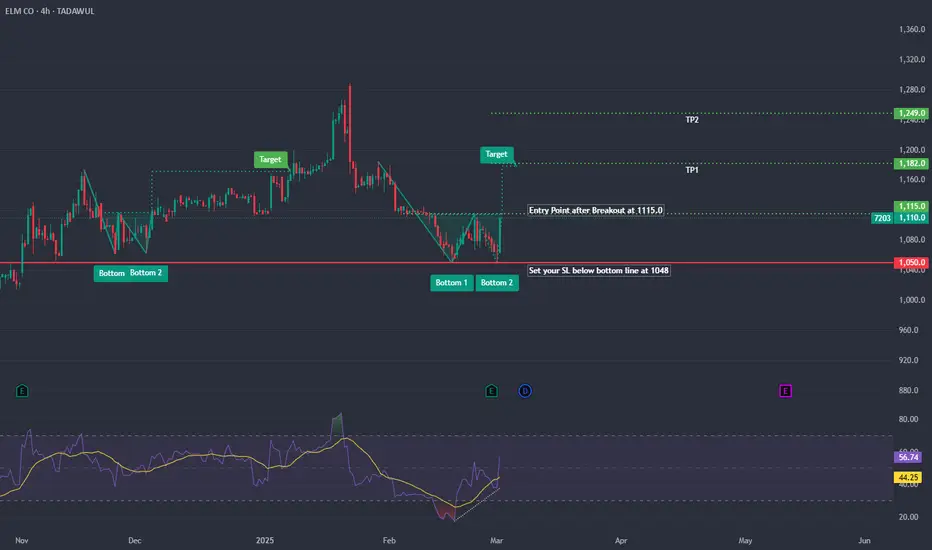
ELM (TADAWUL: 7203) - Double Bottom Breakout SetupThe price action on the 4-hour chart of ELM CO (TADAWUL) has formed a double bottom pattern, signaling a potential bullish reversal.
Trade Idea:
A breakout above 1115.0 confirms the double bottom pattern.
Risk management is crucial – placing SL below bottom at 1048 to ensures controlled risk.
Key Levels:
Neckline Breakout: 1115.0 (Entry Point)
TP1: 1182.0
TP2: 1249.0
Stop Loss : 1048
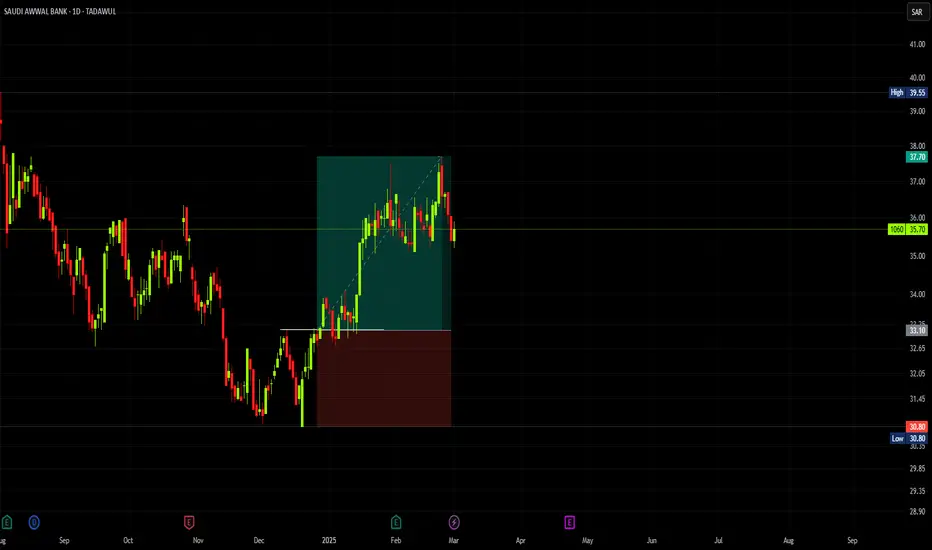
TARGET FILLED ON 10602 months ago, I posted to buy 1060, and the stock reached our TP couple days ago for a profit of 200% invested amount.
This is an example of the trades I share to my students and clients.
For further questions don't hesitate to ask!
Follow for more!
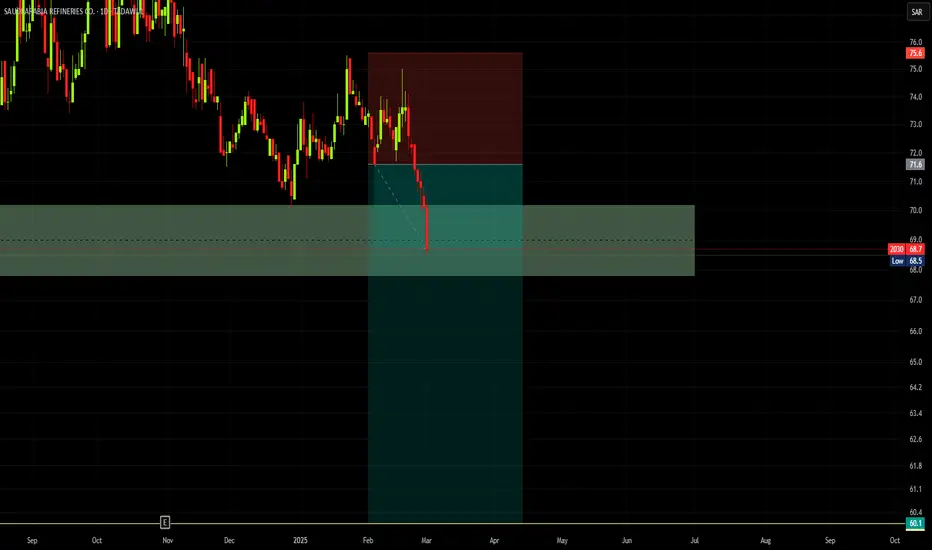
2030 IS STILL GOING BEARISH 2030 is one of the stocks people want to buy, but to do it in the current time is a wrong decision to make, since as you can see, it kept pushng lower and lower since Sep 2023.
For now, before we can take a small trade on it, we must wait for the stock to take the LQ we have in the level 60.1. As soon as it's done, we will search to see if we have our entry point to follow it.
For any further questions don't hesitate to ask!
Follow for more!
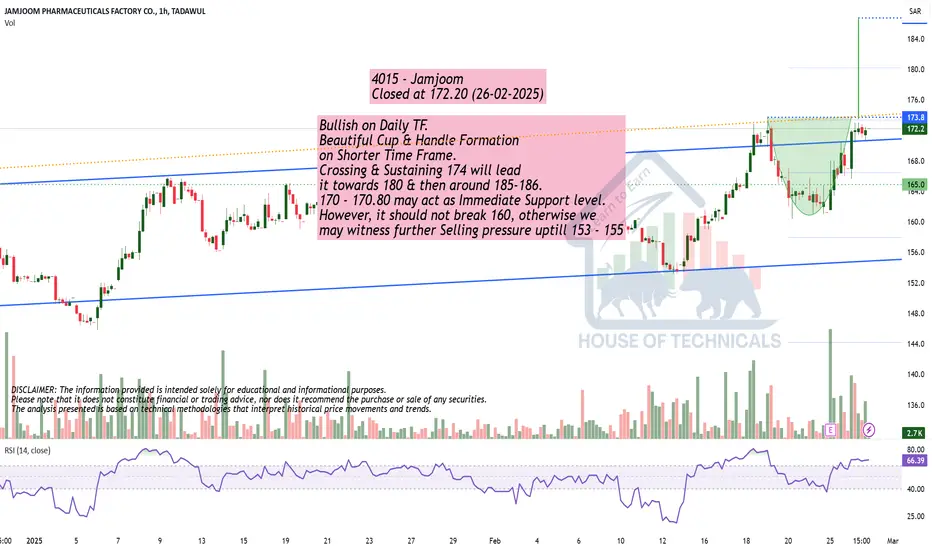
Bullish on Daily TF.Bullish on Daily TF.
Beautiful Cup & Handle Formation
on Shorter Time Frame.
Crossing & Sustaining 174 will lead
it towards 180 & then around 185-186.
170 - 170.80 may act as Immediate Support level.
However, it should not break 160, otherwise we
may witness further Selling pressure uptill 153 - 155