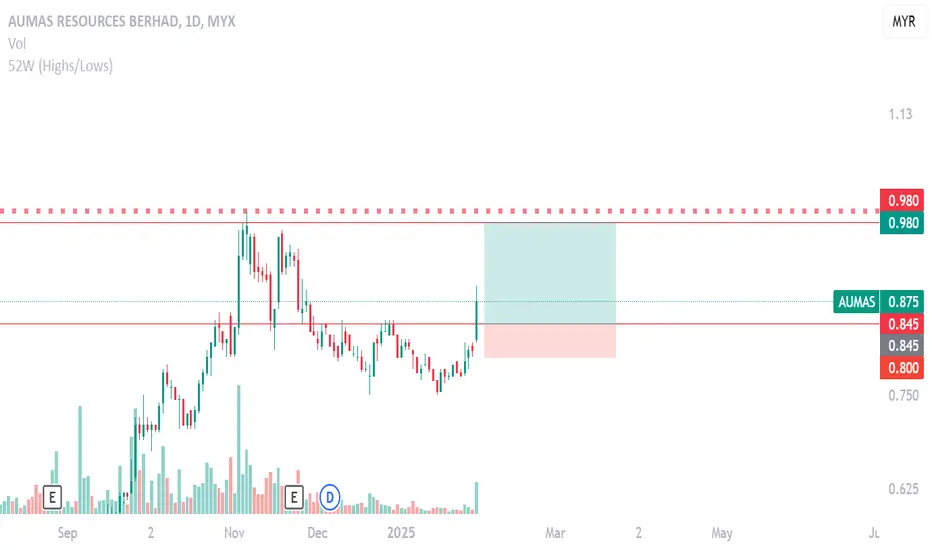
AUMAS GIVE NICE VOLUME AND JUST BREAKOUT THE RESISTANCEThis Weekly FORECAST
Opportunity for AUMAS. This setup is my trading idea/plan, if you want to follow: trade at your own risk (TAYOR).
Risk Factors:
1. Market conditions, unexpected news, or external events could impact the trade.
2. Always use risk management strategies to protect your capital.
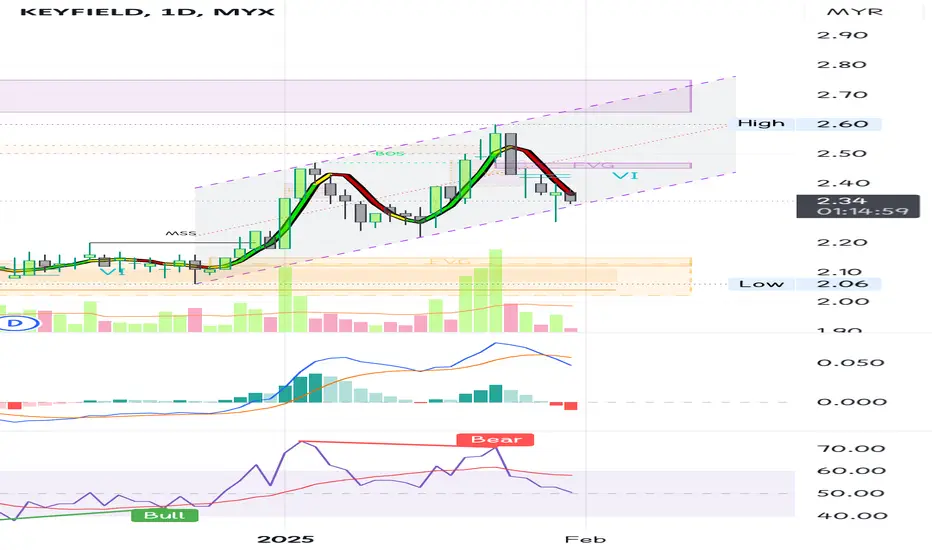
KEYFIELD... Potential support?Could there be a rebound at the trendline?
MACD is in a death cross, and negative divergences are present. Protecting the downside is essential.
When the market moves where, and how, and if - these are all unknown. The only thing which we can control is our risk. Focus on risk management!
Keep the long term vision.
Disclaimer: The mentioned stocks are based solely on personal opinions for educational and discussion purposes only. There are no buy or sell recommendations. Trading involves financial risk, and you are responsible for your own decisions. The author shall not be responsible for any losses or lost profits resulting from investment decisions based on the information contained herein.
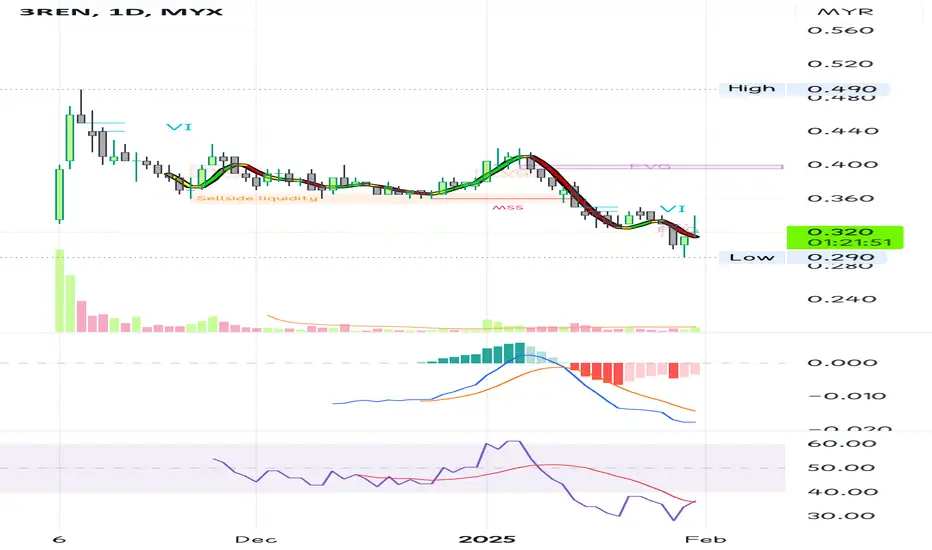
3REN... oversold is a good entry??Waiting for the MACD golden cross.... it's just a matter of time. Patience is key!
The price is still below the moving average, so we need it to stay above for confirmation.
If got nothing to buy, dont buy anything
We cannot control how much we win. But we can control how much we lose. Focus on what you can control!
Disclaimer: Please be informed that all stock picks are solely for educational and discussion purposes; they are neither trading advice nor an invitation to trade. For trading advice, please consult your remisier or dealer representative.
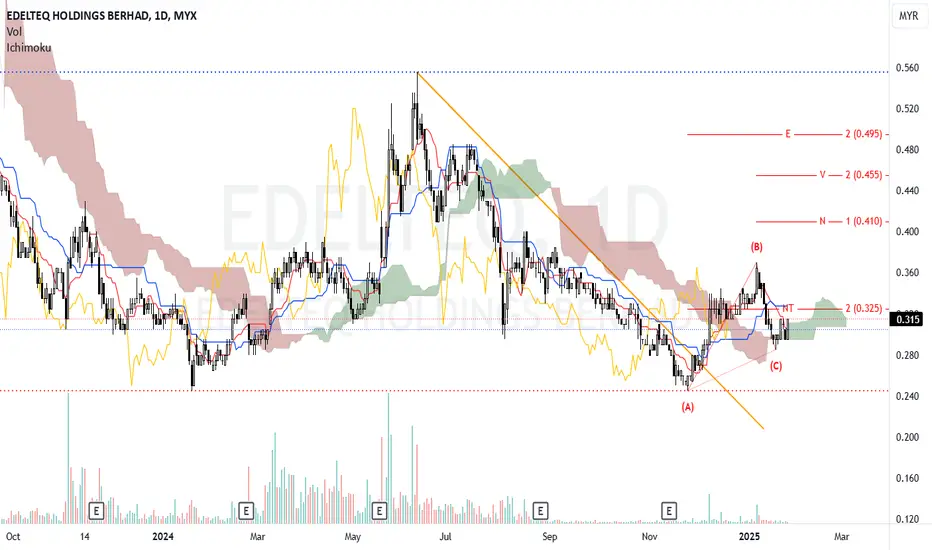
EDELTEQ - Looking for bullish sentiment.N wave with E, V, N & NT projection.
The price is currently at 0.315 and is above the Kumo, signaling a potential bullish sentiment. However, the cloud appears thin, indicating uncertainty.
The Kumo is green, suggesting a supportive environment for upward movement, though caution remains due to proximity to key resistance levels.
But Tenkan-sen is below Kijun-sen, it typically indicates bearish sentiment in the market. Watch for scenarios where the Tenkan-sen crosses above the Kijun-sen, which can signal a potential shift from bearish to bullish sentiment. This crossover would indicate that recent price movements are starting to gain strength
NT at 0.325 serves as immediate resistance. Confirm a breakout above NT for stronger validation.
0.290 acts as immediate support; a drop below this may indicate bearish reversal.
Look for bullish candlestick patterns or a close above the cloud, which would indicate the continuation of bullish momentum.
Note:
1. Analysis for education purposes only.
2. Trade at your own risk.
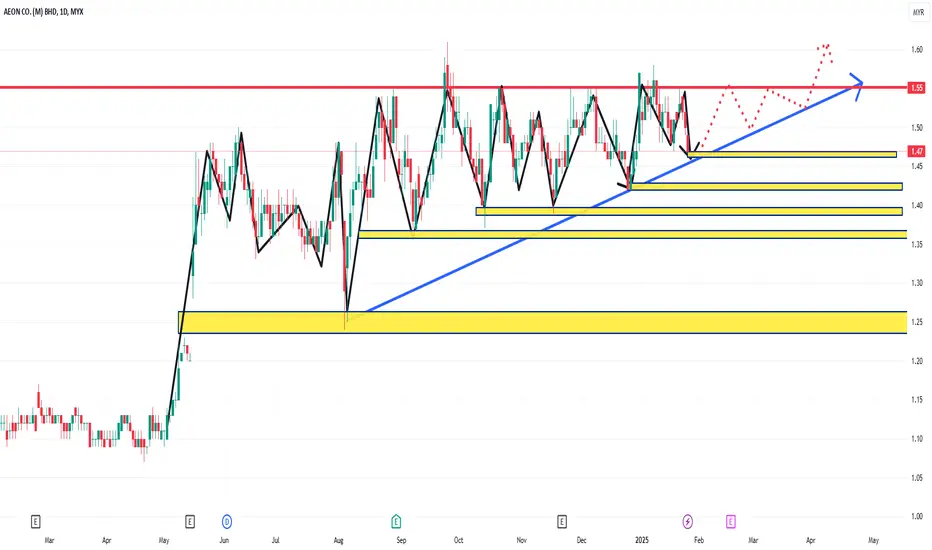
6599 AEON.CO(M)BHD TIME FRAME DAILY 1 YEARS It Is Patten Ascending Triangle ?
Waiting To Breakout ?
Resistant area at price RM1.550(4 TIMES TOUICH PRICE RM1.550).
Support area at price RM 1.470.
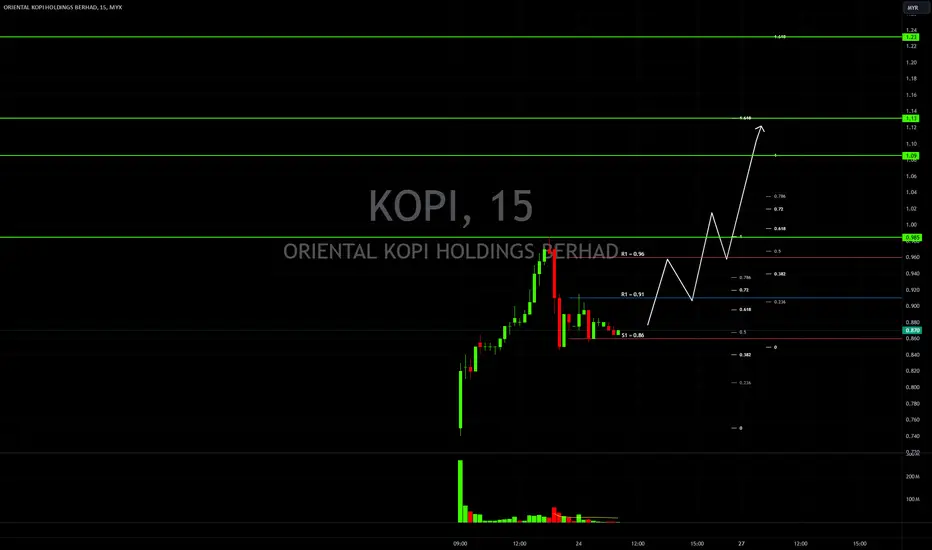
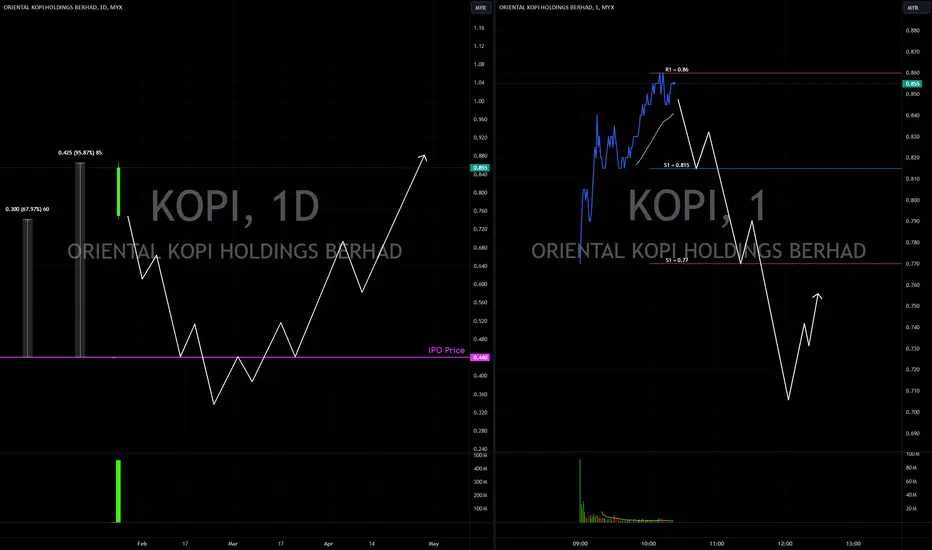
Oriental KOPI Day 2 - RM1.000+Lets see if this plays out. On 5 minute TF, looks like Wave 1 to 5 and ABC have been completed. On a bigger TF, the next move from here could be Primary Wave 3.. could TP at around 1.100+ at Fibo 1.618 area
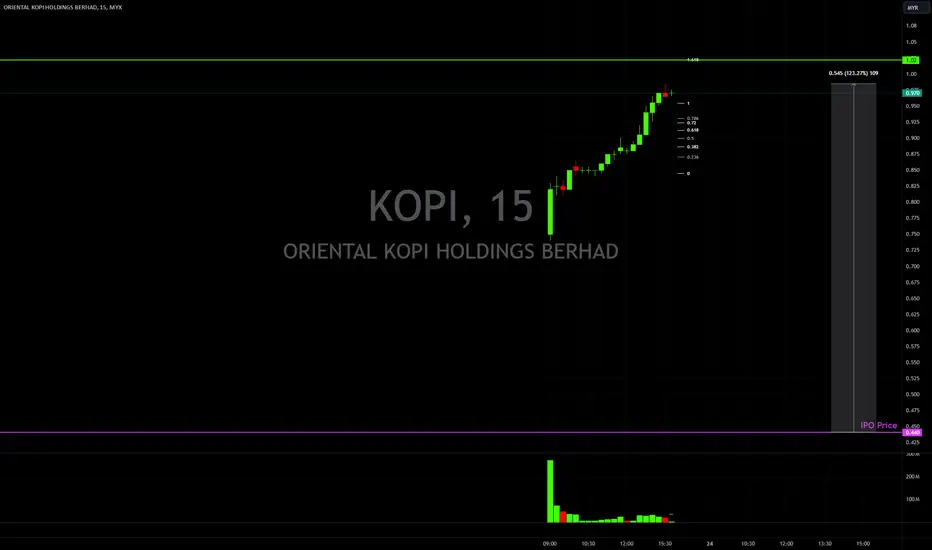
Oriental KOPI Heading to RM1.020 on Debut?Price keeps moving up on IPO debut with not much volume.. how long before the dump? Perhaps closing at 1.020 on debut?
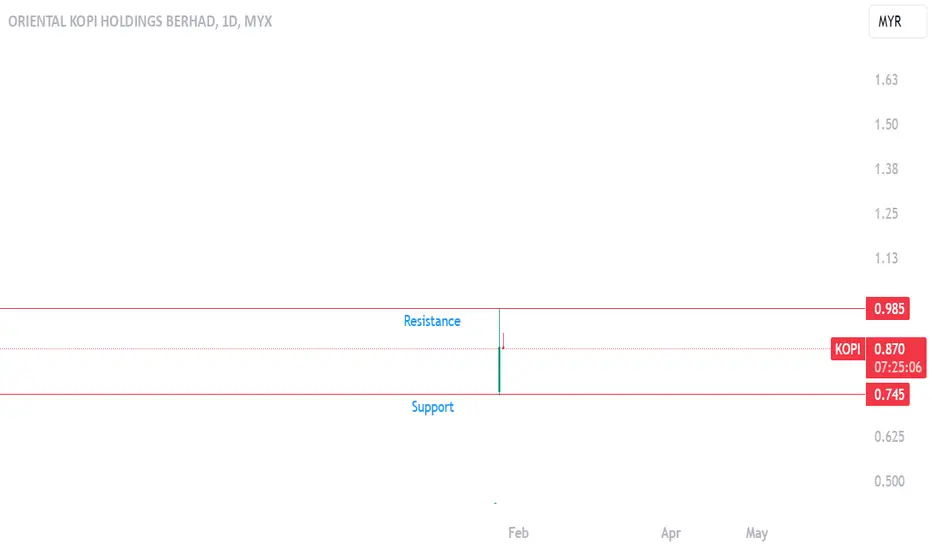
LETS MAKE A WATCHLIST FOR KOPI ORIENTALThis FORECAST future
Opportunity for KOPI. This setup is my trading idea/plan, if you want to follow: trade at your own risk (TAYOR).
Risk Factors:
1. Market conditions, unexpected news, or external events could impact the trade.
2. Always use risk management strategies to protect your capital.
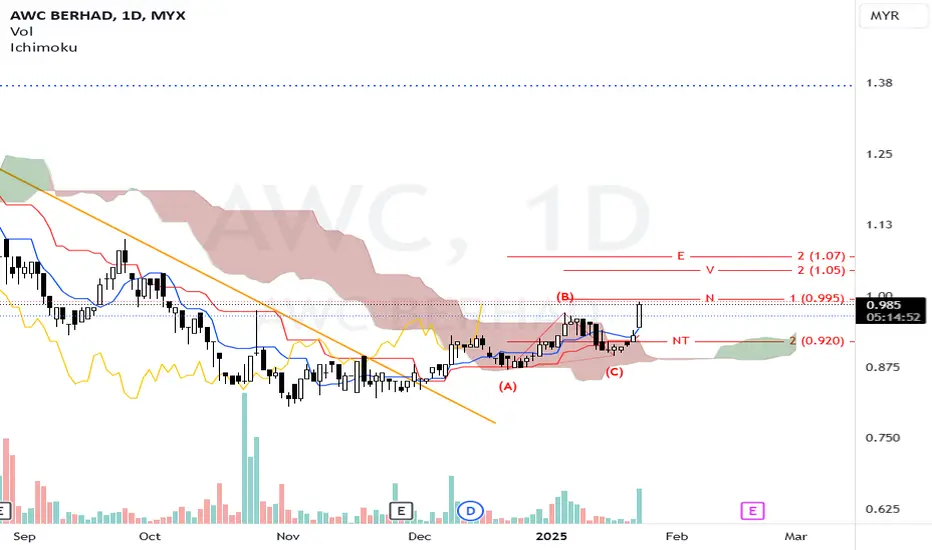
AWC - Analysis on price movementN wave with E, V, N & NT projection.
Price Position: The price is currently above the Kumo, a bullish indicator suggesting positive momentum.
Tenkan-sen is above the Kijun-sen, reinforcing a bullish outlook.
The cloud being green signifies a favorable environment for long positions.
N at 0.995: A near-term resistance target providing insight into trade exits.
NT at 0.920: Serves as a critical support level; a drop below this would signal a shift in market sentiment and potential trend reversal.
Look to enter a long position around the current price of 0.960 or on a confirmed breakout above the N level at 0.995 with significant volume.
Confirmation: Seek bullish candle formations or significant upward movement in volume to validate the buy decision.
Set a stop-loss at 0.910, below the NT support level, to protect against adverse market movements.
Volume Analysis: Pay attention to volume trends, particularly during upward movements. Increased volume will bolster the bullish case.
Market Sentiment: Monitor broader market conditions and news affecting AWC and the construction or engineering sectors.
Risk Management: Adjust position sizes according to risk tolerance and overall market volatility.
Note:
1. Analysis for education purposes only.
2. Trade at your own risk.
Oriental Kopi. Good Debut, but I'm waiting for it dropIf previous IPOs are a go-bys, I'll be waiting at the bottom of the "Cup" for my entry
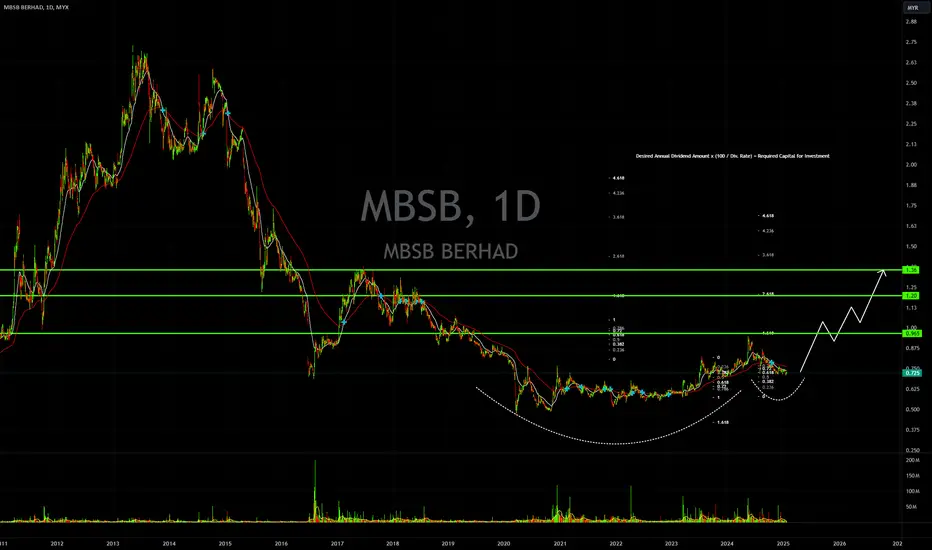
MBSB Cup & Handle Formation in the MakingShort term MBSB could be heading to support area around 0.700
If Cup and Handle pattern forms, TPs are the greenline marked on the chart.
Dividends have been good from this stock, plus it's a Banking stock.. with interest rates stable and potentially going down from here, loans are going to be cheaper and banks profit will grow Q-on-Q. It's also one of the only two Banking stocks that are Shariah Compliant.
I am looking to add position at 0.690 (support area) and keep it on my portfolio long term.
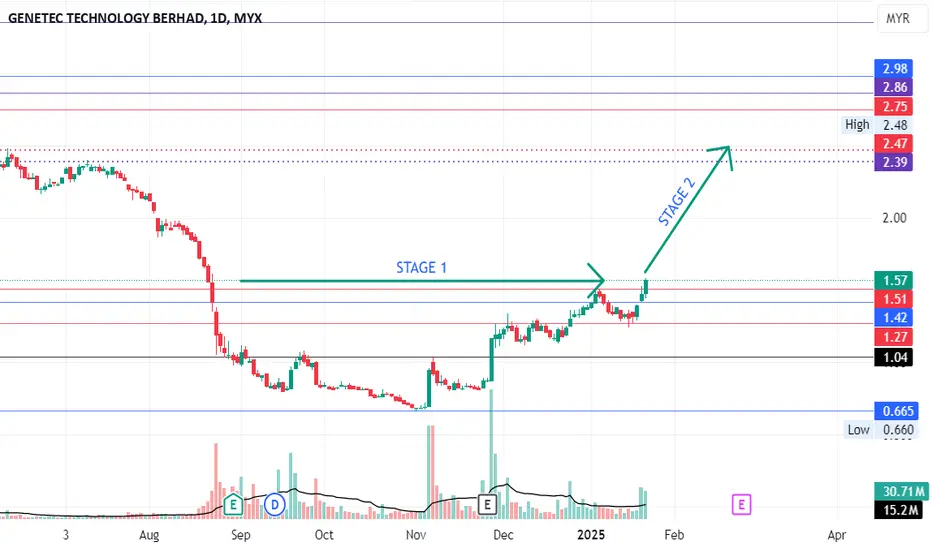
GENETEC 2025 WILL BE OUR TODAY 21/1/2025 price closed RM1.57
already break RM1.51.
This is valid Stage 2..
just buy and close your eyes haha
HapSeng finger looking good
Volume on reaction diminished
low demand breaks previous reaction
Bag holding?

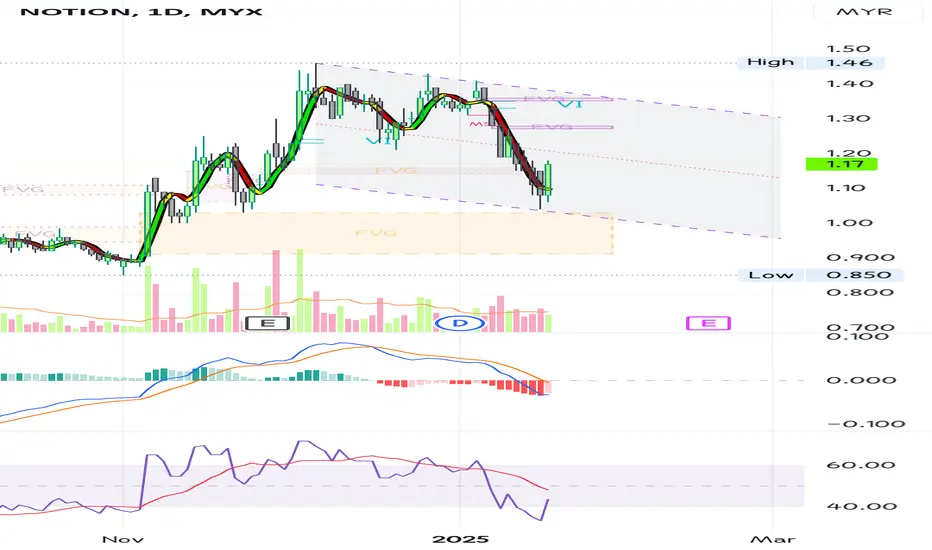
NOTION, worth to risk?Has the operator started dumping? This could be contributing to the current market pressure.
The MACD is still showing a bearish crossover (DC), which suggests the market may be following a FIFO (first in, first out) pattern for now.
There are also several resistance levels ahead that could pose challenges for any potential upward movement.
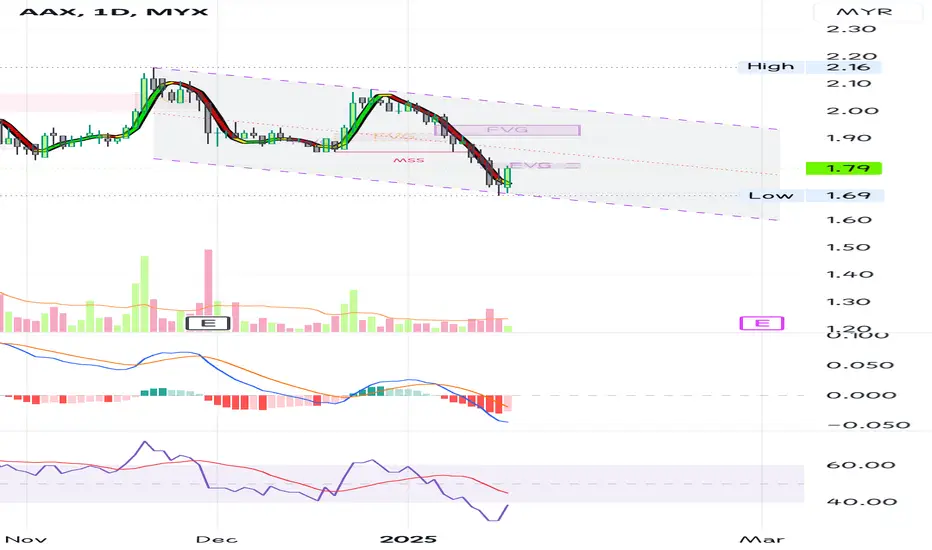
AAX, can fly high?The price needs to stay above 1.85 to reverse the bearish trend.
Both the daily and weekly MACD charts are showing a bearish crossover (DC).
Meanwhile, the RSI remains in oversold territory, which is an area I’m hesitant to risk my capital in.
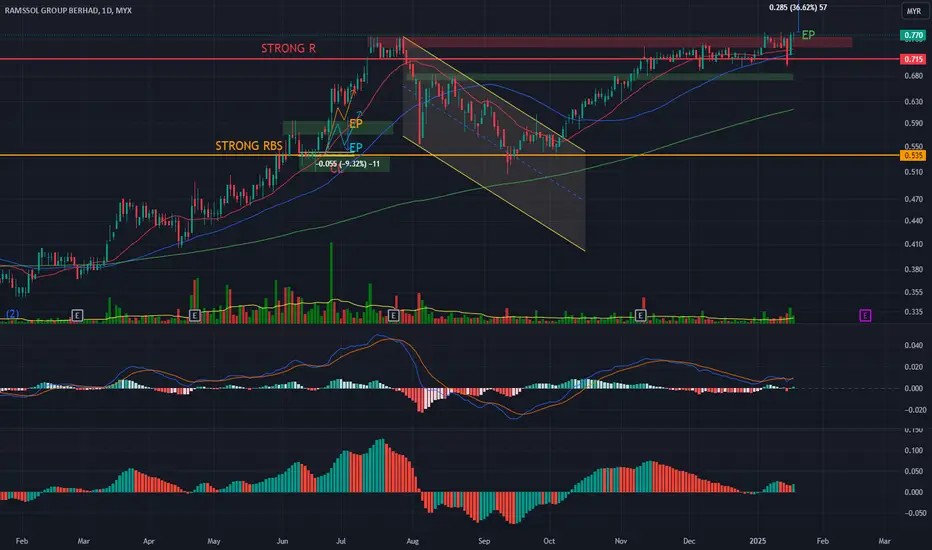
Tehcnical Analysis - RAMSSOL1. Price candle has breakout consolidation area, now maintain above strong resistance line.
2. EP possible right now and keep track the price action against KLCI Index.
3. This technical analysis utilize MA line+EW+Fibo+trendline
Technical Analysis - WCT1. Price candle has move downtrend, now touch MA200 line. To complete sub-wave 4.
2. EP possible when price candle break the downtrend line to target sub-wave 5.
3. This technical analysis utilize MA line+EW+Fibo+trendline

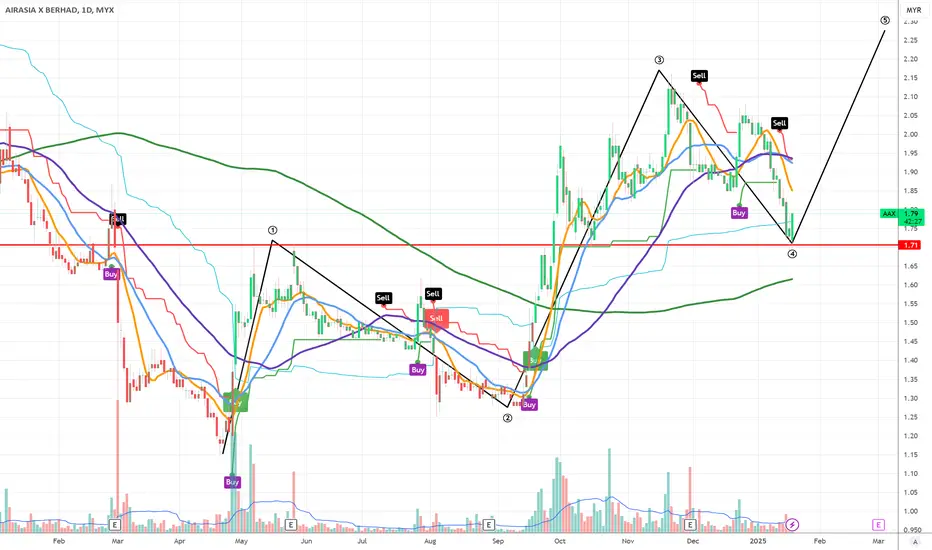
AAX provide GOLDEN opportunity - end of wave 4?wave 4 will not overlap with wave 1
profitable quarter report
MYX:AAX SETUP | BULLISH
Price has formed a potential bottom at key support level of 1.71. We can observe:
1. Multiple technical bounces from this support level historically
2. Recent selloff reached oversold conditions
3. Formation of bullish candlestick patterns near support
4. Major moving averages starting to converge in this zone
TRADE IDEA:
- Entry: Current levels (1.79)
- Stop Loss: Below 1.71 support
- First Target: Previous resistance at 2.00
- Second Target: Recent high at 2.15
Risk:Reward ratio approximately 1:3 if targets are reached. Wait for confirmation of reversal with strong volume and bullish price action before entering.
#AAX #MYX #TechnicalAnalysis
Remember to always manage your position size and risk accordingly. This is not financial advice.
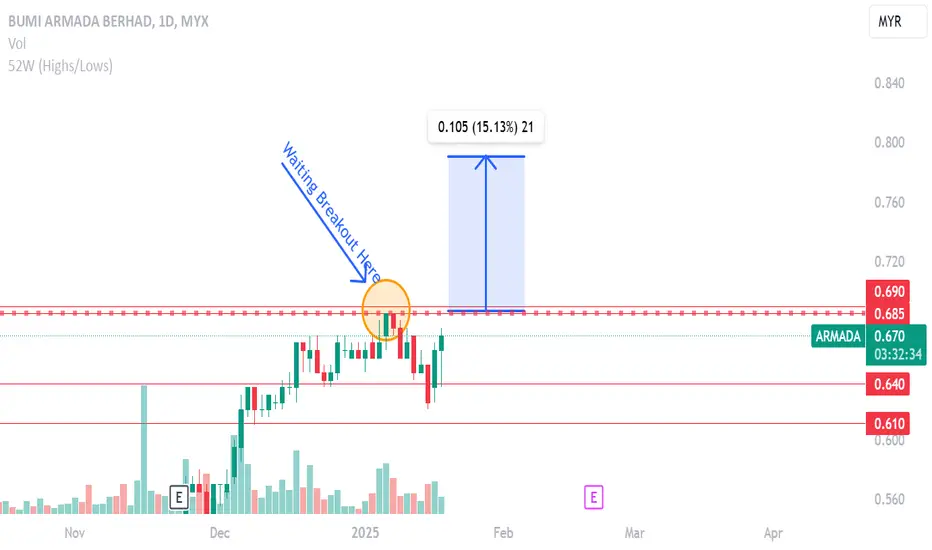
ARMADA WAITING BREAKOUT AND GOOD VOLUMEThis Weekly FORECAST
Opportunity for ARMADA. This setup is my trading idea/plan, if you want to follow: trade at your own risk (TAYOR).
Risk Factors:
1. Market conditions, unexpected news, or external events could impact the trade.
2. Always use risk management strategies to protect your capital.
NOTION AT WATCHLISTThis Weekly FORECAST
Opportunity for NOTION. This setup is my trading idea/plan, if you want to follow: trade at your own risk (TAYOR).
Risk Factors:
1. Market conditions, unexpected news, or external events could impact the trade.
2. Always use risk management strategies to protect your capital.

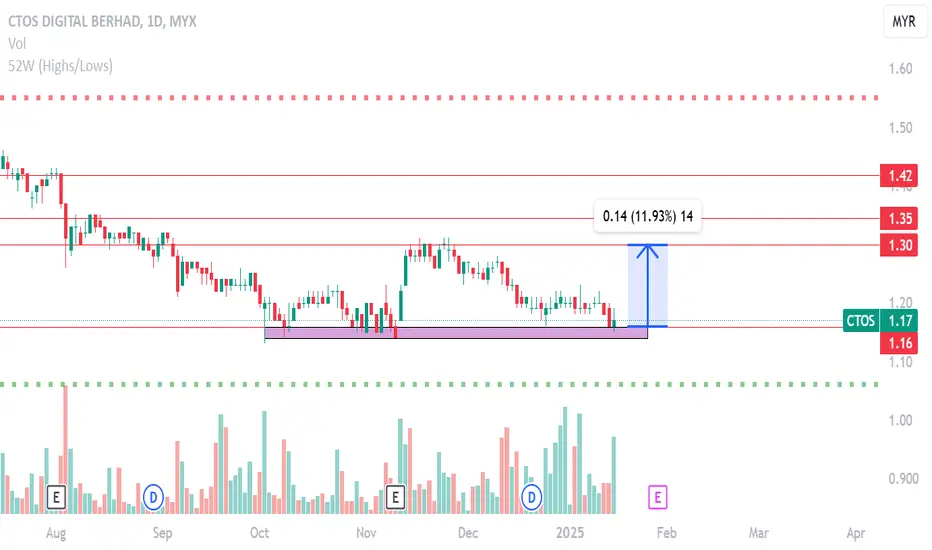
CTOS COUNTER TO SEE AND STUDYThis Weekly FORECAST
Opportunity for CTOS. This setup is my trading idea/plan, if you want to follow: trade at your own risk (TAYOR).
Risk Factors:
1. Market conditions, unexpected news, or external events could impact the trade.
2. Always use risk management strategies to protect your capital.
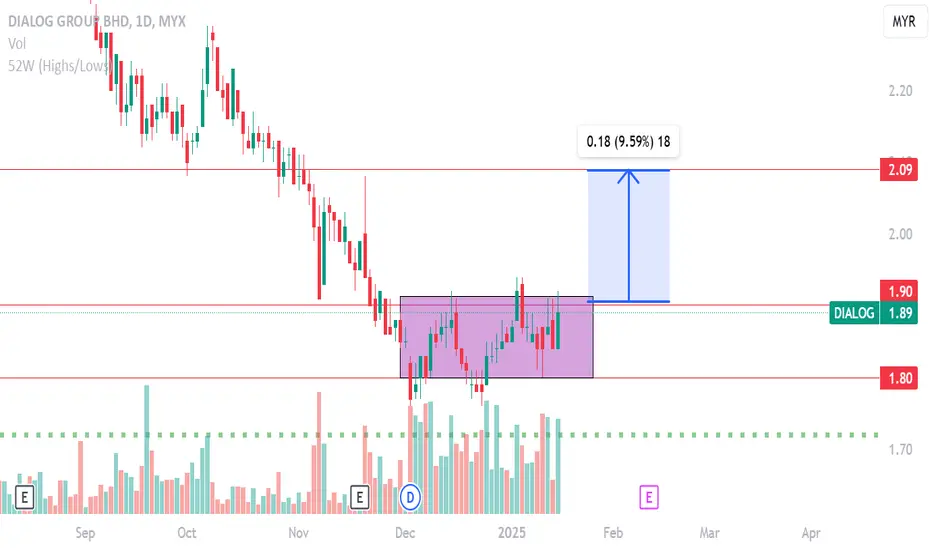
DIALOG WAITING FOR BREAKOUT AND VOLUMEThis Weekly FORECAST
Opportunity for DIALOG. This setup is my trading idea/plan, if you want to follow: trade at your own risk (TAYOR).
Risk Factors:
1. Market conditions, unexpected news, or external events could impact the trade.
2. Always use risk management strategies to protect your capital.