MAHSING
ATH RM2.25 IN 2025?
Look strong to move up this year.
but you have to monitor rm1.97 with volume
you got price 1.70-1.80 is very nice
3/1/2025 charting - asyraf

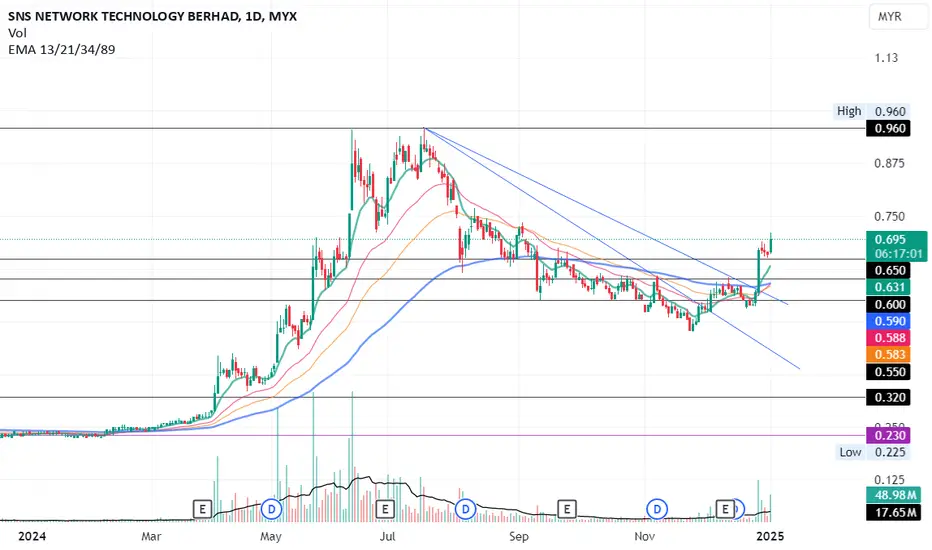
SNS IDEASI hope people dont chase the price.
i strongly will wait the retracement 560-580
but for the short term trader will play within
650-700
This counter is on my best watchlist
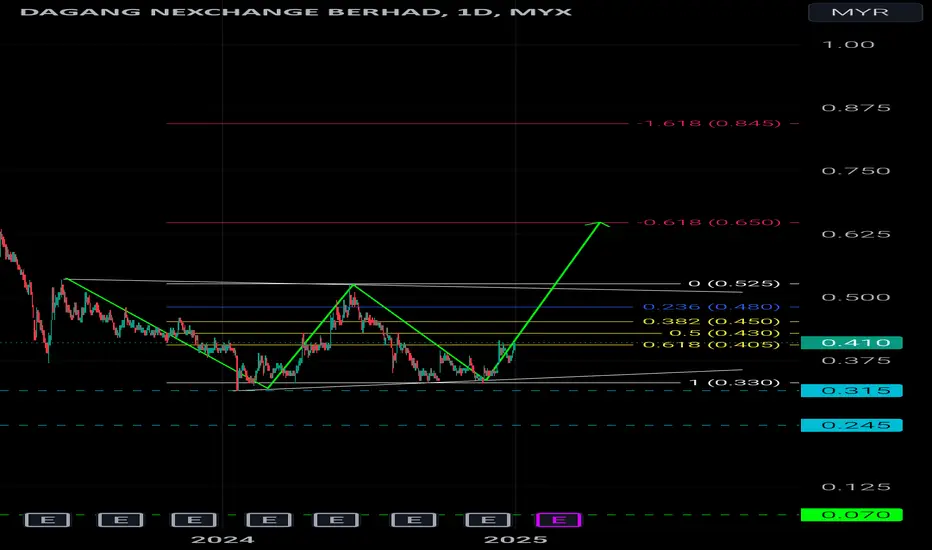
DNEX- "Last Dance Bottom"W pattern + Fibo prediction as per chart on Daily timeframe.Base on technical analysis it would become to turn Bullish Factor.
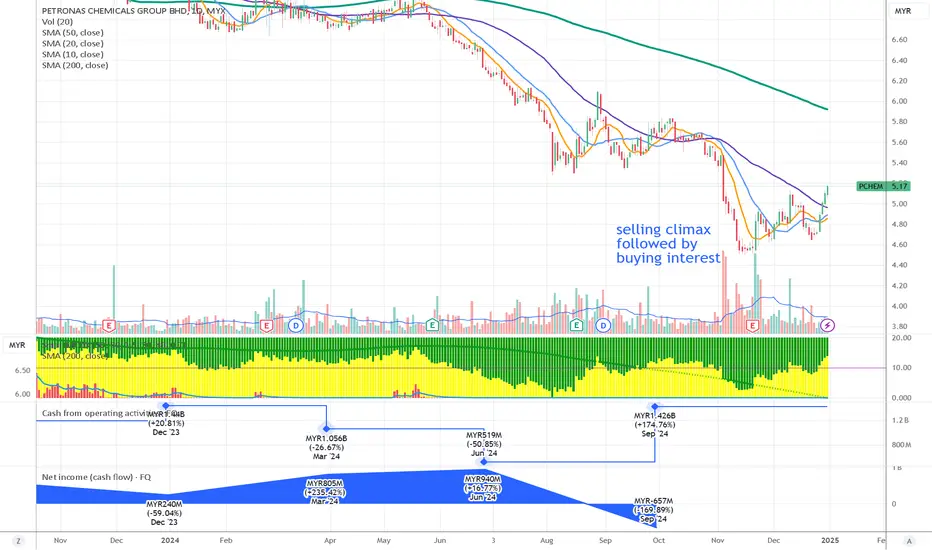
PCHEM already factored in the NEGATIVES? window dressingLooking at the chart for Petronas Chemicals Group Berhad, here's my analysis:
Current Price Action:
- Trading at RM5.08, down 8.04%
- Currently showing potential bottoming pattern
- Below all major moving averages (SMAs 10, 20, 50, 200)
Technical Analysis:
1. Moving Averages:
- SMA 10: 5.47
- SMA 20: 5.56
- SMA 50: 5.61
- SMA 200: 6.32
- All MAs in bearish alignment suggesting strong downtrend
2. Volume Analysis:
- Significant volume spike noted during recent selling climax
- Volume: 19.15M shares
- Recent buying interest emerging on volume
Key Events:
- September 2024: MYR1.426B (+174.76%)
- June 2024: MYR519M (-50.85%)
- Net income showing decline: MYR-657M (-5109.89%) in September
Price Structure:
- Long-term downtrend from RM6.60 levels
- Recent selling climax followed by accumulation
- Potential inverse head and shoulders pattern forming
Trading Considerations:
- Watch for break above RM5.40 for trend reversal
- Support building around RM4.80
- Risk management crucial given high volatility
- Need to see price back above moving averages for bullish confirmation
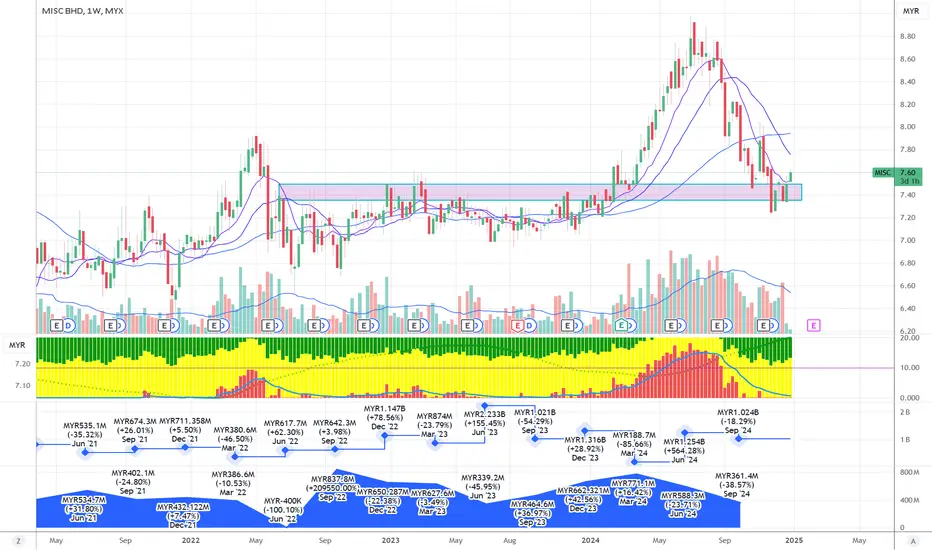
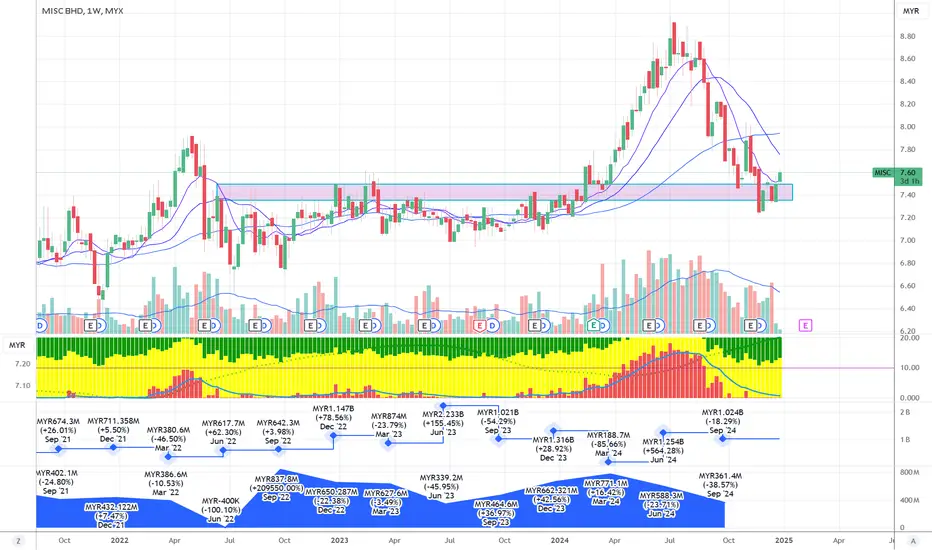
will MISC rebound after Window DressingLooking at the chart for MISC Berhad, here's my analysis:
Current Price Action:
- Trading at RM7.08, up 1.29%
- Currently testing key support level
- Price below major moving averages suggesting bearish pressure
Technical Analysis:
1. Support/Resistance:
- Critical support zone around RM7.40 (highlighted in pink)
- Major resistance at RM8.00-8.20 (recent peak)
- Previous support at RM7.60 now acting as resistance
2. Moving Averages:
- All moving averages trending downward
- Price trading below all major MAs
- Death cross formation (short-term MA below long-term MA)
Volume Analysis:
- September 2024: MYR1.024B (-8.29%)
- Recent volume spike on selloff
- Money flow indicator showing distribution phase
Key Events:
- June 2024: MYR1.254B (+564.28%)
- March 2024: MYR188.7M (-85.66%)
- Significant decline from recent highs around RM8.80
Trading Considerations:
- Currently in downtrend
- Key level to watch is RM7.40 support
- Break below support could target RM7.00
- Need to see price back above MAs for bullish reversal
will AXIATA going forward 2025 due to Window dressingLooking at the chart for Axiata Group Berhad, here's my analysis:
Current Price Action:
- Trading at RM2.49, up 4.18%
- Breaking out from recent resistance level
- Price moving above all major moving averages
Technical Analysis:
1. Support/Resistance:
- Strong support zone around RM2.20-2.30 (highlighted in purple)
- Previous resistance at RM2.40 now likely to act as support
- Overhead resistance around RM2.60 (previous swing high)
2. Moving Averages:
- All moving averages beginning to turn upward
- Price recently crossed above all MAs
- Potential golden cross forming (short-term MA crossing above long-term MA)
Volume Analysis:
- Recent volume spike supporting the breakout
- September 2024: MYR2.379B (-14.97%)
- Money flow indicator showing improving buying pressure
Notable Price Events:
- March 2024: MYR2.105B (-16.85%)
- June 2024: MYR2.797B (+32.88%)
- Consistent base formation over several months
Trading Considerations:
- Breakout above RM2.40 suggests bullish momentum
- Stop loss could be placed below support at RM2.30
- Initial target at previous resistance RM2.60
- Risk/reward appears favorable at current levels
MICROLN after disposed by OMESTI - announced severe LOSSseems like a reversal to happen
Looking at the chart for Microlink Solutions Berhad, here's my analysis:
Current Price Action:
- Trading at RM0.240, up 11.63%
- Recently broken above downtrend resistance
- Showing signs of trend reversal after extended decline
Technical Analysis:
1. Moving Averages:
- Price crossed above all major moving averages
- Moving averages beginning to turn upward
- Golden cross formation developing (short-term MA crossing above long-term MA)
2. Support/Resistance Levels:
- Immediate support at RM0.220 (recent breakout level)
- Next resistance around RM0.280 (previous support turned resistance)
- Major support at RM0.120 (recent low)
Volume Analysis:
- Notable increase in volume supporting the reversal
- September 2024: MYR3.033M (+172.03%)
- Green volume bars indicating strong buying pressure
Key Events and Figures:
- MYR-81.114M (-51561.98%) in September 2024
- June 2024: MYR-4.94M (-81.24%)
- Recent volume spike suggesting institutional interest
Trading Considerations:
- Breakout from downtrend suggests potential trend reversal
- Stop loss could be placed below RM0.200
- Initial target at previous resistance RM0.280
- Risk management crucial given historical volatility

SENDAI will it reach 1.05?Looking at the chart for Eversendai Corporation Berhad, here's my analysis:
Current Price Action:
- Trading at RM0.685, up 3.79%
- Breaking out of a consolidation pattern
- Price above all major moving averages
Elliott Wave Analysis:
- Completed waves (I) through (IV)
- Currently entering wave (V)
- Price target for wave (V) at RM0.925 (0.786 Fibonacci level)
Key Technical Levels:
1. Support:
- Major support at RM0.500
- Stop loss level identified at RM0.215 (31.39% below current price)
- Moving averages providing dynamic support around RM0.585
2. Resistance:
- Immediate target at RM0.820 (0.618 Fibonacci)
- Ultimate target at RM1.05 (1.0 Fibonacci)
- Secondary resistance at RM0.750 (0.5 Fibonacci)
Trade Setup:
- Risk/Reward ratio: 1.7
- Target: RM0.865 (53.28% upside)
- Stop loss: RM0.215
- Current position showing good profit potential
Volume Analysis:
- Recent increase in volume supporting breakout
- Money flow indicator turning positive
- Green volume bars suggesting accumulation
Notable Events:
- September 2024: MYR297.855M (+25.32%)
- June 2024: MYR237.67M (-529.76%)

HUPSENG will it create a leading Diagonal wave or ENDING?Looking at the chart for Hup Seng Industries Berhad, here's my analysis:
Current Price Action:
- Trading at RM0.780, up 1.96%
- Currently in an uptrend channel
- Price holding above key moving averages
Elliott Wave Analysis:
- Currently appears to be in Wave (IV) of a larger structure
- Previous waves (I), (II), and (III) clearly visible
- Potential for Wave (V) targeting RM1.37 (1.272 Fibonacci level)
Key Technical Levels:
1. Support:
- Strong support at RM0.915 (0.786 Fibonacci)
- Channel support around RM1.00
- Moving averages providing dynamic support
2. Resistance:
- RM1.20 (0.236 Fibonacci level)
- RM1.30 (previous high)
- Upper channel resistance around RM1.25
Pattern Analysis:
- Trading within an ascending channel
- Series of higher highs and higher lows
- ABC correction pattern visible within Wave (IV)
Volume Profile:
- Recent volume supporting the upward movement
- Money flow indicator showing accumulation
- Green volume bars indicating buying pressure
Notable Events:
- September 2024: MYR15.27M (-15.78%)
- Consistent recovery pattern since June 2023
p/s take profit first +-rm3180@27.46%

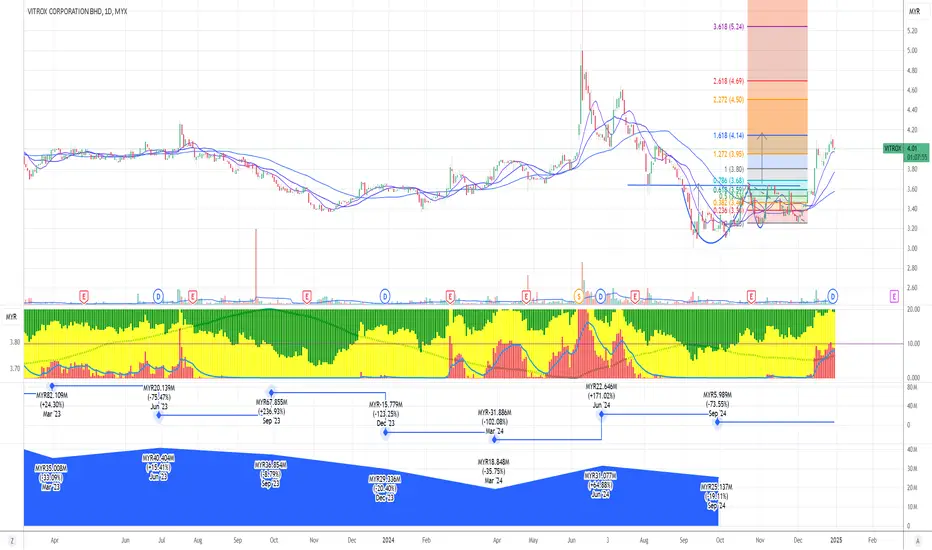
is Selling VITROX near Fibo 1.681 and after ex-date Good?Looking at the chart for Vitrox Corporation Berhad, here's my analysis:
Current Price Action:
- Trading at RM4.00, down 0.12%
- Recently broke out from a consolidation pattern
- Price moving above all major moving averages
Technical Analysis:
1. Fibonacci Levels:
- Key resistance at RM4.69 (2.618 Fibonacci level)
- Support at RM3.68 (0.786 Fibonacci level)
- Ultimate target possibility at RM5.24 (3.618 Fibonacci level)
2. Price Structure:
- Formed a cup and handle pattern recently
- Successfully broke above resistance around RM3.80
- Higher lows forming on the daily timeframe
3. Moving Averages:
- All MAs turning upward
- Price above all major MAs
- Golden cross formation visible (shorter MA crossing above longer MA)
Volume Analysis:
- Recent volume spike supporting breakout
- Money flow indicator showing positive momentum
- Volume increasing on up moves, suggesting strong buying interest
Notable Events:
- September 2024: MYR5.989M (-73.55%)
- June 2024: MYR22.646M (+171.03%)
- Strong recovery from earlier lows
Trading Considerations:
- Entry above RM3.80 support
- Stop loss below recent low around RM3.40
- First target at previous high around RM4.50
p/s profit +-rm1k after sold 4000unit
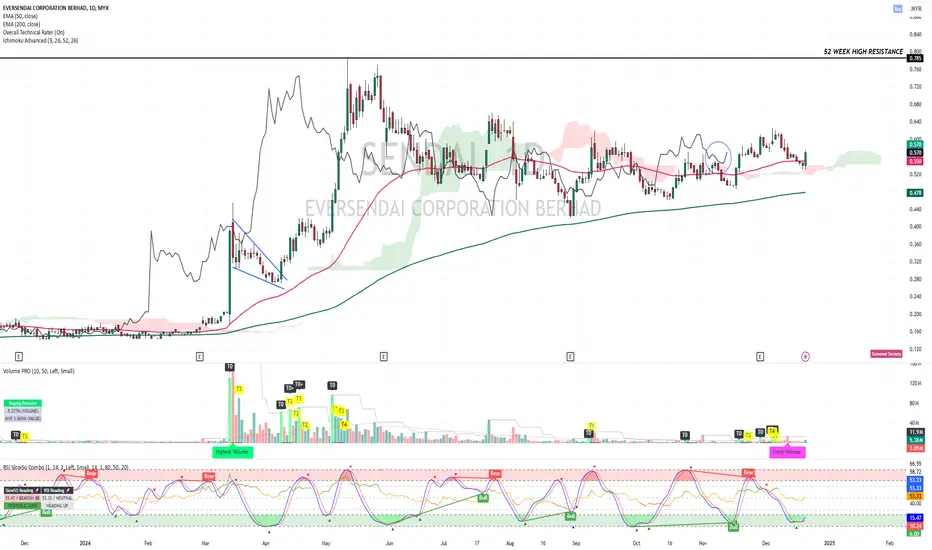
SENDAI - BUY ON DIP ?SENDAI - CURRENT PRICE : RM0.570
SENDAI is uptrend for long term view as the share price is trading above 200-day EMA. In short and medium term the trend is sideways. However, I expect the stock may trend higher in the upcoming sessions as there are several bullish scenario appears on the chart.
i) The share price manage to breakout 50-day EMA
ii) Price bounce from support level of ICHIMOKU CLOUD indicates that buying interest is sufficiently strong to overcome selling pressure
iii) CHIKOU SPAN also manage to bounce from CLOUD support level
iv) RSI (above 50) heading upwards and stochastic oscillator is in oversold zone
v) High trading volume than previous sessions.
Technically it is a BUY ON DIP for this stock.
ENTRY PRICE : RM0.560 - RM0.575
TARGET PRICE : RM0.625 and RM0.690
STOP LOSS : RM0.530
TAYOR !
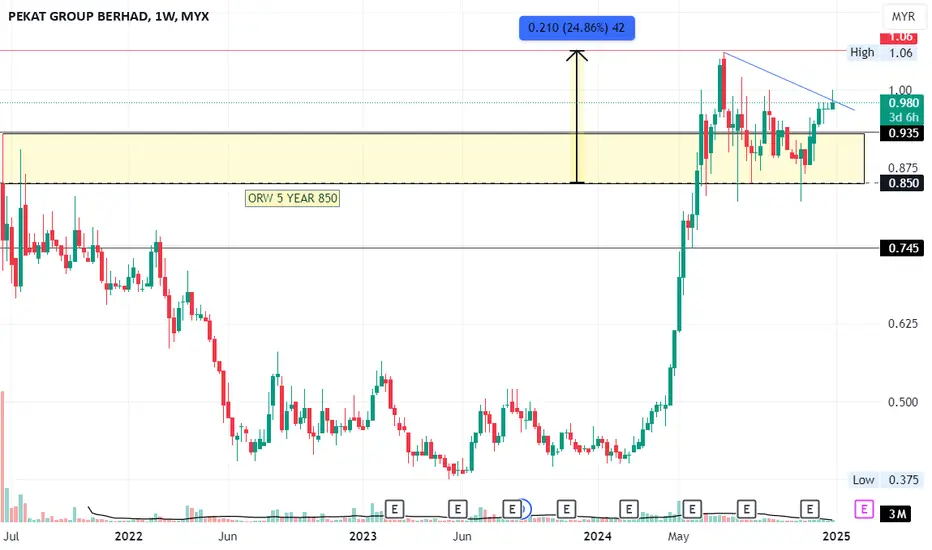
PEKAT STOCK ROAR 2025?DEMAND WILL PLAY AROUND BOX RANGE 855-935
SUPPORT can wait 920
and will close monitor when break 1.06
it should be clearly make it higher high
and stage 2 will confirm with high volume.
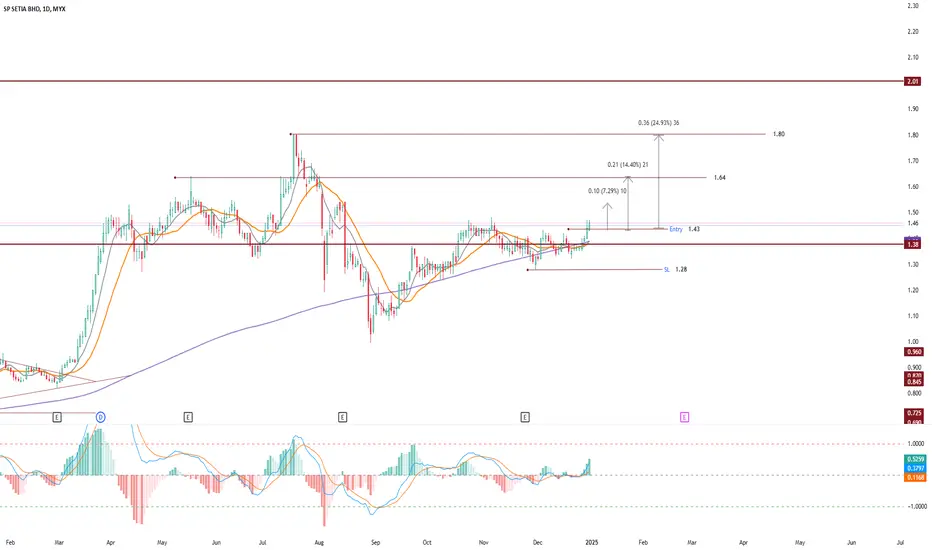
Intraday SPSetia
I am not sure how's the market today, because it is new year tomorrow
I try my luck to do a intraday, Entry 1.43, TP 1.50-1.55
If no luck today, also ok. I am aiming TP 1.63-1.73
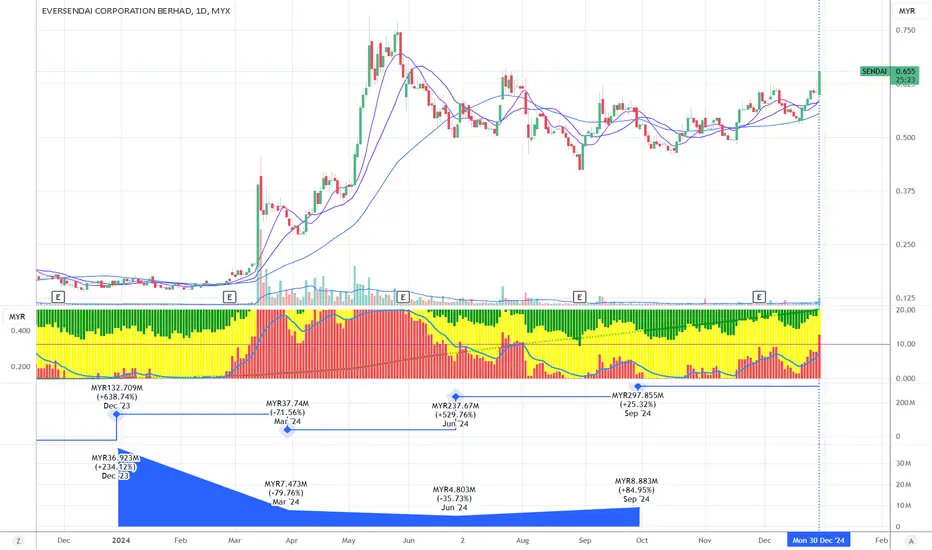
SENDAI enters phase 4Looking at the chart for Eversendai Corporation Berhad, here's my analysis:
Current Price Action:
- Trading at RM0.655, up 8.26%
- Currently showing strong momentum with recent breakout
- Price above all major moving averages
Technical Analysis:
1. Moving Averages:
- Three moving averages showing bullish alignment
- Price recently crossed above all MAs
- MAs beginning to slope upward, indicating trend change
2. Volume Analysis:
- Recent increase in volume supporting the price rise
- Green volume bars indicating buying pressure
- Money flow indicator showing positive momentum
Key Price Levels:
- Support around RM0.50 (previous resistance turned support)
- Immediate support at moving averages around RM0.55
- Resistance level around RM0.70 (previous high)
Notable Events:
- December 2023: MYR132.709M (+638.74%)
- September 2024: MYR297.855M (+25.32%)
- Strong recovery from March-April 2024 lows
Trading Considerations:
- Breakout above resistance with volume confirmation
- Stop loss could be placed below MA support at RM0.55
- Momentum indicators suggesting continued upward movement
Risk Factors:
- Stock is relatively volatile based on historical price action
- Need to watch volume for continuation of breakout
- Previous resistance levels may act as temporary hurdles
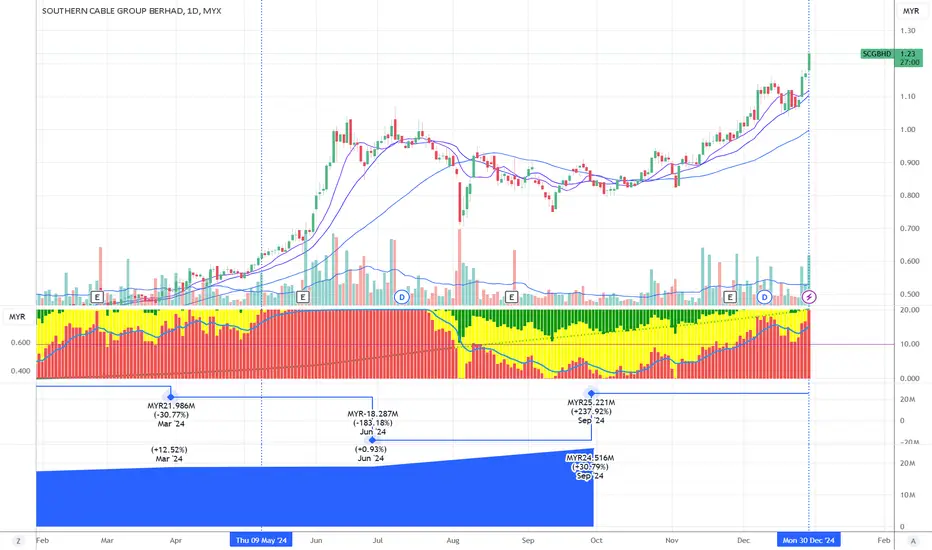
SCGBHD enters phase 5 Shark IndicatorLooking at the chart for Southern Cable Group Berhad, here's my analysis:
Current Price Action:
- Trading at RM1.24, up 5.98%
- Strong uptrend in place since October 2023
- Price is currently above all major moving averages, indicating bullish momentum
Technical Structure:
1. Moving Averages:
- Price trading above both short and long-term moving averages
- Moving averages are in bullish alignment (shorter above longer)
- Acting as dynamic support during pullbacks
2. Volume Analysis:
- Recent volume increase supporting the price rise
- Volume pattern shows healthy accumulation
- Bottom indicator suggests positive money flow
3. Key Levels:
- Support around RM1.10 (recent consolidation area)
- Previous resistance around RM1.00 now acting as support
- Current breakout level at RM1.20 becoming new support
Notable Events:
- Significant drop in June 2024 (MYR-18.287M, -183.18%)
- Recovery from September 2024 with strong momentum
- Current price action showing highest levels in the chart's timeframe
Outlook:
- Overall trend is strongly bullish
- Price structure showing higher highs and higher lows
- Momentum indicators suggesting continued strength
Trading Considerations:
- Buy zones near moving average supports
- Risk management stop loss below RM1.10
- Trend following strategy appears optimal given current structure
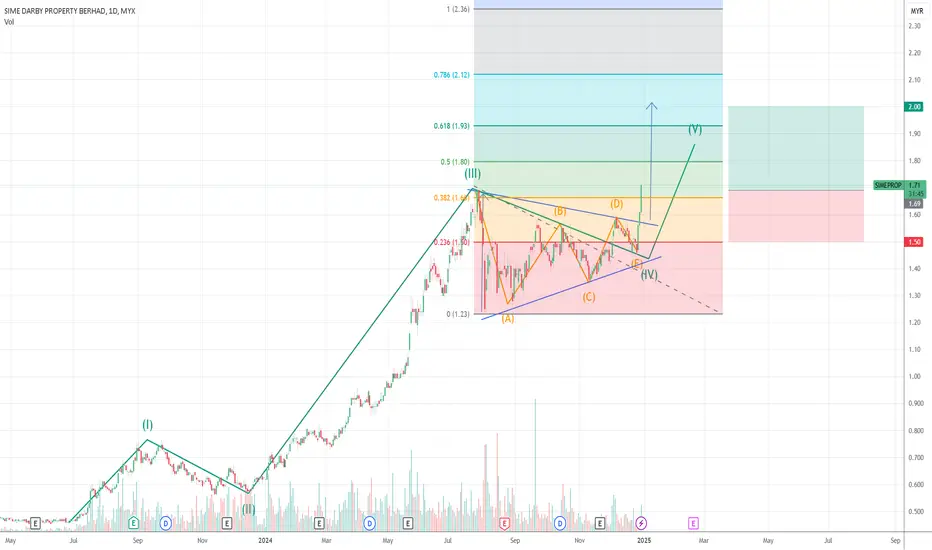
SIMEPROP another fund manager's favourite?Looking at the chart for Sime Darby Property Berhad, here's my analysis:
Current Price Action:
- Trading at RM1.37, down 2.14%
- Currently forming what appears to be a triangle pattern
- Strong uptrend from late 2023 into early 2024
Technical Analysis:
1. Elliott Wave Pattern:
- Appears to be in Wave IV of a larger 5-wave structure
- Wave III peaked around RM1.70
- Currently in a corrective triangle pattern typical of Wave IV
2. Key Price Levels:
- Resistance at RM2.12 (0.786 Fibonacci level)
- Support around RM1.23 (marked on chart)
- Triangle pattern providing immediate support and resistance
3. Price Targets:
- Chart shows a target of RM1.93 (0.618 Fibonacci level) for potential Wave V
- Stop loss indicated at RM1.24 (11.24% below current price)
- Risk/reward ratio shown as 1.63
Pattern Analysis:
- Triangle pattern (labeled A-B-C-D-E) suggesting consolidation
- Once triangle completes, expect a breakout for Wave V
- Bullish bias as long as price stays above triangle support
Trading Setup:
- Entry zone: Current levels around RM1.37
- Target: RM1.93 (0.618 Fibonacci)
- Stop loss: RM1.24
- Risk/Reward appears favorable at 1.63
TENAGA will meet resistance and create wave 2Looking at the technical chart for Tenaga Nasional Bhd (TNB), here's my analysis:
Recent Price Action:
- The stock is currently trading at around RM14.82, showing a slight decline of 0.54%
- There's been an uptrend since December 2023, with the stock rising from around RM13.00 to current levels
Key Technical Levels:
1. Support levels:
- Strong support around RM13.50 which has been tested multiple times
- Secondary support at RM13.06 (marked as level 1 on the chart)
2. Resistance levels:
- Major resistance at RM15.06 (marked at the top of the chart)
- Secondary resistance around RM14.58 (0.236 Fibonacci level)
Pattern Analysis:
- The chart shows what appears to be an Elliott Wave pattern with numbered waves (1-5)
- Currently seems to be forming a potential wave 4 pullback before a possible move higher
- The stock has been respecting an upward trending channel since December
Volume Analysis:
- Trading volume (shown at bottom) has been relatively consistent
- Some spikes in volume during major price movements, particularly in June-July period
Near-term Outlook:
- The overall trend remains bullish as long as price stays above RM13.50
- If the Elliott Wave count is correct, there could be one more push higher (wave 5)
- Key will be whether price can break above the RM15.06 resistance level
Traders should consider:
- Setting stops below RM13.50 for long positions
- Watching the RM15.06 level for potential breakout opportunities
- Being cautious of potential pullbacks as part of wave 4 completion

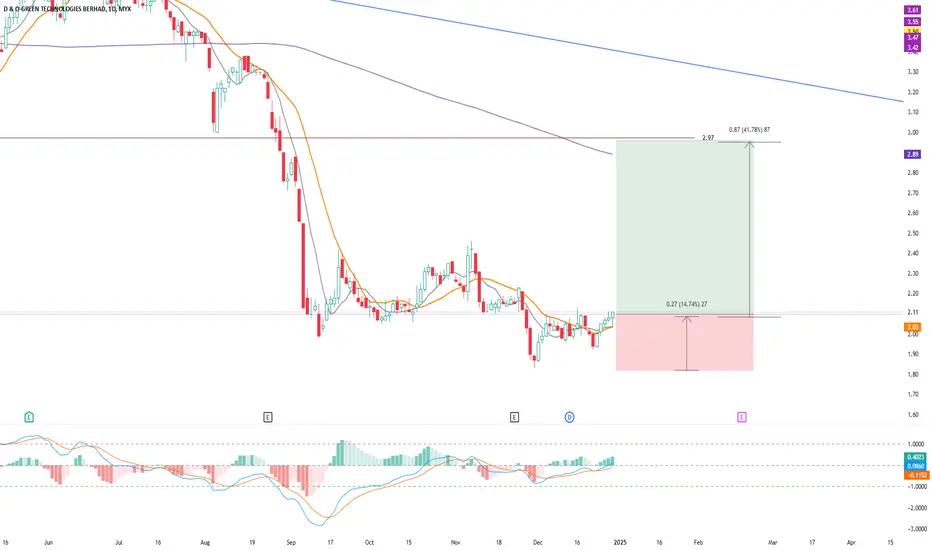
Retest D&O?
Monthly Chart - Hit retracement 79%, and I believe it will retest to range 62%
Weekly Chart - Retest to previous lower low
Daily Chart - I wait for H&S failed and set my Entry, SL, and TP
Always trust MA200, it always give you a hit
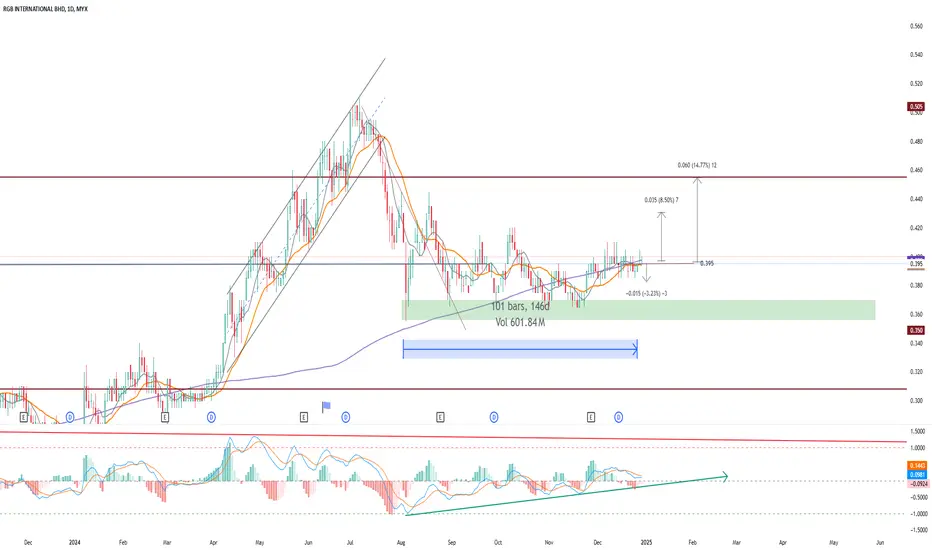
Daily RGB
Monthly is in the progress of Wave 4
Weekly is consolidation about 70 weeks
Daily - I am looking for a BUY CALL setup
As long as I set the Stop Loss, the rest is on GOD's hand
May also set the TP1 and TP 2
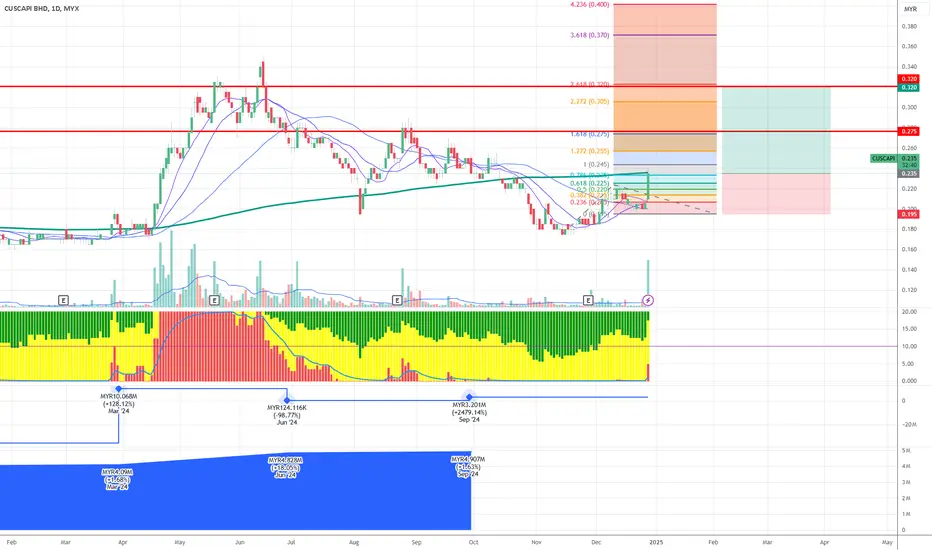
CUSCAPI will rebound starting as wave 3
Historical Movement
The stock saw a major peak around 0.370 (marked at 3.618 level)
Experienced a significant downtrend from June to September 2024
Currently showing potential consolidation and base formation
Key Technical Levels:
Resistance Levels:
Major resistance at 0.275 (marked in red)
Secondary resistance at 0.245
Currently testing intermediate resistance around 0.225-0.230
Support Levels:
Strong support at 0.180
Immediate support trend line (green) acting as dynamic support
Price has formed a higher low pattern recently
Technical Indicators:
Moving Averages:
Multiple MAs show potential crossover points
Price is currently testing the shorter-term MAs from below
The longer-term MA (likely 200-day) is still trending downward
Volume Analysis:
Recent volume spike shows increasing interest
Volume generally higher during downtrends
Current consolidation showing reduced volume, typical of base formation
Trading Setup (Current):
Risk Management:
Stop Loss: 0.040 (17.02% risk)
Target: 0.085 (36.17% potential reward)
Risk/Reward ratio: 2.13 (favorable)
Chart Pattern:
Appears to be forming a potential inverse head and shoulders pattern
Neckline resistance around 0.225-0.230
Volume pattern supporting the potential reversal setup
Market Structure:
Shows signs of transitioning from downtrend to potential bottoming phase
Multiple support levels being established
Fibonacci retracement levels marking key resistance zones
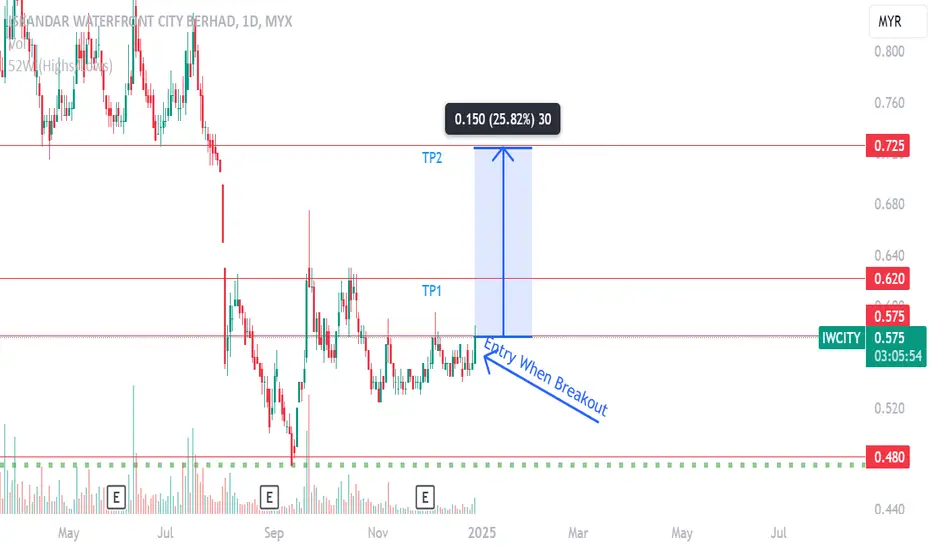
IWCITY WAITING THE BREAKOUTFORECAST FOR THIS WEEK
Opportunity for IWCITY. This setup is my trading idea/plan, if you want to follow: trade at your own risk (TAYOR).
Risk Factors:
1. Market conditions, unexpected news, or external events could impact the trade.
2. Always use risk management strategies to protect your capital.
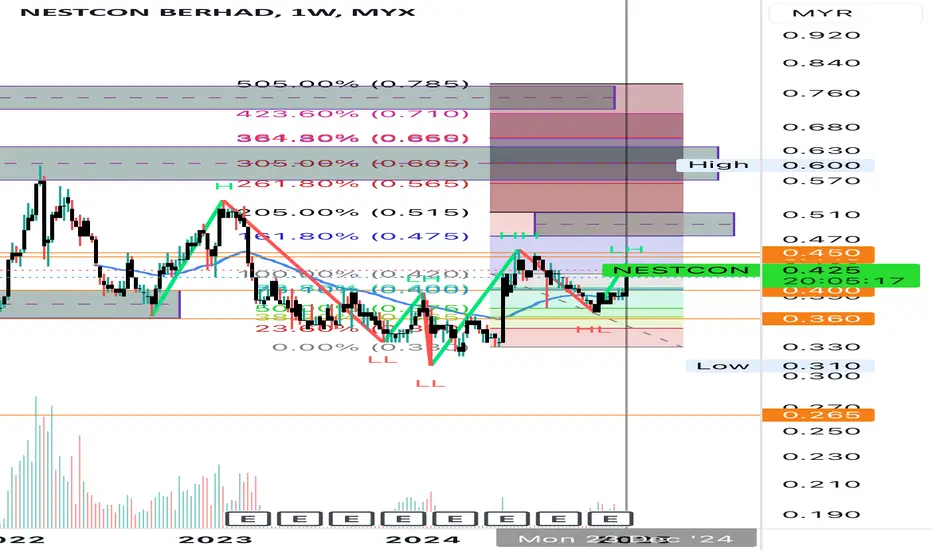
Nestcon: Breakout Potential for 2025Nestcon is showing signs of strength with a primary target at RM0.710 – nothing is impossible if this momentum continues!
✨ Key Levels:
• Strong support: RM0.350 - RM0.355
• Short-term target: RM0.550
• Long-term target: RM0.710
If volume increases, this could pave the way for further upside. Keep an eye on this counter for exciting opportunities!
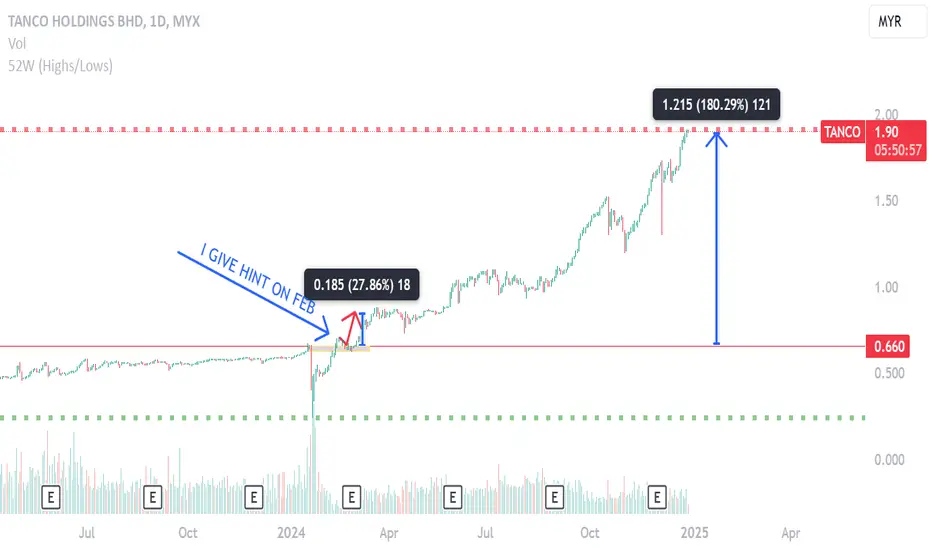
TANCO MAKE 180% LESS THAN ONE YEAR, HINT FEB 2024TANCO I give hint on Feb 2024, Now already make about 180%. This can be hold until next year.
Opportunity for TANCO. This setup is my trading idea/plan, if you want to follow: trade at your own risk (TAYOR).
Risk Factors:
1. Market conditions, unexpected news, or external events could impact the trade.
2. Always use risk management strategies to protect your capital.