HSSEB - ASCENDING TRIANGLE BREAKOUT !HSSEB - CURRENT PRICE : RM0.710
HSSEB is bullish because :
The stock is above 50-day EMA.
The share price is above ICHIMOKU CLOUD
CHIKOU SPAN is above CANDLESTICK
RSI is above 50
Today (20 August 2025) the stock broke out ASCENDING TRIANGLE pattern with high trading volume - indicating strong bullish momentum. The stock may trend higher in near term.
ENTRY PRICE : RM0.700 - RM0.710
TARGET : RM0.780 and RM0.845
SUPPORT : 50-day EMA (CUTLOSS if price close below 50-day EMA)

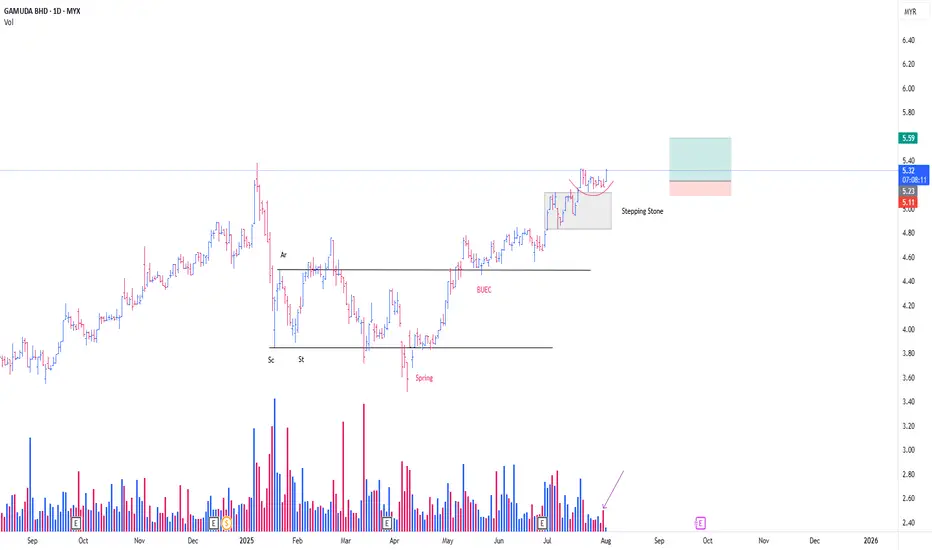
GAMUDA CONTINUING MARKING UPThis is just a continuation from my previous thesis
**pls refer to the link below
I just want to mention that there is another formation of feather's weight (FW) (**Red line) since the Stepping Stone (SS)
I would be labelling this FW as a form of SS
It would be interesting if today's Bar / Candlestick, able to commit above yesterday's Bar/Candlestick (31/7/25)
-Noticed the huge selling blocks (*Purple Arrow)
EP n SL as attached (Position Intiated @ 31/7/25)
PureWyckoff
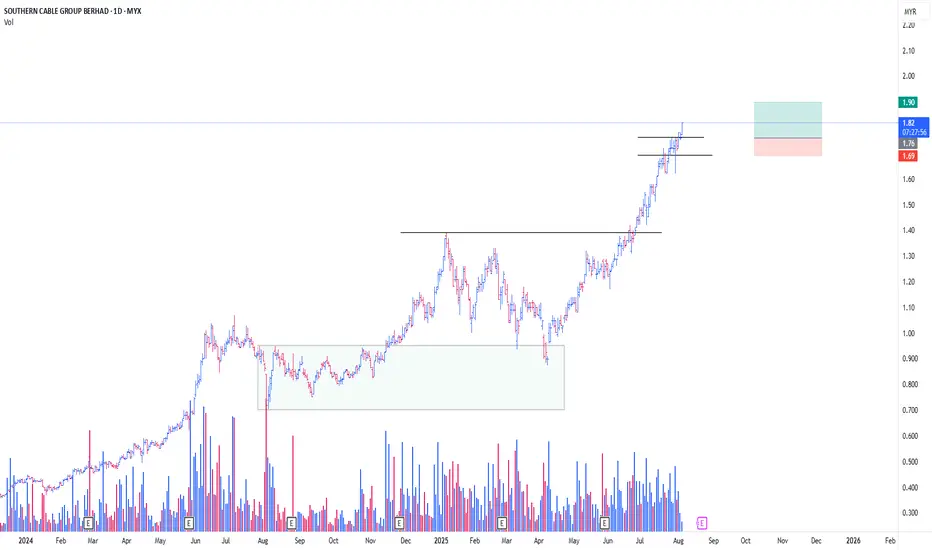
SCGBHD CONT MARKING UPThis is a continuation from my previous thesis
A simple , short , trading range, offer low risk entry
I Maintained my previous thesis
Current marking up is a continuation from previous Trading Range (Refer Link)
Position as attached
PureWcykoff
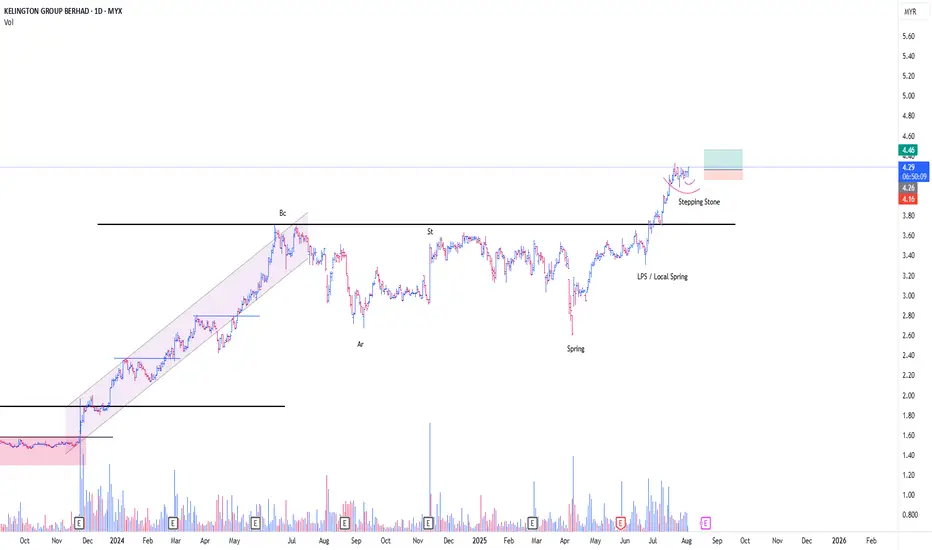
KGB CONTINUE MARKING UPI have been monitoring KGB since my last entry
*Link given
This is a typical Schematic #1 of Re-Accumulation Trading Range
I initiated my position today in the background of Stepping Stone (Red Line)
Based on the influx of buying demand for the past few days, looks like the on going,
Feather's weight & SpringBoard **Purple line, are forming in the theme of Absorption.
Tight risk for this one, im expecting, to get in back, if my current position got knocked out
*(only if low risk entry is formed)
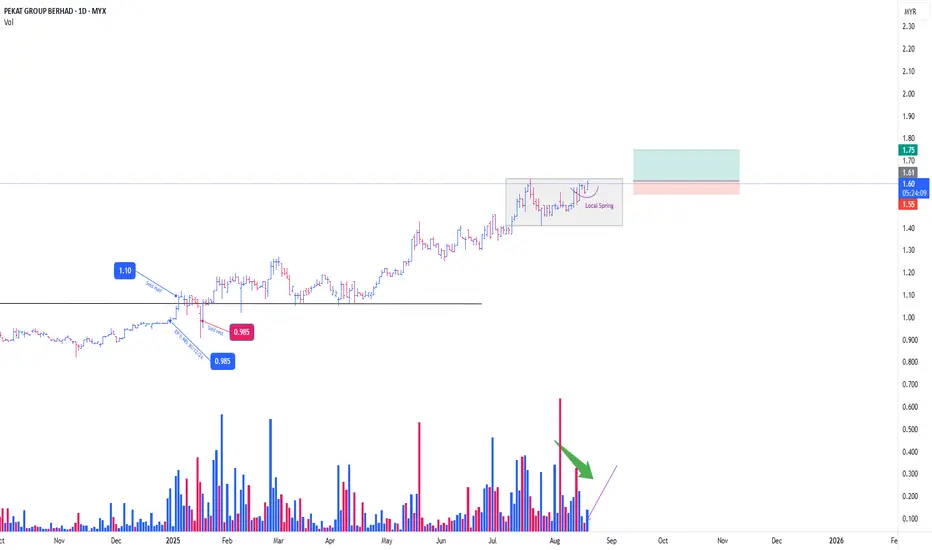
PEKAT CONTINUE MARKING UP
Pekat, Currently in Marking Up Phase, in bigger picture.
**Kindly refer to my previous entry for Pekat
The Black Box, represent a Stepping Stone
**(A term in Wyckoff methode, describing a temporary point where price static 'sideway' before continuing the mark up phase)
In the background of reducing supply (green arrow),
there is on going formation of SpringBoard (purple arc line).
on top of that, formation of local spring , tally accordingly with its own, low supply vol @ 18/8/25 (purple arrow)
im well aware of the incoming QR release tomorrow / few days
With a Trigger Bar today, position initiated as attached
PureWyckoff
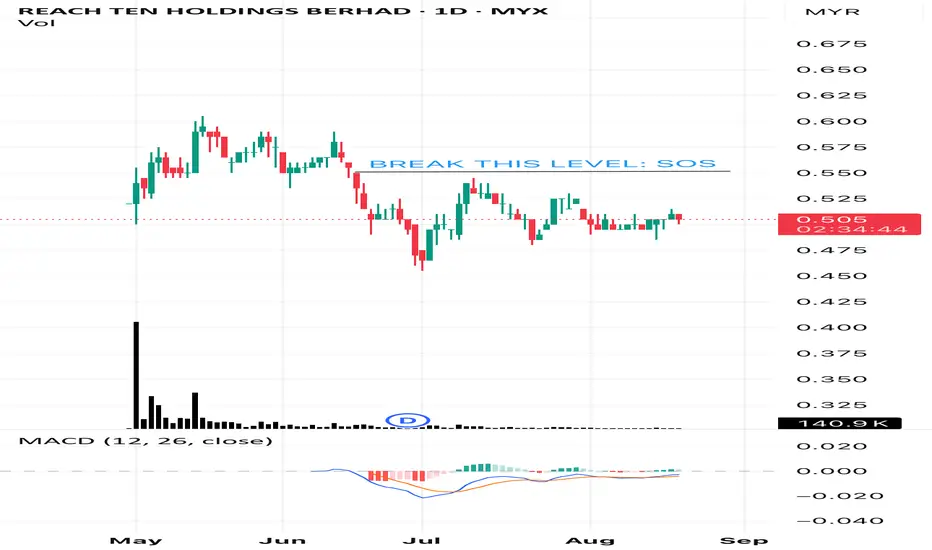
BREAKOUT SOON?Chart is in accumulation phase.
Break above RM0.55 with high volume: Sign of strength (SOS)
If price fails to break, the chart is still in sideway mode.
#TAYOR
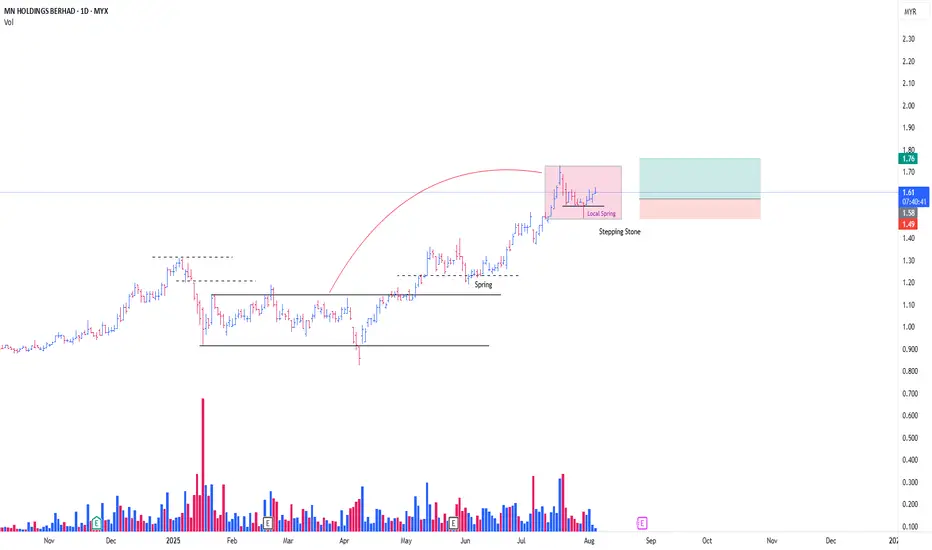
MNHLDG CONTINUE MARKING UPThis is a continuation from my previous entry
**Refer link
Referring to the Red Box, I see it as a Stepping Stone (SS) , a mere temporary stop centre,
before continuing marking up from previous Trading Range (Red Arc Line).
My hypothesis is that, this box are forming a mini Trading Range , in which the formation of local spring , prompted me to initiate position.
The 3 Bars (Or Candlesticks, whatever you prefer), are basically a SpringBoard [/b ] in the form of Absorption.
For Non Wyckoffian, this might be confusing.
Different POV produce different meaning & context/subcontext.
I intiated my position @ 31/7/25, added position today
PureWyckoff
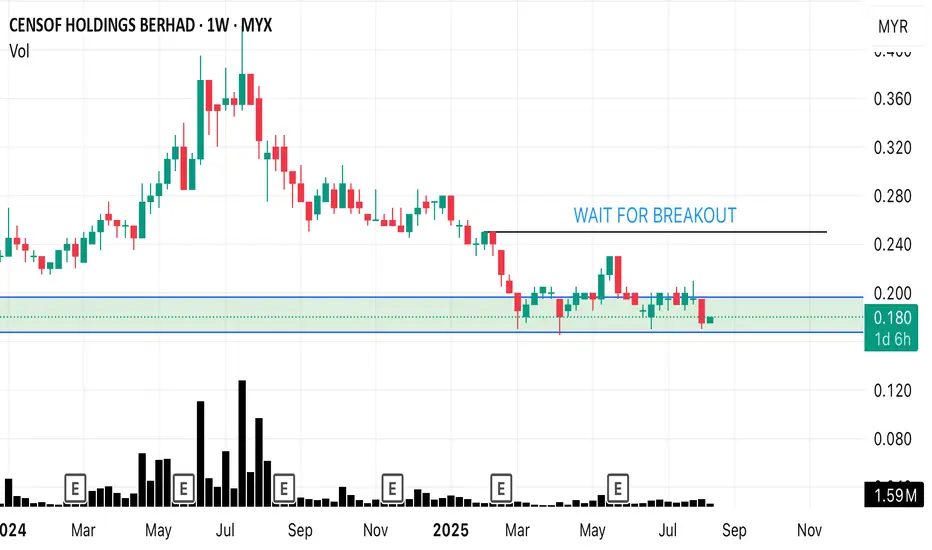
WAIT FOR BREAKOUTCurrent trend - reaccumulation
If the price succesfully breaks above RM0.25 with high volume, the uptrend will continue.
If the price break below the order block zone, sign of weakness where we can put out this stock from watchlist
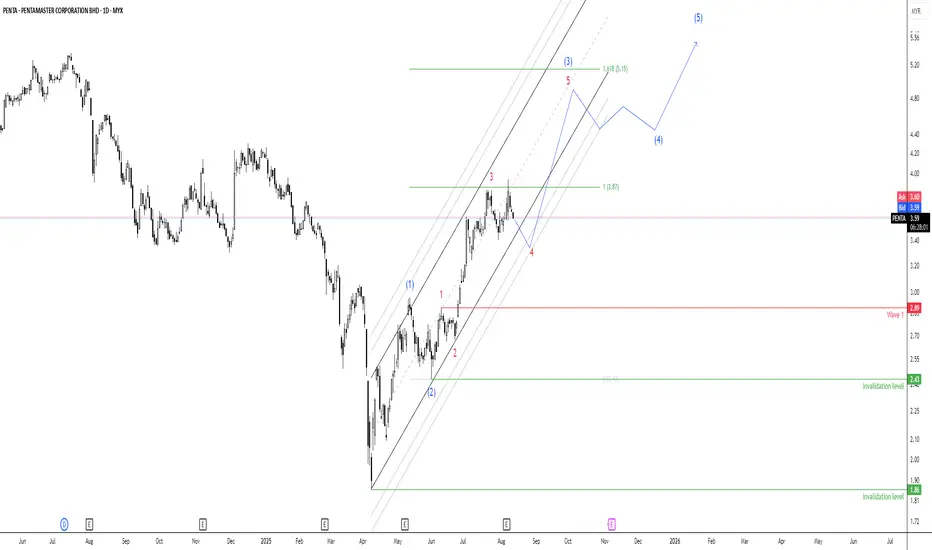
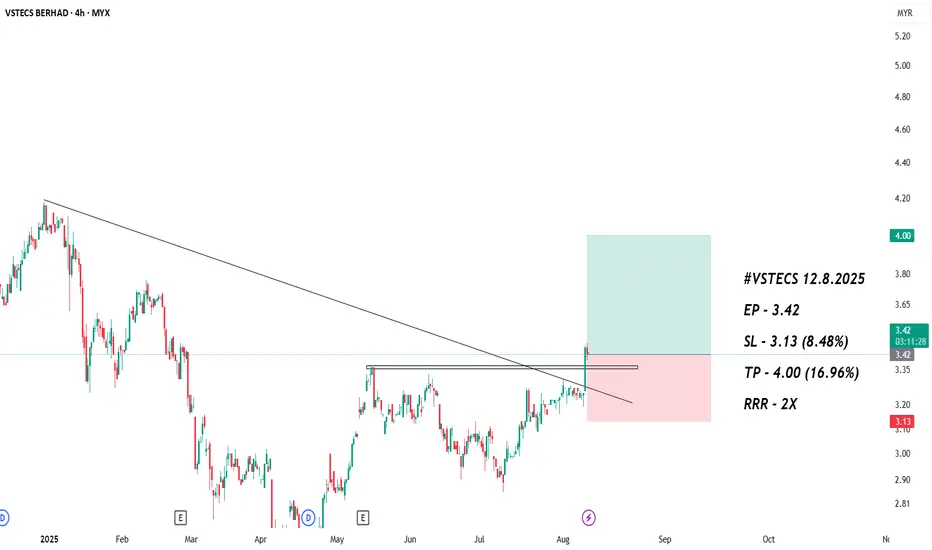
Wave Watch: PENTA Eyes RM5.15- PENTA is in the middle of a 5-wave uptrend — wave (5) still in progress.
- RM5.15 is the projected target if wave (5) extends.
- Current price: RM3.59, showing signs of slowing.
- RM2.89 is the invalidation level — below this, the wave count fails.
- Chart shows possible sideways move before trend continues.
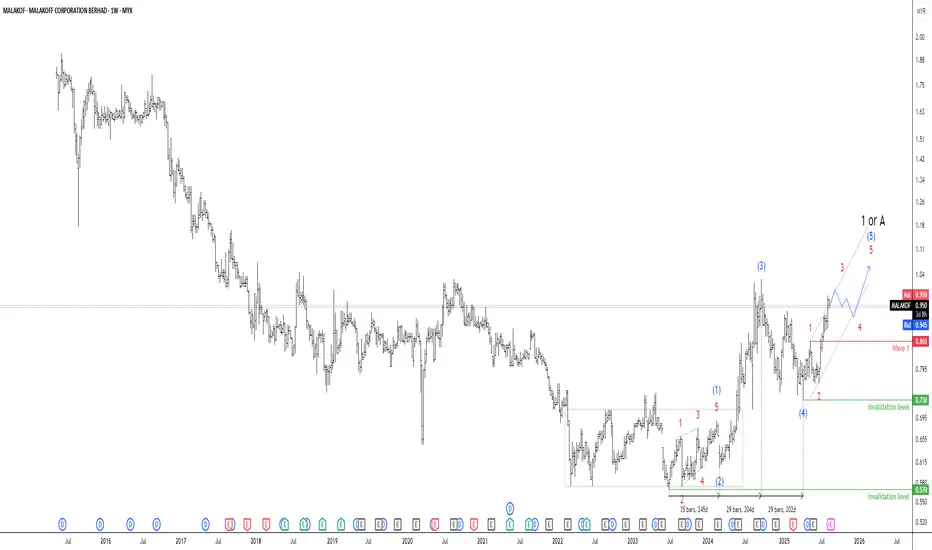
MALAKOF Weekly Chart: Bullish Structure with Key Invalidation📈 Wave Structure Overview
• The chart shows a completed corrective phase, likely Wave A or 1, followed by a clear impulsive sequence: (1), (2), (3), (4), (5).
• Within that impulse, sub-waves 1–5 are well-defined, suggesting a strong Wave (3) extension — typically the most powerful leg in an Elliott sequence.
• The current price action around MYR 0.945 appears to be in the final stages of Wave (5), or possibly transitioning into a larger Wave 3 or C, depending on your primary count.
🛡️ Invalidation Zone
• RM 0.860 marks the Wave 1 level, which Wave 4 must not breach under standard Elliott Wave rules.
• A drop below RM 0.860 would invalidate the current impulsive count, suggesting that Wave (5) is either truncated or the structure is corrective rather than impulsive.
• This level serves as a critical risk management threshold for traders tracking the bullish scenario.
🔍 Interpretation
• The wave count suggests bullish continuation, especially if price holds above RM 0.860.
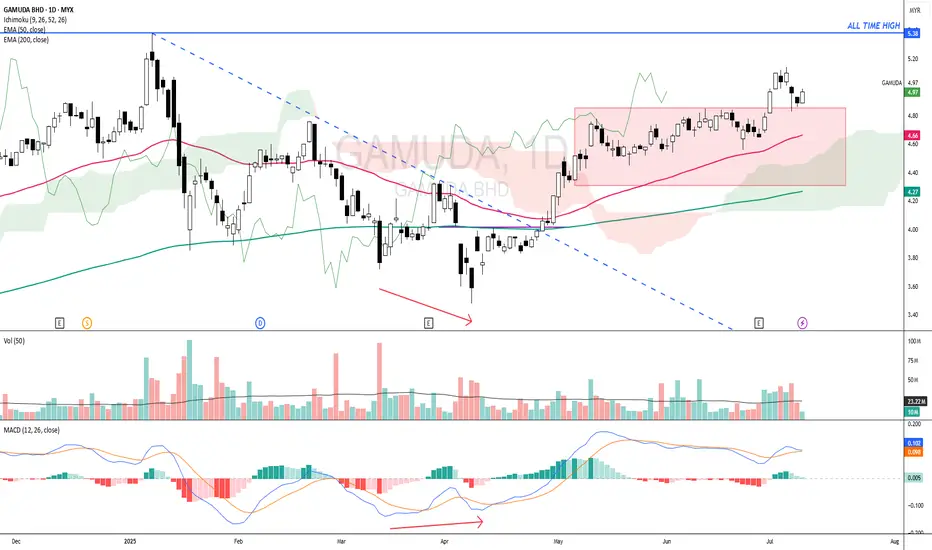
GAMUDA - Leading stock in CONSTRUCTION SECTORGAMUDA - CURRENT PRICE : RM4.97
Based on Japanese Candlestick , 30 April 2025 candle was a LONG CLOSING BOZU WHITE CANDLE . At that particular moment, it changed the trend from BEARISH to BULLISH because :
1) Price already above EMA 200 and closed on that day above EMA 50
2) Price closed into ICHIMOKU CLOUD
3) CHIKOU SPAN starts moving above CANDLESTICK
4) MACD also bullish
At current moment, after two days of selling pressure the share price turns positive today and closed higher than previous day's high. This may consider as potential buy on dips for those didn't have position yet. Supported by rising EMAs, the share price may move up to test the all time high level.
ENTRY PRICE : RM4.94 - RM4.98
TARGET : RM5.36 and RM5.57
SUPPORT : Below EMA 50 on closing basis
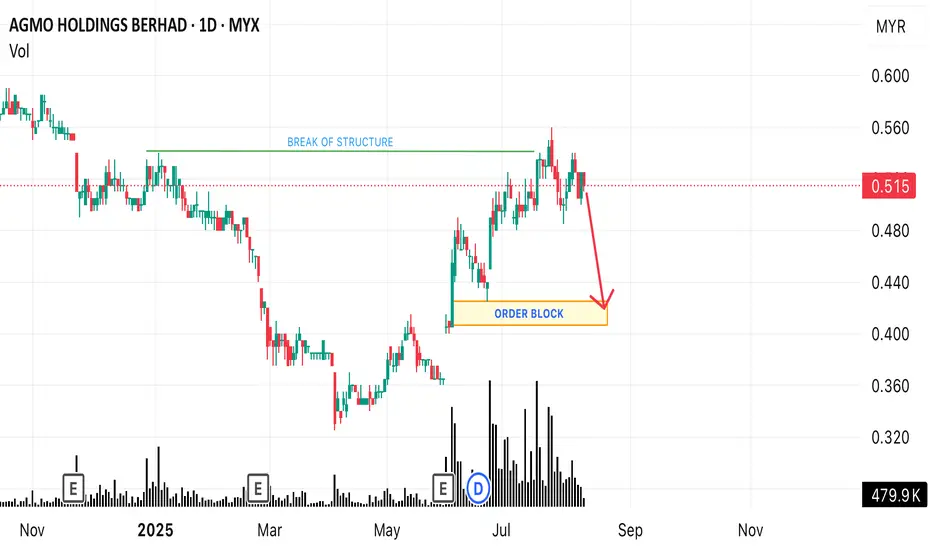
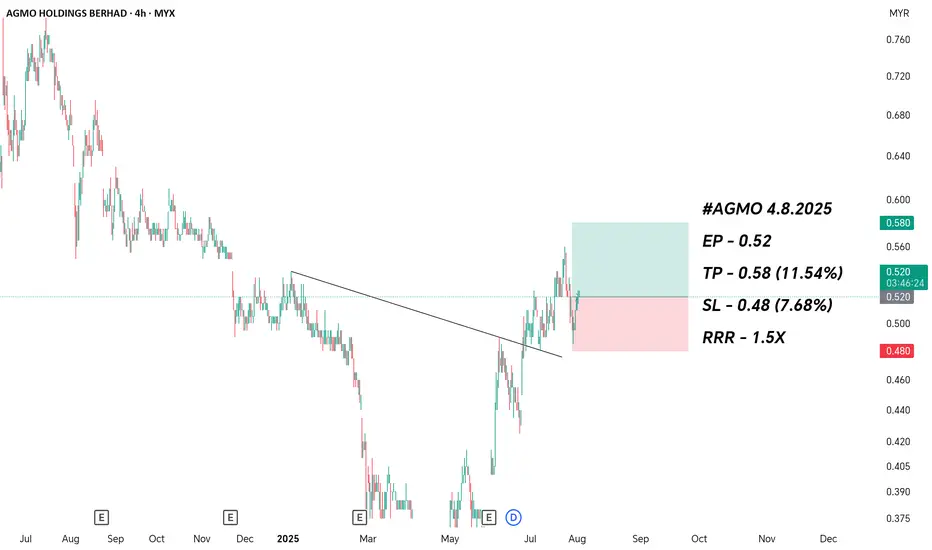
NICE BREAK OF STRUCTURECurrently price is in downtrend (in process of distribution) after BOS ( break of structure). Now its going to visit order block zone. So wait patiently till price comes to you.
#tayor
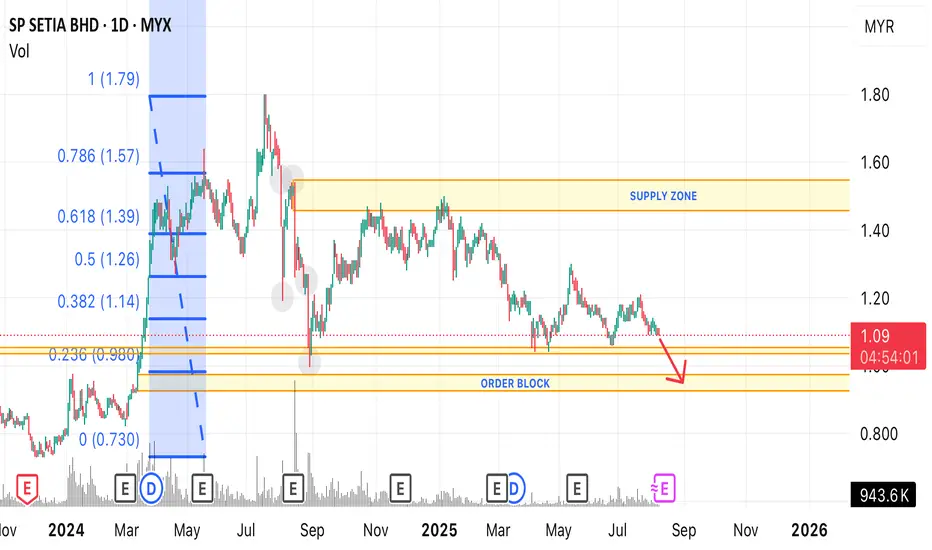
SPSETIA: FINDING THE SUPPORT?Refers to my post on 1/7/2025.
Looks like price failed to reach previous HH. I think the price will move down toward Order Block zone
#tayor
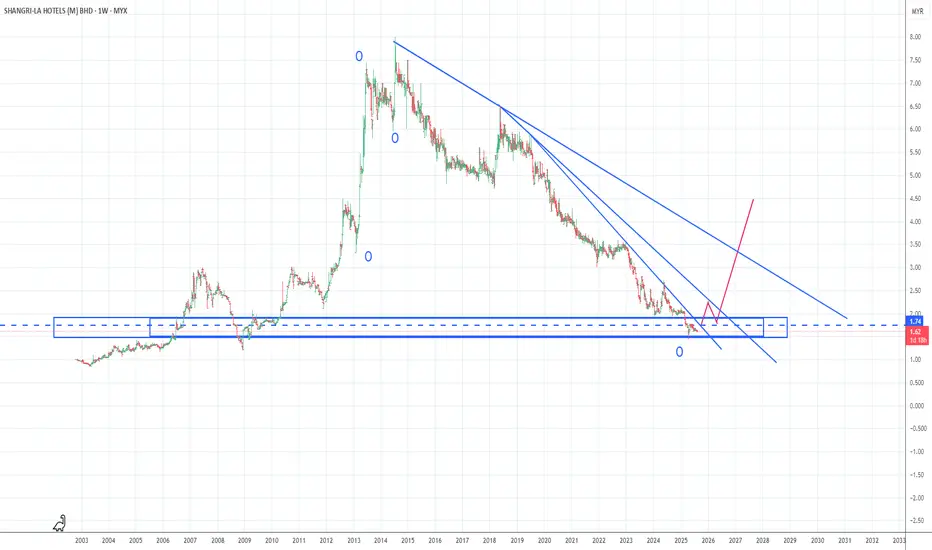
SHANGRI-LA HOTELS Downtrend Cycle O CompleteCycle O has complete at SHANGRI-LA HOTELS. Possible to start uptrend back. Just Sharing Idea not a buy call.Thanks
MTEC - Breakout Sideways MTEC - CURRENT PRICE : RM1.15
MTEC broke out nearest resistance RM1.14 and closed as solid bullish candlestick at RM1.15. The volume was higher than previous day indicating strong buying interest. This bullish momentum may propel the share price higher in the upcoming session.
ENTRY PRICE : RM1.15
TARGET : RM1.25
SUPPORT : RM1.08


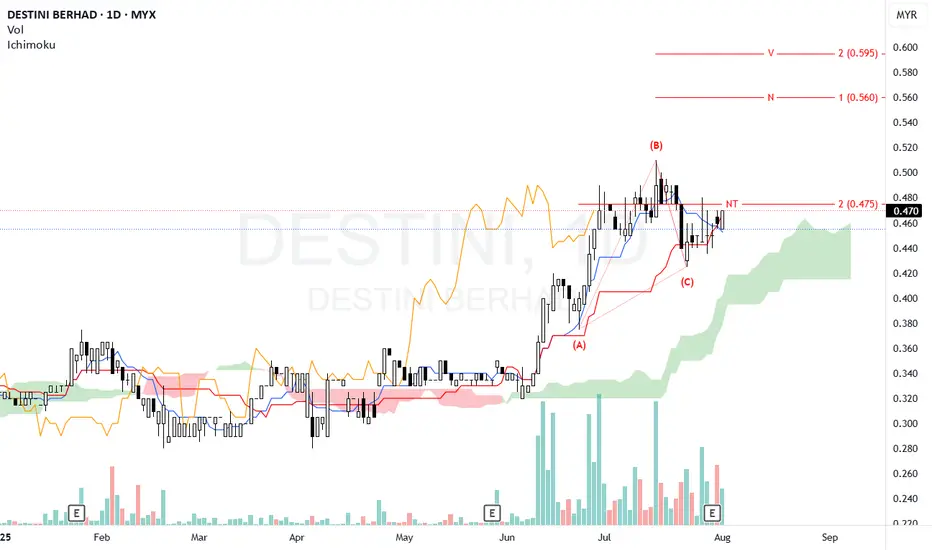
DESTINI - Looking for a potential price movement.N wave with V, N & NT projection.
The chart shows a bullish correction starting after a prior downtrend, with the current price around 0.470.
Price is trading above the Kumo, suggesting a bullish bias is developing. The Kumo shows support below the current price, with potential for upward momentum.
Currently testing the NT level at 0.475, which acts as immediate resistance. If Price break and stay above this level convincingly, it might aim for higher targets (N and V).
Volume has been variable, but a volume increase on breakout would strengthen the move.
Entry: Consider going long if the price clearly breaks above the 0.475 level with volume confirmation.
Stop Loss: Place SL slightly below recent lows, around 0.440, to manage downside risk.
Confirm breakout with volume and price action. If price fails to break 0.475 and falls below 0.445, it may enter a sideways/consolidation phase or pull back to test the top of the cloud near 0.430.
Note:
1. Analysis for education purpose only.
2. Trade at your own risk.
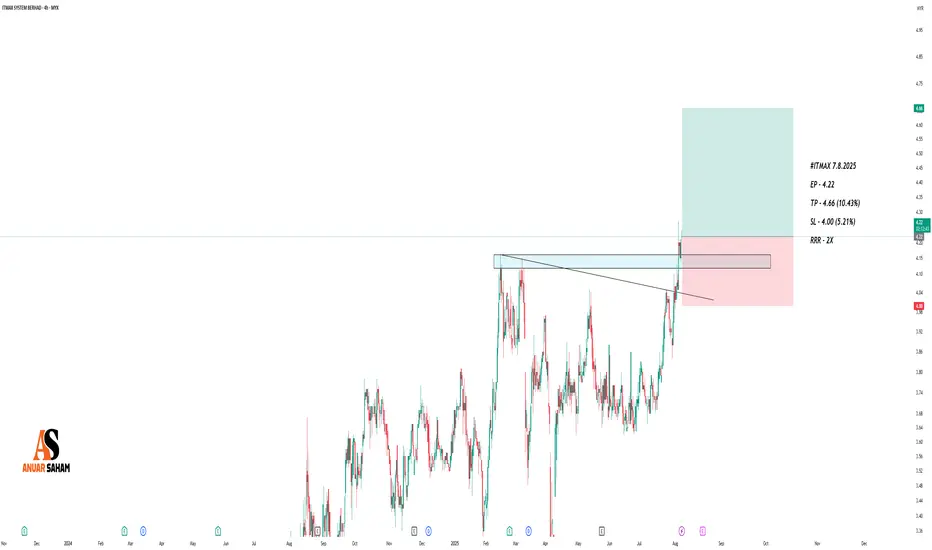
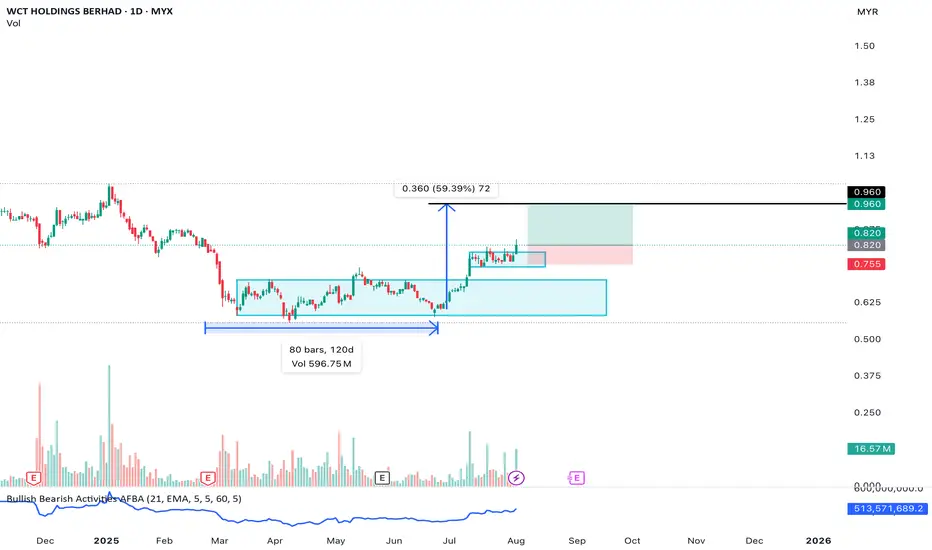
WCT, Front runner of ECRL-Port Klang extension.C : Front runner of ECRL-Port Klang extension.
E : Masih dalam fasa keuntungan + AR lepas increasing. Order book forcasted to be increasing this year.
V : FV analysts minima RM0.96, MIDF. RM1 ke atas other banks. PE kasar 4.7.
W : Breaking out from BUA.
I : Currently ada. Tapi tak dapat cari transaction yg latest.
T : Buy BO BUA, cut loss bila price invalidate the structure.
WCT, front runner of ECRL-Port Klang extension.C : Front runner of ECRL-Port Klang extension.
E : Masih dalam fasa keuntungan + AR lepas increasing. Order book forcasted to be increasing this year.
V : FV analysts minima RM0.96, MIDF. RM1 ke atas other banks. PE kasar 4.7.
W : Breaking out from BUA.
I : Currently ada. Tapi tak dapat cari transaction yg latest.
T : Buy BO BUA, cut loss bila price invalidate the structure.

KIMLUN - DMI and RSI shows BULLISH SIGNAL KIMLUN - CURRENT PRICE : RM1.31
KIMLUN is in an uptrend for medium term as the price is making higher high and higher low. Supported by positive readings in technical oscillators such as DMI (+DI is above -DI) and RSI (above 50), it increases the bullish scenario. At current price trading near SMA 20, there is possibility for price reach upper band in bollinger bands indicator. Nearest support will be RM1.24 (-5.34%) and 1st target will be RM1.41 (+7.63%).
ENTRY PRICE : RM1.30 - RM1.31
TARGET : RM1.41 and RM1.47
SUPPORT : RM1.24
Notes : On the fundamental side, KIMLUN shows a strong recovery in earnings. For FY2022, company was loss RM7.2 million. Then the company rebounded with a profit of RM7.1 million in FY2023. For FY2024, company registered strong performance of profit RM50.3 million.
