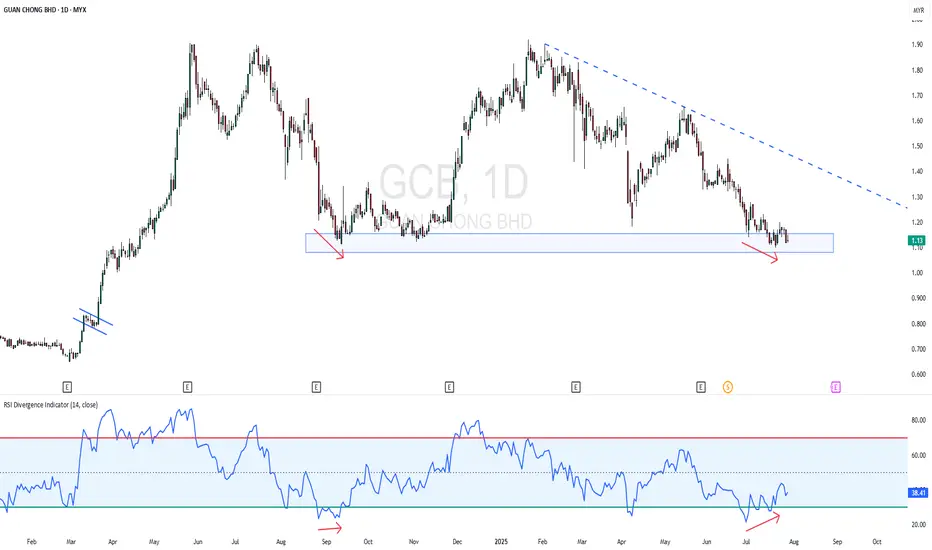
GCB - Near 52 Week LowGCB - CURRENT PRICE : RM1.13
GCB is in a downtrend as the highs and lows both getting low. The stock is near 52 Week Low. However, the stock may rebound higher for short term as there is a bullish divergence in RSI. Price is making lower low while RSI making higher low. Rising in RSI reading indicating there is slightly bullish momentum picking up. Aggressive trader may anticipate for buying with tight stop loss level.
ENTRY PRICE : RM1.13
TARGET : RM1.20 (+6.30%)
SUPPORT : RM1.10 (-2.65)
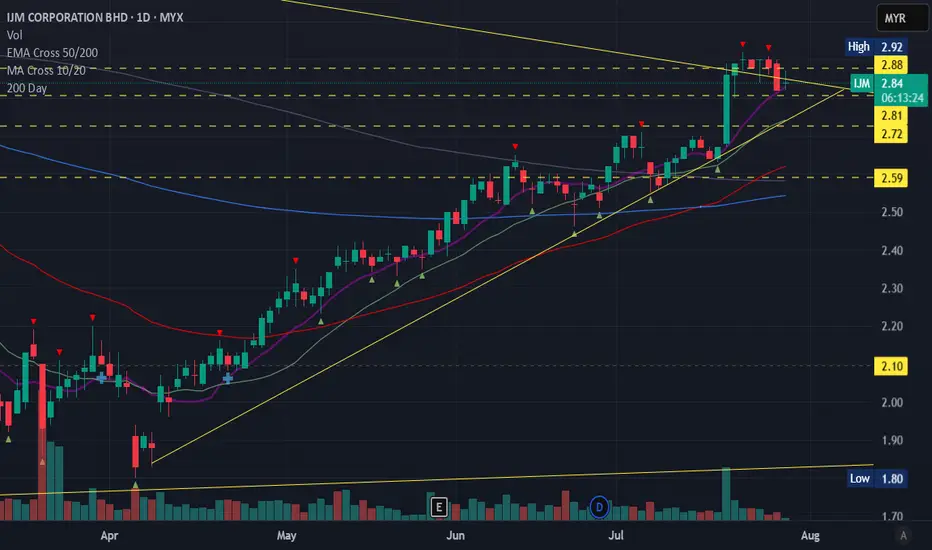
IJM movement had spoken### Technical Analysis of IJM Corporation Berhad (IJM)
**As of July 29, 2025**
---
#### **1. Trend Analysis**
- **Current Price Trend**:
- IJM is in a **bullish trend** on the medium-to-long-term timeframe.
- Key observations:
- **Higher Highs & Higher Lows**: The stock has consistently formed higher peaks and troughs over the past 6 months, indicating sustained buying pressure.
- **Moving Averages**:
- **50-day EMA**: Acting as dynamic support (e.g., ~RM 2.20).
- **200-day EMA**: Upward-sloping, confirming the long-term bullish bias (e.g., ~RM 2.00).
- **Resistance Levels**:
- Immediate resistance at **RM 2.50** (recent high).
- Breakout target: **RM 2.65–2.70** (next psychological barrier).
- **Support Levels**:
- Strong support at **RM 2.10–2.15** (confluence of 200-day EMA and prior swing lows).
- **Conclusion**:
> The trend is **UP**, with bullish momentum intact. A hold above RM 2.10 maintains the upward trajectory.
---
#### **2. MACD Analysis**
- **Current MACD (12, 26, 9) Setup**:
- **MACD Line**: Above the signal line (positive divergence).
- **Signal Line**: Rising but trailing the MACD line.
- **Histogram**: Positive and expanding (green bars), indicating **increasing bullish momentum**.
- Example values (hypothetical):
- MACD Line: **+0.15**
- Signal Line: **+0.10**
- Histogram: **+0.05** (growing).
- **Interpretation**:
- **Bullish Crossover**: MACD crossed above the signal line ~2 weeks ago, triggering a buy signal.
- **Momentum Confirmation**: The expanding histogram suggests acceleration in upward momentum.
- **No Divergence**: Price and MACD are aligned (no bearish reversal signal).
- **Conclusion**:
> MACD confirms **bullish momentum** with room for further upside.
---
#### **3. Combined Outlook**
- **Strengths**:
- Trend + MACD alignment supports continued upside.
- Volume has risen during up-moves, validating buyer conviction.
- **Risks**:
- Overbought RSI (e.g., >70) on shorter timeframes may cause minor pullbacks.
- Market sentiment shifts (e.g., sector-wide profit-taking) could pressure the stock.
- **Tactical View**:
- **Hold/Buy on Dips**: Ideal entry near support (RM 2.10–2.15) if retested.
- **Take-Profit Zones**:
- Short-term: **RM 2.50** (breakout confirmation).
- Medium-term: **RM 2.65–2.70**.
- **Stop-Loss**: Below RM 2.10 (invalidates bullish structure).
---
**Disclaimer**: This analysis is based on technical patterns and historical data. Fundamental factors (e.g., earnings, sector risks) must be evaluated independently. Consult a financial advisor before trading.
Uchitec on tight ascending triangles. Breaking soon. Is time to breakout the ascending triangle. long accumulation after big sell down.
Current price 3.20 with minimal downside. RR ratio please see it your self. Dont say i Bojio

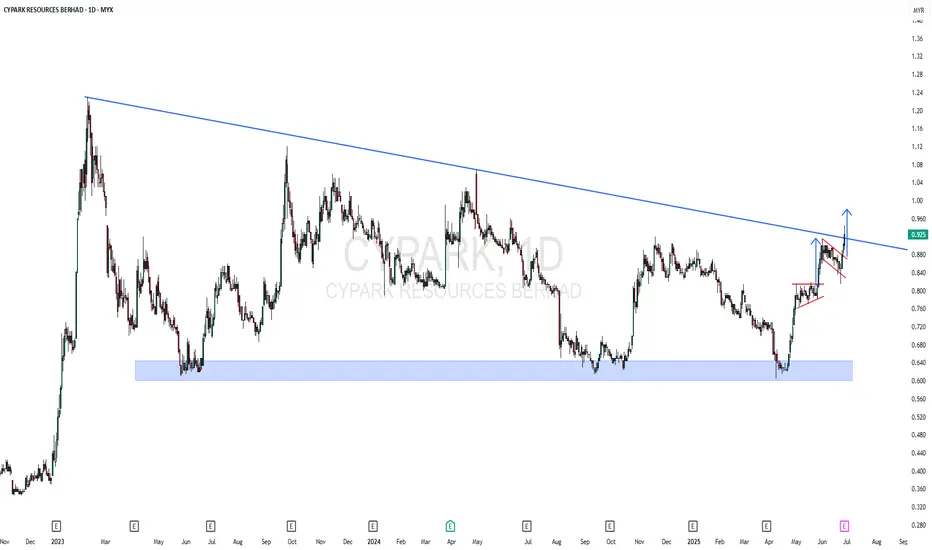
CYPARK - 52 WEEK HIGH CYPARK - CURRENT PRICE : RM0.925
CYPARK made a NEW 52 WEEK HIGH on 26 JUNE 2025. It also breakout a significant down trendline - indicating strong bullish momentum. Nearest target will be the measurement of flag pattern price target which is RM0.980. Then if it continues to rise, RM1.02 will be second target. Stop loss level is RM0.850.
ENTRY PRICE : RM0.920 - RM0.930
TARGET : RM0.980 and RM1.02
STOP LOSS : RM0.850
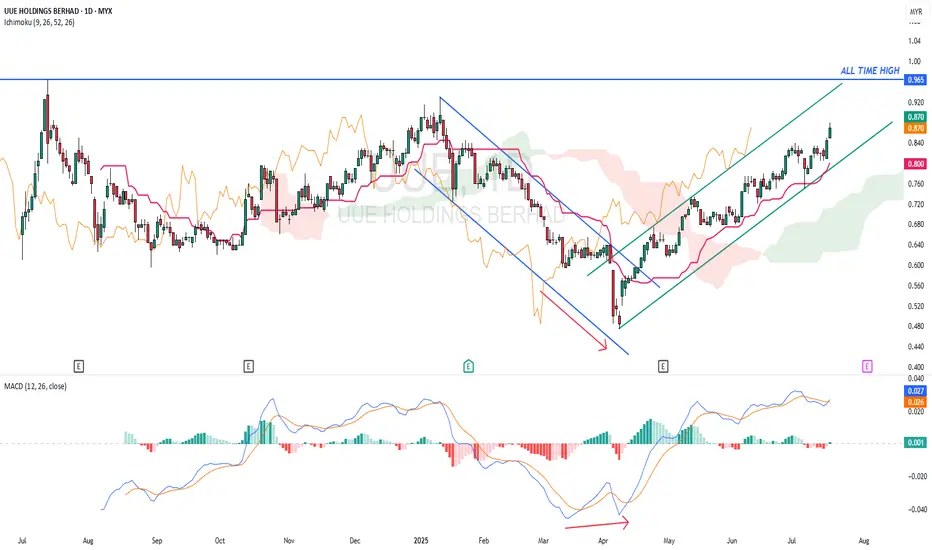
UUE - Potential hit All Time High ?UUE - CURRENT PRICE : RM0.870
The downtrend from January 2025 to April 2025 had changed to uptrend after the stock broke out the descending channel. Take note that there was a bullish divergence in MACD before the breakout of channel.
ICHIMOKU CLOUD traders may take note that the KIJUN SEN is rising steadily and CHIKOU SPAN also moving above candlesticks - indicating stock is uptrending. Today's closing price is higher than previous day's close suggesting a bullish breakout buy signal. A close below the KIJUN SEN may indicate a trend reversal (KIJUN SEN acts as support level).
ENTRY PRICE : RM0.865 - RM0.870
TARGET PRICE : RM0.930 , RM0.965 and RM1.03
SUPPORT : KIJUN SEN (cutloss if price close below KIJUN SEN)
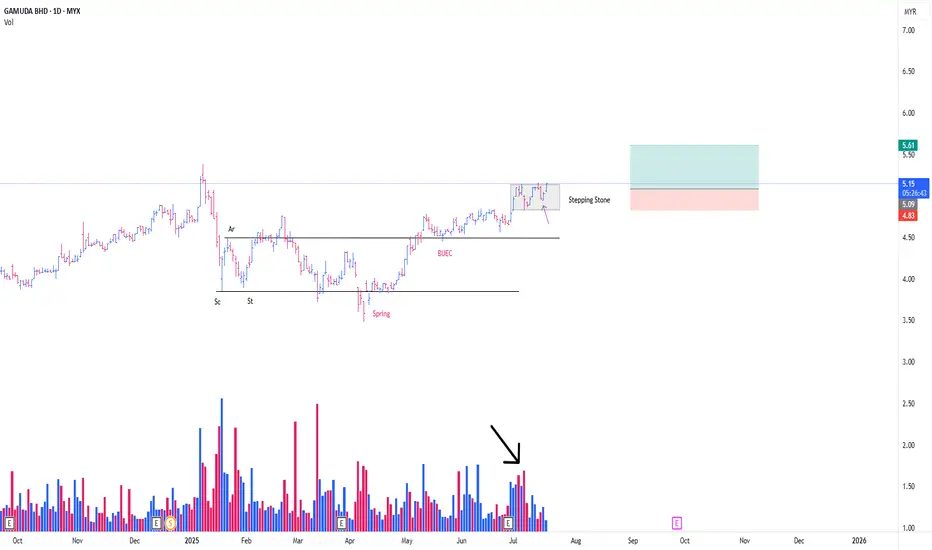
GAMUDA CONT MARKING UP PHASEThis is a continuation from my prev post
**Refer to the link below
This is a play coming from the Stepping Stone (SS)
-SS is a term, in wcykoff methode , particularly describing a momentarily 'pause' in between, consecutive mark up phase.
Absoprtion detected from the on going SS
*Black arrow
with the possibility of Trigger Bar today, in the background of SpringBoard Schematic #2 *Purple arrow
-Position initiated as attached
PureWyckoff
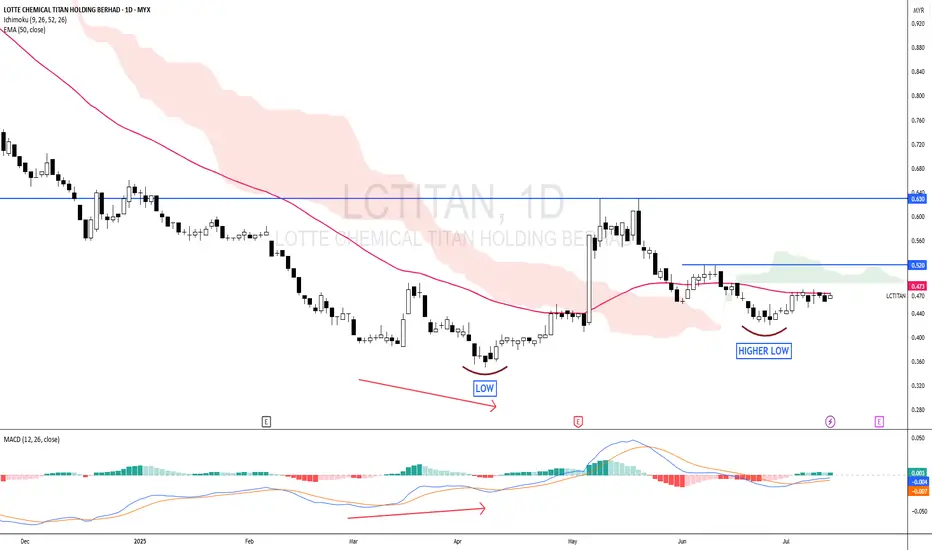
LCTITAN - The LOW is getting HIGHER !LCTITAN - CURRENT PRICE : RM0.470
The stock made a HIGHER LOW recently - this may consider as a half portion of new uptrend is completed. A breakout above RM0.630 will form the higher high structure - which confirm the new uptrend phase.
For short term trading purposes, short term traders may anticipate to buy if the stock breakout nearest resistance of RM0.520 - which will give an entry point at RM0.525. So this is a pending breakout stock. Nearest target will be RM0.580 and RM0.620. Take note that when the price breakout RM0.520 , it will also be above EMA 50 and ICHIMOKU CLOUD - which strengthening the bullish outlook.
ENTRY PRICE : RM0.525
TARGET : RM0.580 and RM0.620
SUPPORT : EMA 50
Notes : The higher low structure of LCTITAN looks like DRBHCOM - I share the link here for reading purposes.


DPHARMA: READY TO GO?Chart: Uptrend on weekly timeframe
Price is in the phase of accumulation
SL: within swap zone area
#trade at your own risk

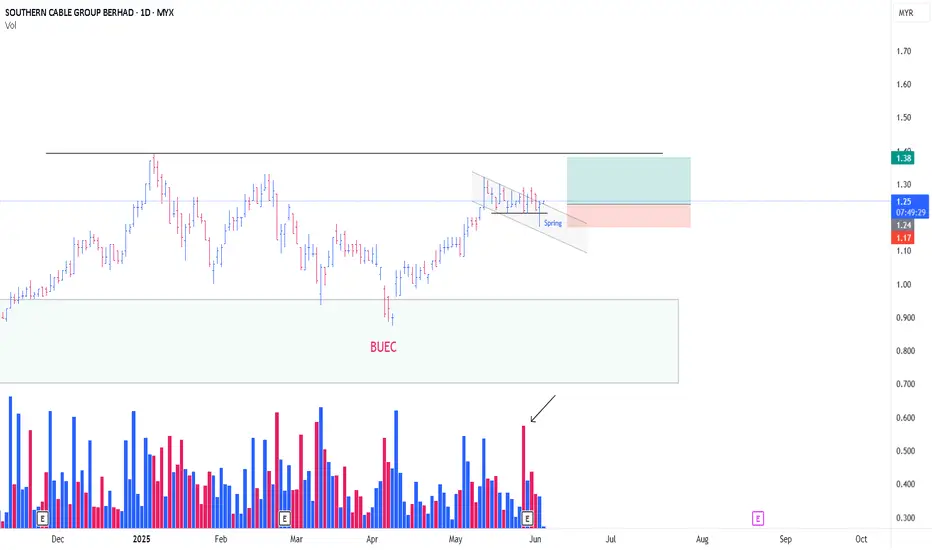
SCGBHD WILL CONTINUE MARKING UPThis is just a continuation from my previous trading idea for SCGBHD
**Refer below
I was liquidated from the position yesterday
Now, looks like at the minimum, i was too early for this stock previously.
With the formation of Spring-Type Action ,
And the On-Going absoprtion especially supply from 28/5 (Black arrow)
I initiated my position as attached
PureWyckoff
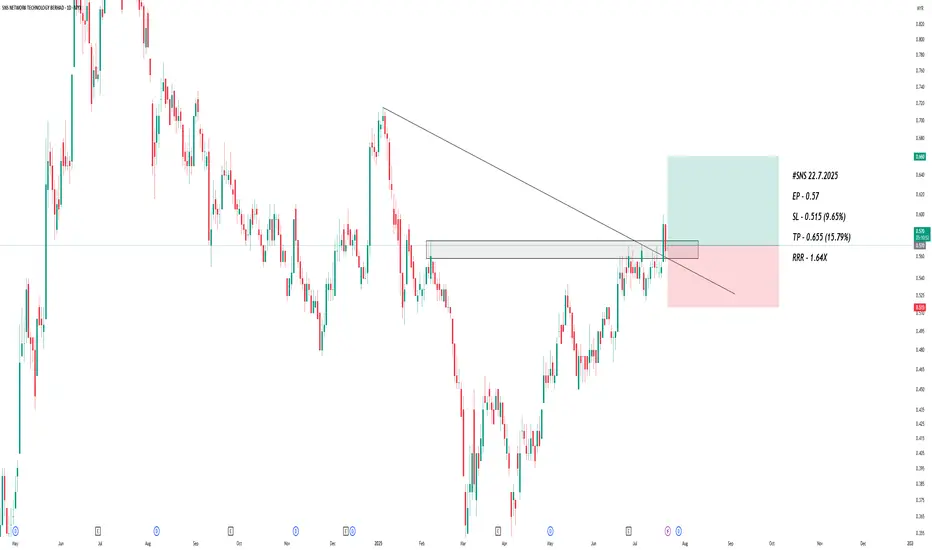
MNHLDG GOING TO CONT MARK UPI maintained my previous thesis for MNHLDG
**please refer to my previous
Just need an addition, for the formation of new 'Local Spring' *black color word
i was knocked out on last position for this
market environment dragged MNHDLG despite with a positive surrpise earning
Based on Spring Setup,
looks like Test Of The Spring success at the moment
i initaited position as attached with tight cut loss
PureWyckoff

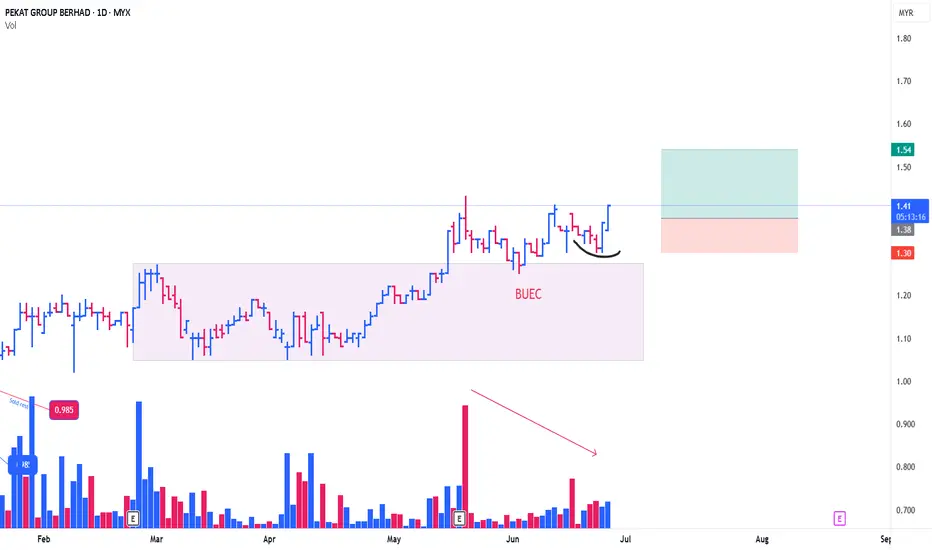
PEKAT CONT MARKING UPThis is a continuation of my prev thesis for Pekat
**Refer prev post
Since my previous position, Pekat has been always under my radar.
(This is a Stepping Stone Zone, Continuation from previous Mark Up Phase)
what caught my attention, the formation of BUEC consistenly unfolding in the background of reducing supply (red arrow)
With the formation : type #2 schematic of feather's weight (black line)
*No springboard here. difficult to see this kind of setup
although the entry point, a bit extended comparing to my average price entry, but it was still contained within the limit (not more than 2%)
Position intiated as attached
PureWyckoff
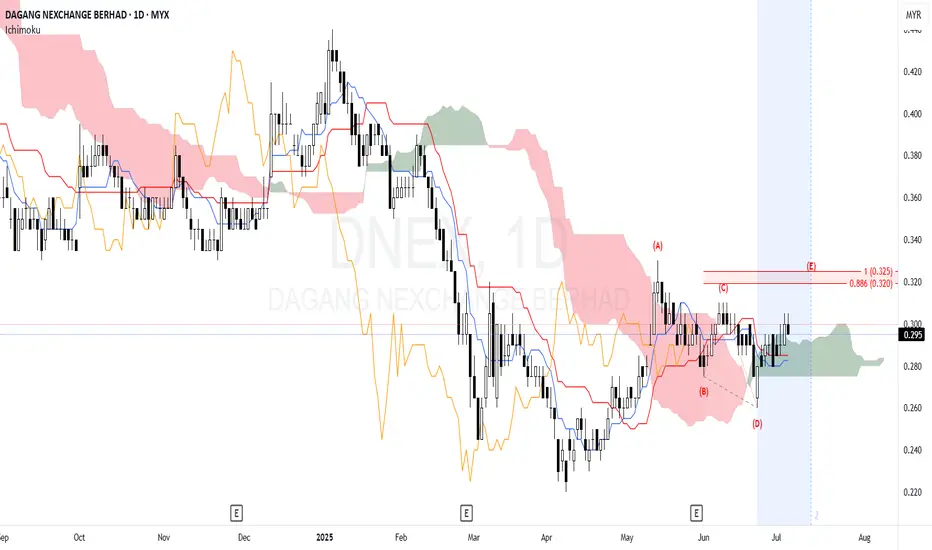
DNEX - Looking for bullish continuationP wave with target (E) within stipulated time.
The last traded price is around 0.296.
The price has recently moved above the Kumo. This suggests a potential shift towards a bullish sentiment or at least a consolidation phase above the previous resistance.
The Chikou Span is above the price action of 26 periods ago and is also above the Kumo, which is a bullish signal.
After a downtrend from early 2025, the stock found support around RM 0.230 in April. Since then, it has been attempting a recovery, forming what appears to be a potential inverse head and shoulders pattern or at least a base. The stock has pulled back slightly and is currently consolidating above the Kumo.
Immediate resistance at. If price can be maintained above this level, it may achieve the target (E) 0.320-0.325.
Immediate support is provided by the top of the Kumo and Tenkan Sen, currently around 0.285 - 0.290. Stronger support is seen at the bottom of the cloud and the previous swing low around 0.270.
Overall Trend:
Long-term: Bearish, but showing signs of bottoming out and attempting a reversal.
Medium-term: Neutral to slightly bullish, as the price is above the Kumo and the Chikou Span is strong.
Short-term: Consolidating with a bullish bias, provided it stays above the Kumo.
Entry Strategy:
Aggressive Entry: Consider an entry on a rebound from the current support area (top of Kumo/Kijun-sen) around 0.290 - 0.295, with confirmation of bullish candlestick patterns.
Conservative Entry: Wait for a confirmed breakout above the strong resistance at 0.325. A strong close above this level, ideally with increased volume, would be a more reliable entry signal.
Stop-Loss:
For Aggressive Entry: Place stop-loss below the bottom of the Kumo, perhaps around 0.265 - 0.270. A close below this level would negate the current bullish setup.
For Conservative Entry (after 0.325 breakout): Place stop-loss below the breakout level, perhaps around 0.310 or below the Kijun-sen if it starts to flatten/rise with the price.
Note:
1. Analysis for education purpose only.
2. Trade at your own risk.
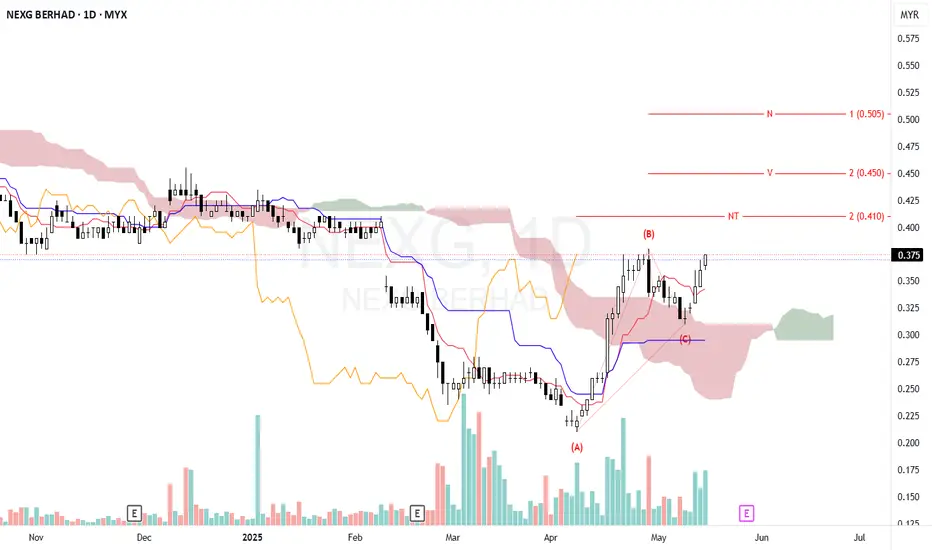
NEXG - Looking for potential bullish sentiment.N wave with N, V & NT projection.
The stock has been in a downtrend until mid-March 2025, bottoming around 0.22 MYR.
Since then, a recovery wave formed with a classic ABC corrective pattern:
(A) bottom in mid-April
(B) a peak near 0.39 MYR
(C) a higher low near 0.30 in early May
The price recently moved above the down Kumo, indicating a potential trend reversal from bearish to bullish.
Entry: Consider entering a long position around the current price (0.375) since the price has broken above the down Kumo, indicating bullish momentum.
Stop-Loss: Set a stop-loss slightly below the recent low/C point (around 0.295 - 0.30) to minimize downside risk.
Monitor volume and price action closely around resistance zones.
If price fails to sustain above the cloud or drops back below 0.35, consider exiting the position to protect capital.
Note:
1. Analysis for education purposes only.
2. Trade at your own risk.
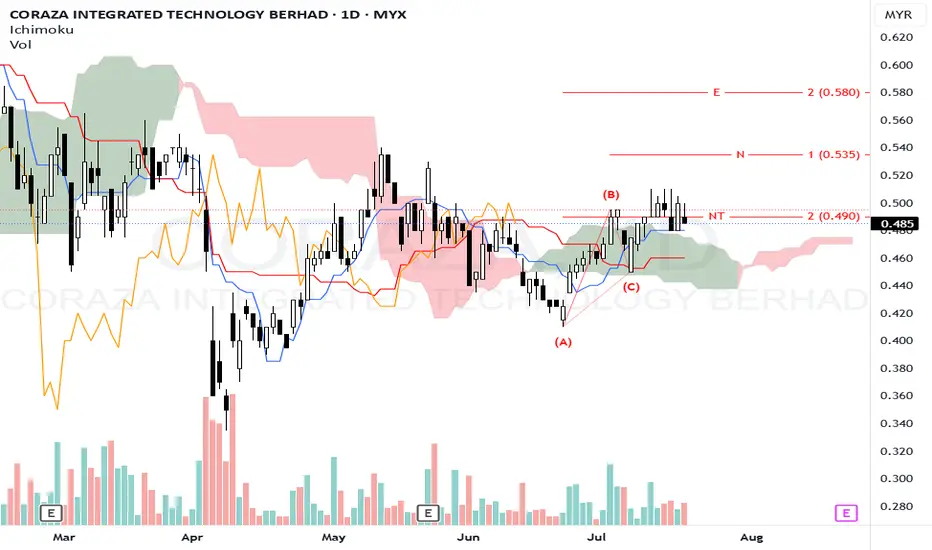
CORAZA - POTENTIAL PRICE MOVEMENT.N wave with E, N & NT projection.
The price is above the Kumo with Tenkan-sen as immediate support (0.480).
Price needs to maintain above NT level (0.490), confirming bullish continuation and act as immediate resistance.
Entry: Consider entering a long position if the price convincingly breaks above the NT projection level (around 0.490) with volume confirmation.
Stop Loss: Place a stop-loss just below the recent low, around 0.460, to manage downside risk.
Target Levels:
Initial target (N wave projection): 0.535
Extended target (E wave projection): 0.580
Note:
1. Analysis for education purposes only.
2. Trade at your own risk
SIMEPROP... cooking going to tp3 dailySimeprop ... make move goint to tp3 daily
but be caution have divergence ..
TAYOR


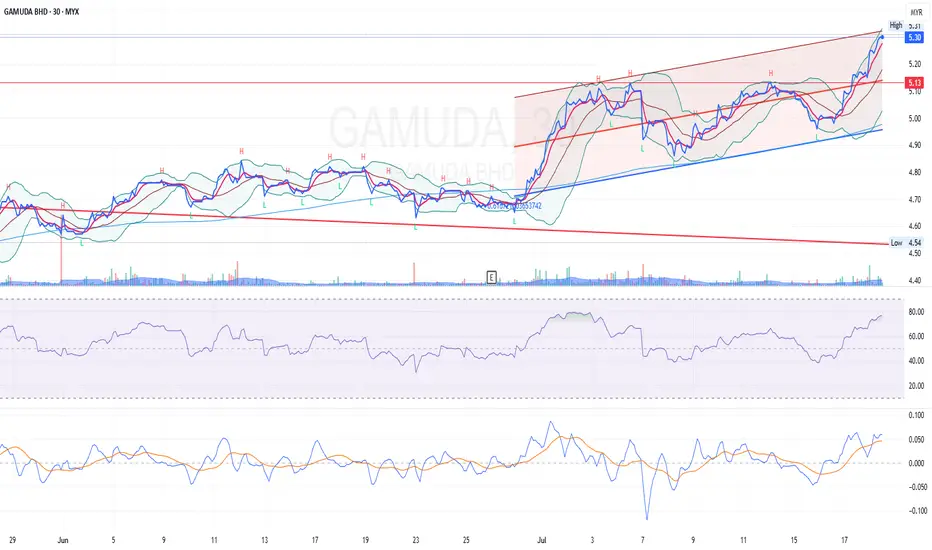
GAMUDA 30-Min Trend Channel Breakout – Short-Term Bullish Setup I've been tracking GAMUDA closely on the 30-minute timeframe, and this setup caught my attention due to the confluence of technical signals pointing towards a potential short-term breakout continuation.
Trend Context:
Price is moving within a well-defined ascending parallel regression trend channel. Recently, it rebounded strongly off the lower channel boundary, respecting the channel support before accelerating toward the upper range.
Bollinger Band Action:
The price is currently riding along the upper Bollinger Band, a sign of a trend-strengthening move. This expansion typically signals momentum continuation, especially when supported by volume and broader trend alignment.
Momentum Signals:
RSI is pushing into overbought territory (>70), which in the context of a breakout and strong trend, may indicate strength rather than reversal.
MACD shows a bullish crossover with both lines trending upward, confirming ongoing momentum.
Volume Confirmation:
Volume has been gradually increasing on up candles—suggesting participation and interest in the bullish move.
Resistance & Breakout Area:
The price just cleared a minor horizontal resistance at 5.13, confirming a micro breakout within the channel.
Trade Idea:
Entry Zone: Between RM 5.26 – RM 5.30 (current market area, post breakout)
Profit Target 1: RM 5.38 (near upper channel resistance)
Profit Target 2: RM 5.45 (projected breakout extension)
Stop Loss: RM 5.13 (below recent structure support and mid-channel zone)
This setup offers a favorable RRR (Risk-Reward Ratio) if entered near the current breakout region and managed closely.
Key Takeaways:
Timeframe: 30-minute
Trade Type: Momentum breakout within ascending trend channel
Indicators Used: Bollinger Bands, RSI, MACD
Strategy: Buy on strength with tight stop-loss; ride the channel
Disclaimer: This analysis is shared for educational purposes and is a personal chartist idea. It is not a buy/sell recommendation. Please manage your own risk and do your due diligence.
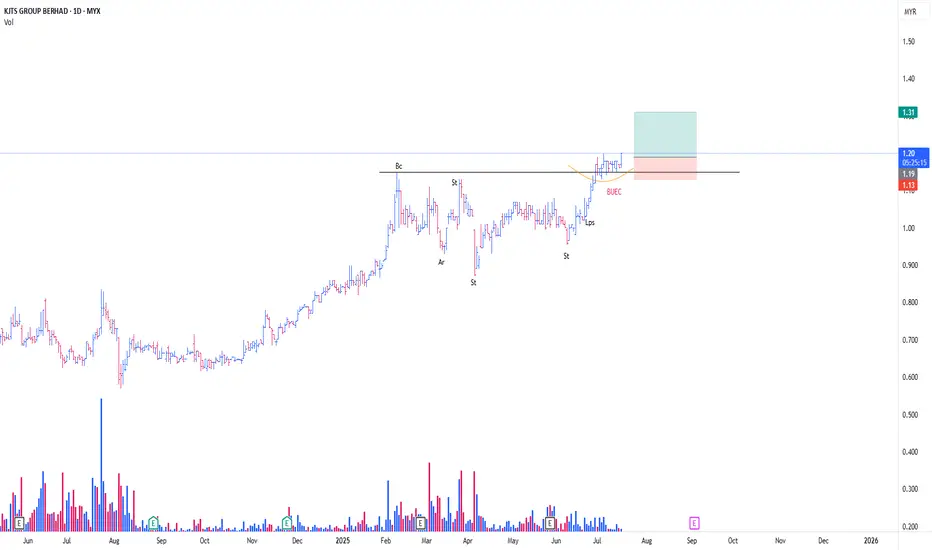
KJTS CONT MARKING UPThis is just a continuation of my prev thesis
**please refer to the link below
Turned out, KJTS formed Type #2 Schematic of Reaccmulation (Rising Bottom)
As it looks now, current price action seems to be confirming BUEC
**Buec is part of Phase D of Wyckoff Event
Noticed the formation of Feather's Weight (Yellow Line), coincided with BUEC
Bought a position today in view of Trigger Bar
Ep + SL as attached
PureWcykoff