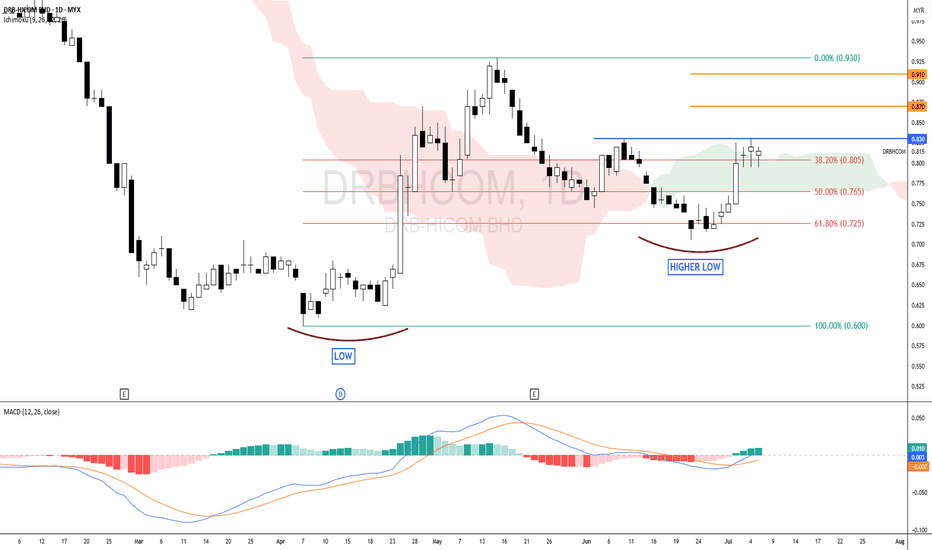
DRBHCOM - The LOW is getting HIGHER !DRBHCOM - CURRENT PRICE : RM0.815
The stock made a HIGHER LOW recently - this may consider as a half portion of new uptrend is completed. A breakout above RM0.930 will form the higher high structure - which confirm the new uptrend phase.
For short term trading purposes, short term traders may anticipate to buy if the stock breakout nearest resistance of RM0.830 - which will give an entry point at RM0.835. So this is a pending breakout stock. Nearest target will be RM0.870 and RM0.910. While support will be RM0.795. Take note also that MACD give a bullish hint.
ENTRY PRICE : RM0.835
TARGET : RM0.870 and RM0.910
SUPPORT : RM0.795
Notes : If the stock breakout RM0.930 in the future, it is a sign of strong bullish momentum (strong uptrend). So at that particular time, trend follower traders may anticipate to buy at RM0.935 - RM0.940.
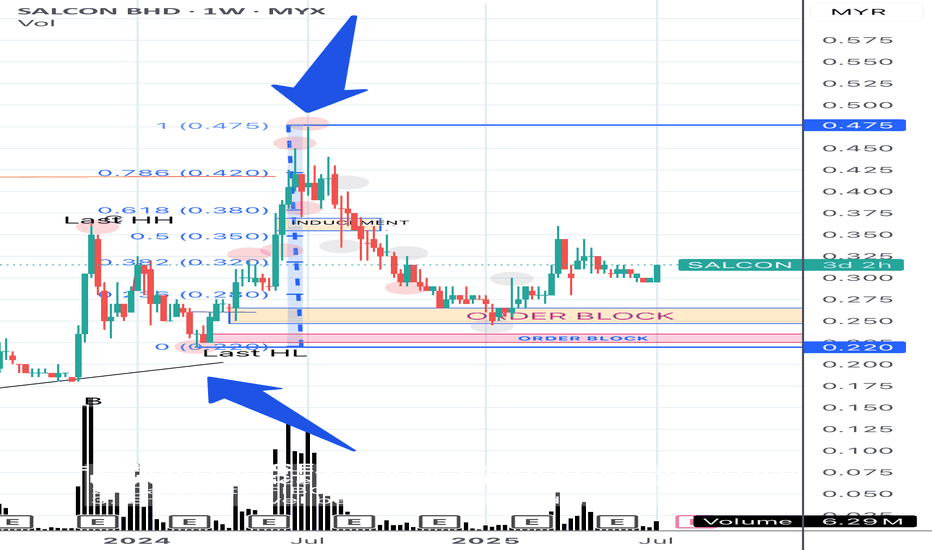
SALCON: UPTREND MAY CONTINUEChart - uptrend
If the price breaks 0.475, uptrend may continue provided the breakout should followed with high volume as confirmation of trend continuation.
Entry: Below 0.50 FIBO
the price may visit unmitigated/order block. (pink colour)
SL : Below 0.215 ( the previous HL)
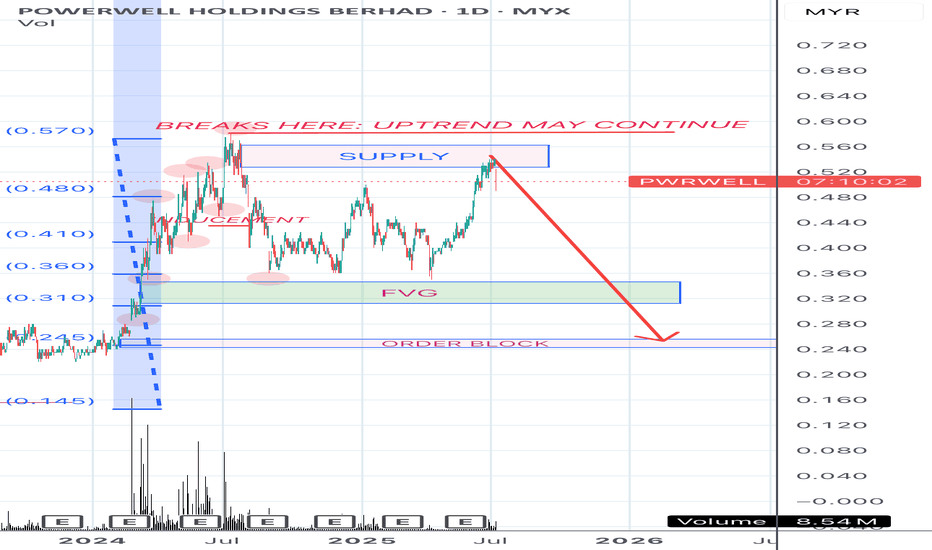
MANIPULATION TOWARDS DISTRIBUTION?Chart - sign of manipulation
If the price breaks 0.580, uptrend may continue provided the breakout should followed with high volume as confirmation of trend continuation.
As for now, just wait and see whether the chart is making distribution pattern or not.
If yes, the price may visit unmitigated/order block. Let’s see and good luck!
#trade at your own risk
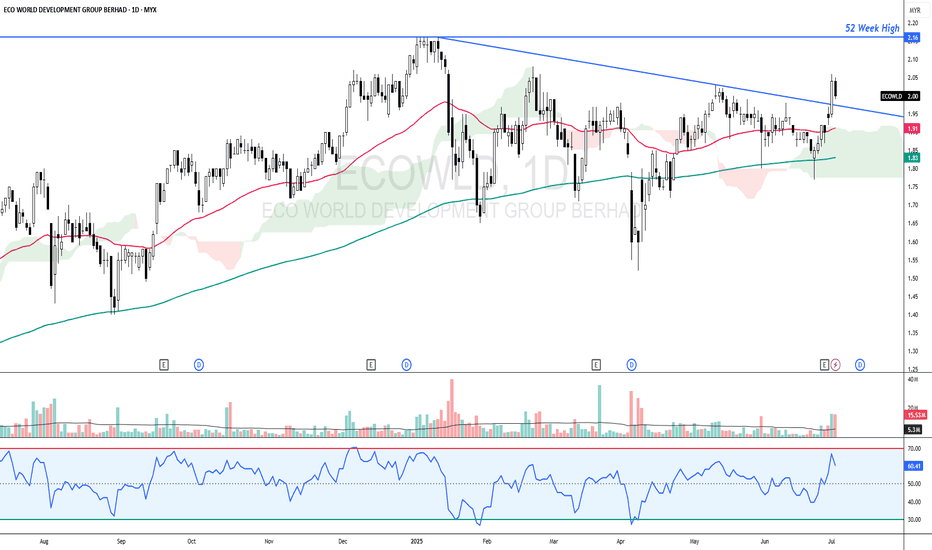
ECOWLD - Heading towards 52 WEEK HIGH ?ECOWLD - CURRENT PRICE : RM2.00
ECOWLD broke out a 6 month down trendline on 01 JULY 2025 with high trading volume indicating strong bullish momentum. The stock is bullish as the price is above both 50 and 200 EMAs. Furthermore the share price is near 52 Week High. RSI is above 50 and below 70 indicating stock is bullish and not considered overbought yet. Nearest target will be RM2.16 (52 Week High resistance) and then if the trend resume, it may propel higher to hit next target at RM2.28. Support level is the low of 23 JUNE 2025 candle - RM1.77.
ENTRY PRICE : RM1.99 - RM2.02
TARGET : RM2.16 and RM2.28
SUPPORT : RM1.77
Notes : On 26 JUNE 2025 the company announced its increasing QUARTERLY EARNINGS. May visit company website or TheEdge for get more information.
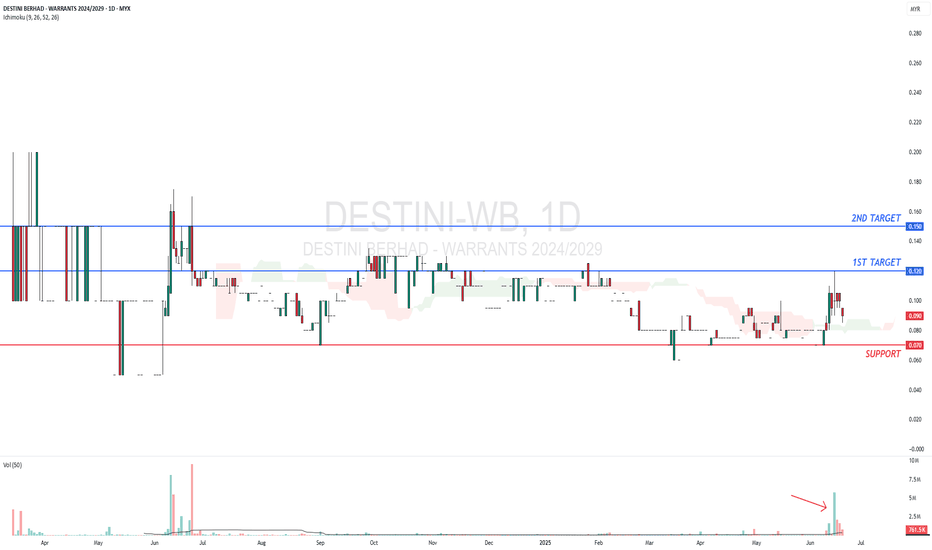
DESTINI-WB - May follow its mother share ?DESTINI-WB - CURRENT PRICE : RM0.090
This warrant is an illiquid and a bit difficult to trade. However recently alot of trading activity takes place as we can see in the volume bar. This is due to its mother share DESTINI (7212) broke out from its accumulation phase on 12 JUNE 2025. At the same time, it also makes a NEW 52 WEEK HIGH. The company's fundamental is improving. Traders may take this opportunity to buy the company's warrant as it is so cheap and have potential of following its mother share. Furthermore, the expiry dates is on 06 MARCH 2029.
ENTRY PRICE : RM0.085 - RM0.100
TARGET : RM0.120 (33.33%) and RM0.150 (66.67%)
SUPPORT : RM0.070 (-22.22%)
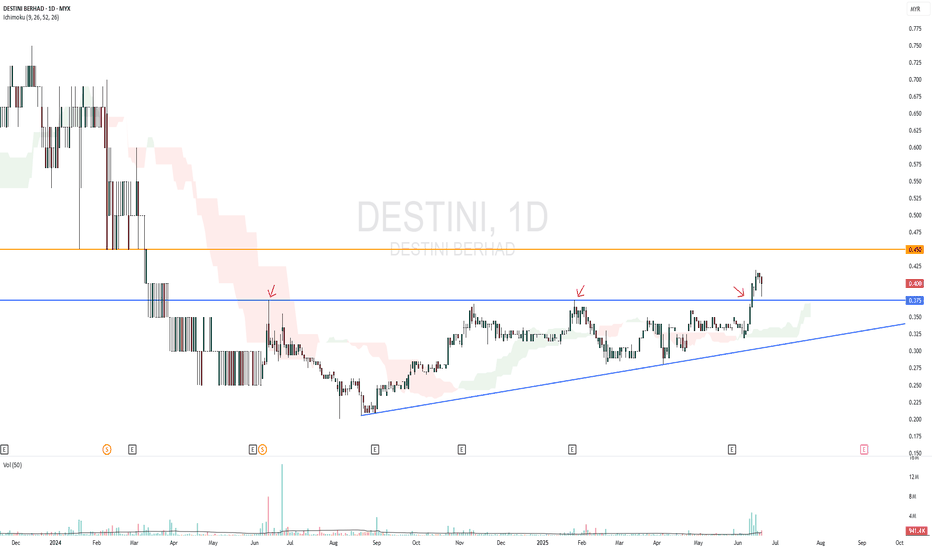
DESTINI - MARK UP PHASE STARTS ?DESTINI - CURRENT PRICE : RM0.400
DESTINI broke above resistance on 12 JUNE 2025 with burst in trading activity. It was the BREAKOUT of ACCUMULATION PHASE and 52 Week High. Today (19 June 2025) the stock touched RM0.380 and reversed back to close higher at RM0.400 - indicating a lot of buying interest near the support level RM0.375 (previously resistance and now become strong support). This is an early stage of an uptrend and is a good opportunity to buy near support level.
ENTRY PRICE : RM0.380 - RM0.400
TARGET : RM0.450 and RM0.490
SUPPORT : RM0.375
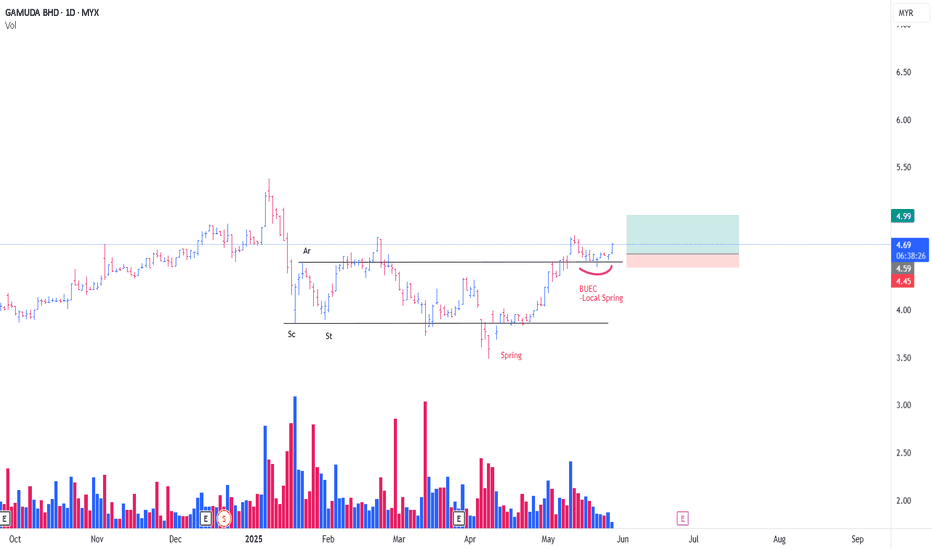
GAMUDA CONT MARK UPThis is a continuation of my prev post
**Refer link below
In Wyckoff Methode , The Formation of BUEC is a sign that further price advancement will continue
to the phase E (Marking up outside the Trading Range)
The BUEC in this formation, coincide with a Local Spring
On Top of that, with a Feather's weight & Springboard in it
With a Trigger Bar today, position initiated as attached
PureWyckoff
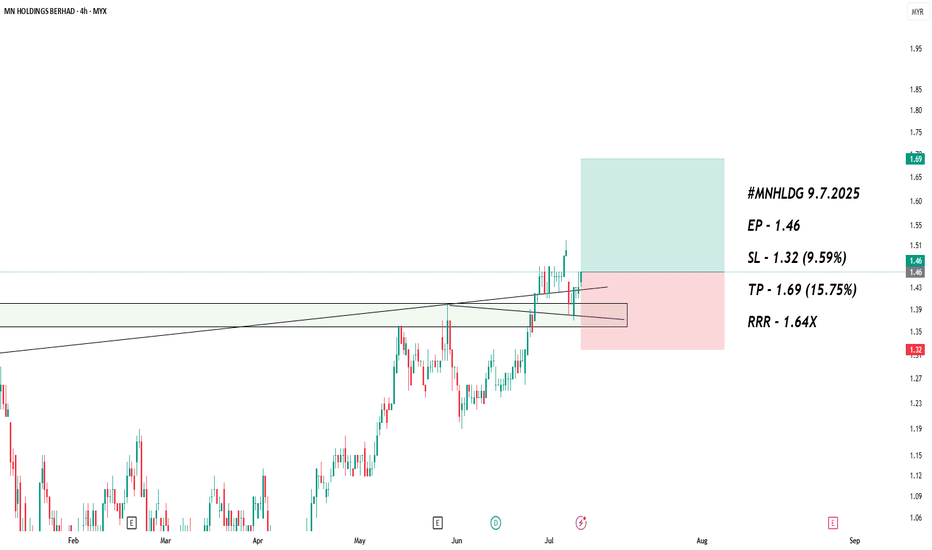
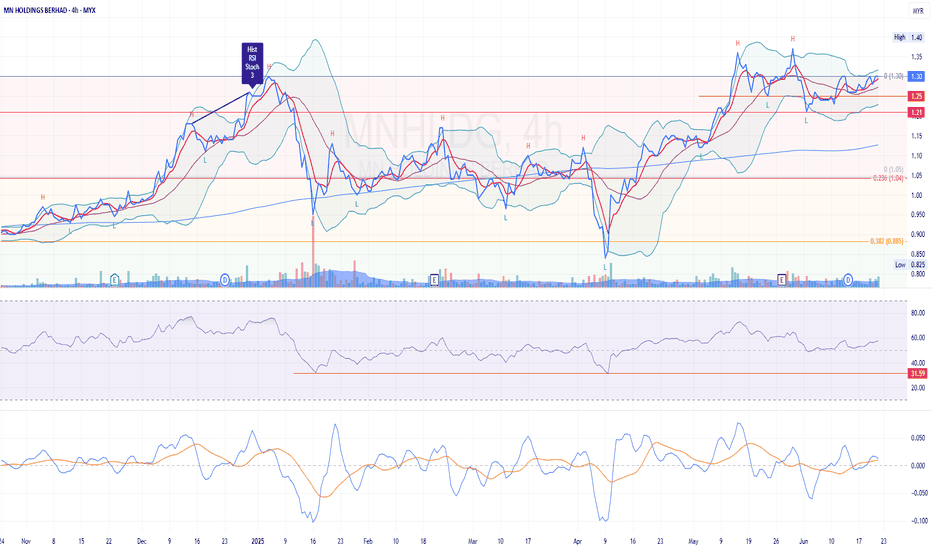
MNHLDG 4H Chart Analysis & Trading Plan SummaryBased on the 4-hour TradingView chart for MNHLDG, the stock is currently trading near RM1.30 and showing signs of attempting a retest towards its previous high near RM1.40. However, looking at the overall setup, we anticipate a possible short-term pullback before any potential breakout occurs.
Key Observations:
Trend & Structure: The stock has been trending upward with higher lows and is currently trading within a consolidation zone between RM1.25 and RM1.30. The horizontal resistance at RM1.30 has been tested multiple times, indicating seller presence at this zone.
Volume: Volume remains relatively flat with no significant surge, suggesting cautious accumulation rather than strong breakout momentum.
Indicators:
RSI is hovering just below the overbought region (~60), suggesting that while momentum is positive, a short breather may happen.
Stochastic Histogram shows a weakening bullish crossover and may begin to flatten or dip soon, supporting the pullback scenario.
Bollinger Bands are tightening slightly, implying upcoming volatility but not necessarily an immediate breakout.
Support Zones:
RM1.25 (minor support and previously tested level).
RM1.21 (more significant support — also in confluence with the mid-Bollinger line and prior swing low).
Resistance: RM1.30 (immediate), followed by RM1.40 (ATH).
Trading Plan:
Entry Zone (Accumulation Area):
RM1.25 to RM1.21 (look for bullish reversal candle or bounce confirmation).
Profit Target (TP):
TP1: RM1.30 (first resistance, quick trade opportunity).
TP2: RM1.40 (all-time high — strong resistance).
Stop Loss (SL):
Below RM1.18 (under previous swing low — invalidates the bullish structure).
Risk-Reward:
From RM1.22 entry, SL at RM1.18 and TP at RM1.40 offers a solid 4.5:1 reward-to-risk setup.
Summary:
MNHLDG shows a healthy uptrend with a potential for new highs, but current indicators suggest a temporary pullback could occur before the next leg up. A more ideal entry would be near RM1.22–1.25 support zone, riding the wave towards RM1.30 and possibly RM1.40. Be patient for a proper setup confirmation.
Disclaimer: This analysis is for educational purposes only and does not constitute a buy or sell recommendation. I am not affiliated with any brokers or advisory firms.
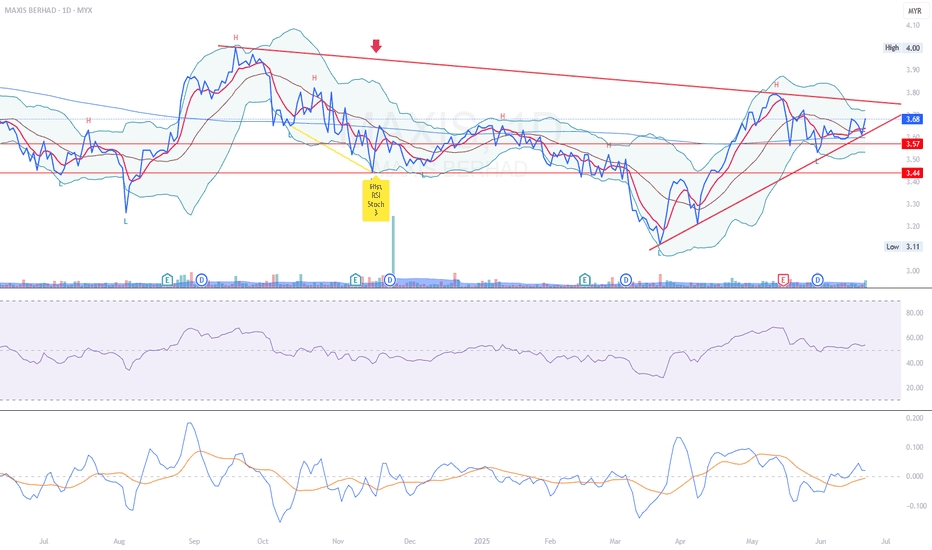
MAXIS Daily Chart Analysis & Trade Plan Summary - 4W June 2025Based on the daily chart, MAXIS is moving in an upward trend after bouncing from a strong support area.
The price is now approaching a long-term downtrend resistance, and your entry at RM3.63 is positioned just before this key level.
The plan is to take profit at RM4.01, which sits near the upper resistance line, while the stop loss is set at RM3.44 to protect against downside risk.
Indicators like RSI and MACD are showing positive momentum, supporting the potential for further upside.
This setup offers a healthy balance between risk and reward, with a clear plan aligned with your capital and tolerance level.
Disclaimer:
This analysis is for educational purposes and part of a chartist sharing session. It is not a buy or sell recommendation. I am not affiliated with any brokers or investment firms. Please do your own research and consult a licensed financial advisor before making any trading decisions.
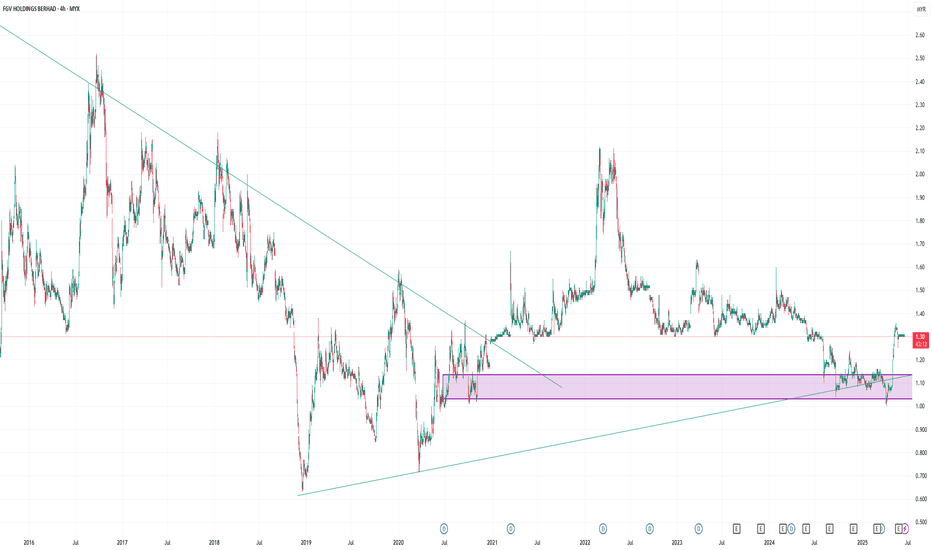
FGV potential to Triple your fundBreakout Higher Time frame and trend keep uptrend.
Expected TP 3.20
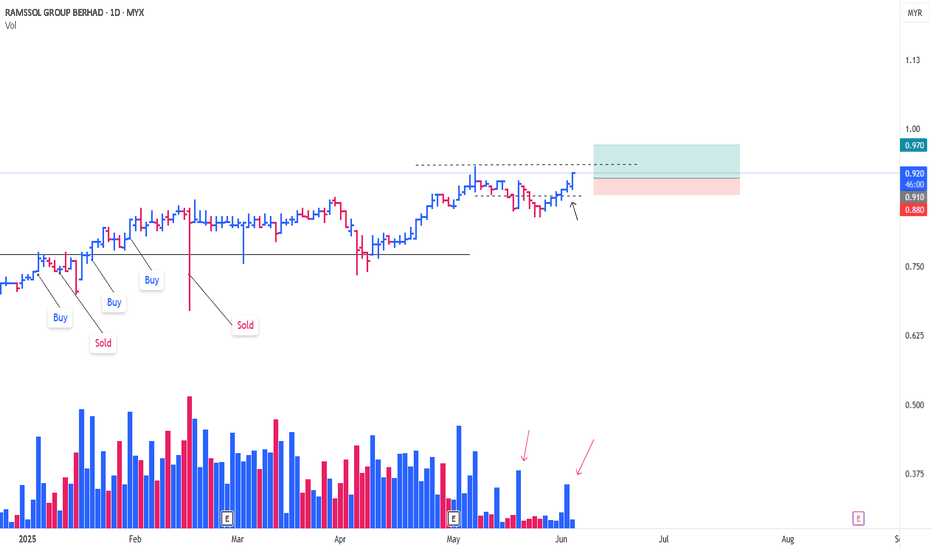
RAMSSOL MARKING UPA rising bottom type of re-accumulation
With the influx of demand (Red Arrow)
Followed by very short term SpringBoard (4/6/25, Black Arrow)
- #1 Springboard, absoprtion Type
**Atypical Type of Springboard
position initiated today based on the Trigger Bar with a very tight risk
Purewyckoff
