PHARMA - Looking for bullish movementN wave with E, N & NT projection.
The stock has recently broken above a significant downtrend line, signaling a potential trend reversal from a prolonged downtrend.
It also recently moved above the Kumo, confirming bullish momentum.
Pullback after the wave B peak around 0.32, currently consolidating near the Kumo top with support around 0.28-0.29.
Price above cloud - a bullish signal.
Tenkan-sen above Kijun-sen - short-to-mid-term bullish.
Kumo ahead is thin, indicating little resistance on the upside.
Enter near current price or on a slight pullback to support near 0.28-0.29, which aligns with the Kumo top and recent consolidation.
Stop loss below the Kumo (~0.265) protects against a reversal.
Ride the uptrend to target zones, ideally scaling out partial profits at each projection level to lock gains.
The volume breakout in early May confirms strength – a good sign for sustained movement.
Note:
1. Analysis for education purposes only.
2. Trade at your own risk.

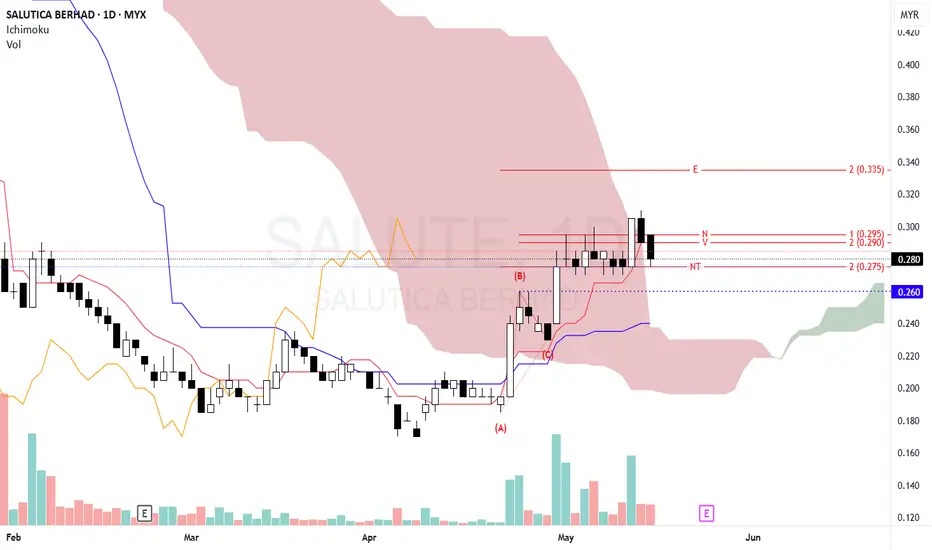
SALUTE - Looking for bullish continuationN wave with E, N, V & NT projection.
The price is currently at 0.280, slightly below recent highs around 0.290–0.295.
Recent candles show some selling pressure, indicated by a volume increase and a drop from the highs.
Price is currently trading near the edge and above the Kumo suggesting a bullish momentum.
Immediate support: NT level at 0.275.
If price holds above NT level 0.275:
Look for consolidation or potential bounce. This level acts as a pivot; a bounce here could test recent highs again near 0.295 and potentially higher.
If price drops below the NT level, the next key support is around 0.260 marked by a previous consolidation zone and a potential bounce area.
A break below NT might signal a deeper correction or trend test.
Price action at NT (0.275):
Look for reversal patterns like bullish engulfing, hammer, or increased buying volume before entry.
Volume:
Confirm strength of rallies with higher volumes on up days.
Breakouts:
If price breaks and closes convincingly above recent highs (0.295), it could signal continuation towards the next targets.
Caution:
A breakdown below 0.260 suggests potential for deeper correction. Adjust stop loss and risk accordingly.
Note:
1. Analysis for education purposes only.
2. Trade at your own risk.
Sunlogy challenging the 50% Golden RatioOverall chart shows that the price moving upward and breaking the previous DTL.
Potential Ascending Double Bottom detected at 0.26. We may see the confirmation of this pattern once it breakout above 0.26 and price stay above.
This may resulting uptrending movement and challenging to close the previous gap located between 0.26 to 0.28
Looking forward for what’s going to happen.
This is mainly for education purposes and not a trading advice.

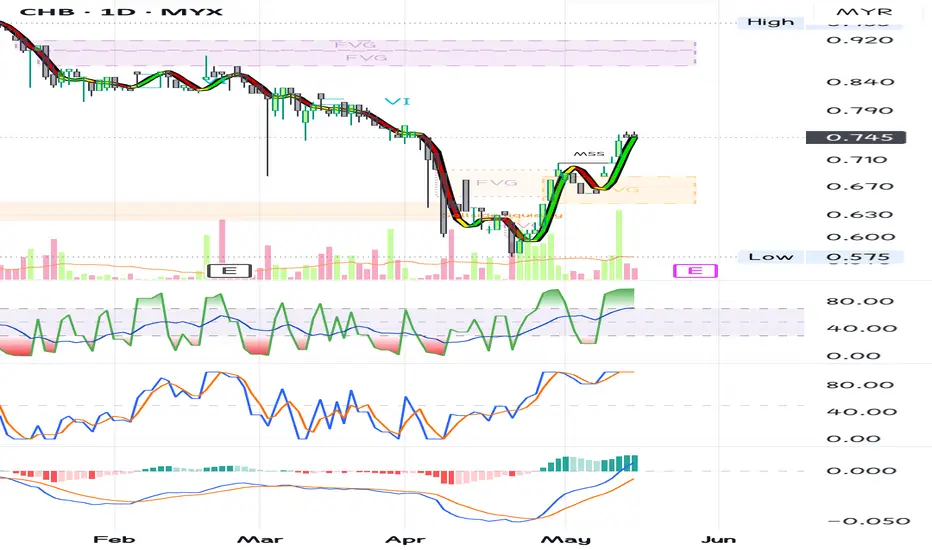
CHB, 0700 area can hold?If the 0.700 level fails to hold as support (considering its role in closing the gap and aligning with the trendline), it may signal a continuation of the downtrend.
A decisive breakdown below this area could indicate weakening bullish momentum, increasing the probability of further downside. Key confirmation factors include volume expansion on the breakdown and failure to reclaim the level in subsequent attempts.
Disclaimer: This analysis is for informational purposes only and should not be considered financial advice. Trading involves risk, always conduct your own research and risk management.
Sunlogy, uptrend line can support?Strong resistance stands at 0.275 ~ 0.290... The question now is whether this move is just to close the gap or if it has the strength to break out.
Currently, indicators are showing overbought conditions... making it more likely to see a pullback soon. During that pullback, it's crucial for price to stay intact with the uptrend line... A clean break below it would weaken the bullish structure and turn the chart setup less appealing.
Disclaimer: This is not a buy/sell call. Always analyze carefully and manage your risk according to your trading strategy.

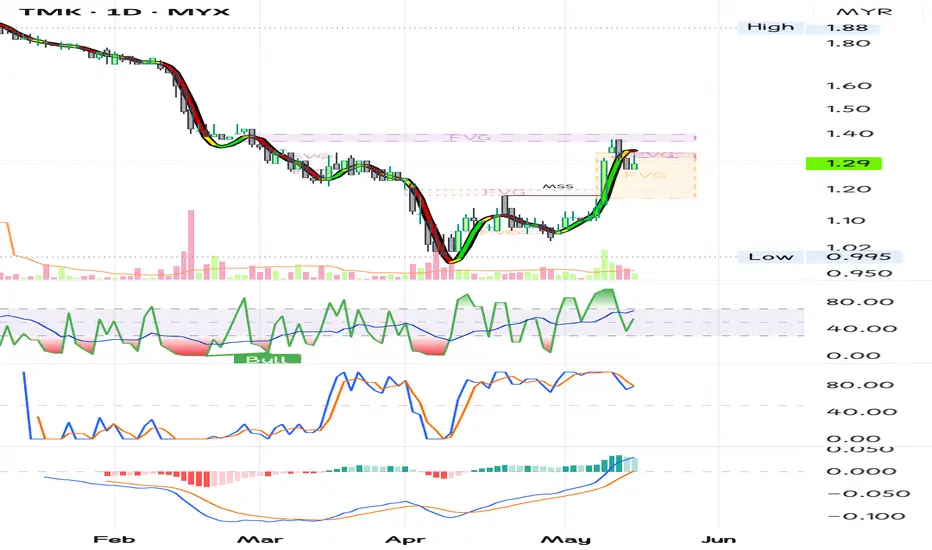
TMK, reach peak for this round?The 1.380 ~ 1.440 zone remains a strong resistance area... Price has struggled to break through this level before.
This is still a purebear stock, trading fully within a long-standing downtrend channel... The support zone sits around 1.180 ~ 1.270. Let’s see if price pullback to test this area... or if it breaks down further, continuing the bearish momentum.
Disclaimer: This is not a buy/sell call. Always evaluate market conditions and manage risk based on your own trading plan.
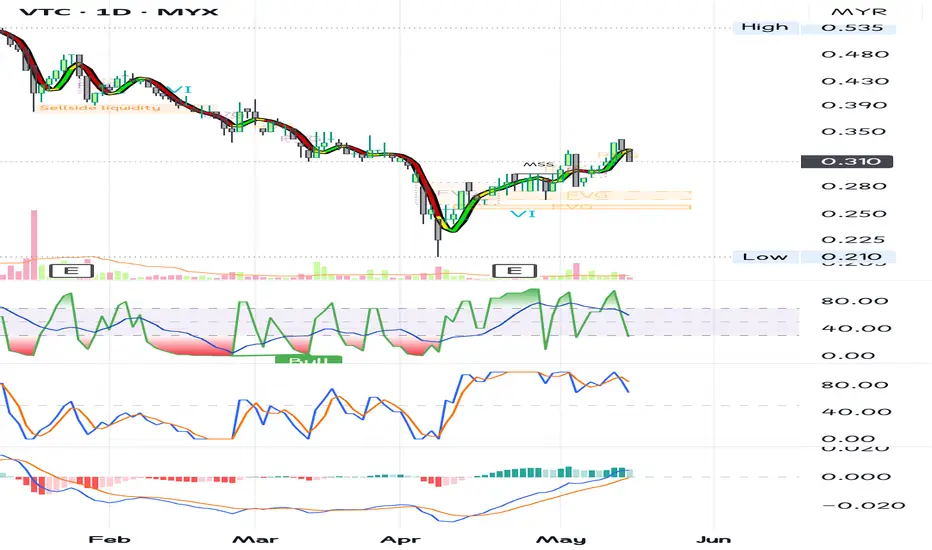
Vtc, pullback soon?Operators might have already gained around 60% from the all-time low of 0.210... The big question now is whether there will be a healthy pullback before attempting to challenge the next resistance at 0.340 ~ 0.350.
For latecomers, the risk-reward isn’t as attractive anymore... Upside may be limited, while downside risk increases, especially if momentum starts fading.
Looking at the weekly candlestick, TA traders will likely assess if the structure supports continuation... Is there volume follow-through? Does the candle close strong or show signs of exhaustion? These are key clues to watch.
Disclaimer: This is not a buy/sell call. Always perform your own analysis and manage risk according to your trading strategy.
Sygroup, momentum still strong?I made it a habit to place remarks on charts and follow up later... This helps me reflect on whether my analysis or assumptions were correct.
Without marking or taking notes, it's hard to track progress or improve over time... This process keeps me accountable and sharpens my decision-making.
As for now... can sygroup continue its momentum? Maybe, but a pullback looks more likely at this stage... just another wild guess, unless price action confirms otherwise. Watch how it reacts near short-term support or trendline for clues on the next move.
Disclaimer: This is not a buy/sell call. Always follow your trading plan, review your setups, and manage risk carefully.

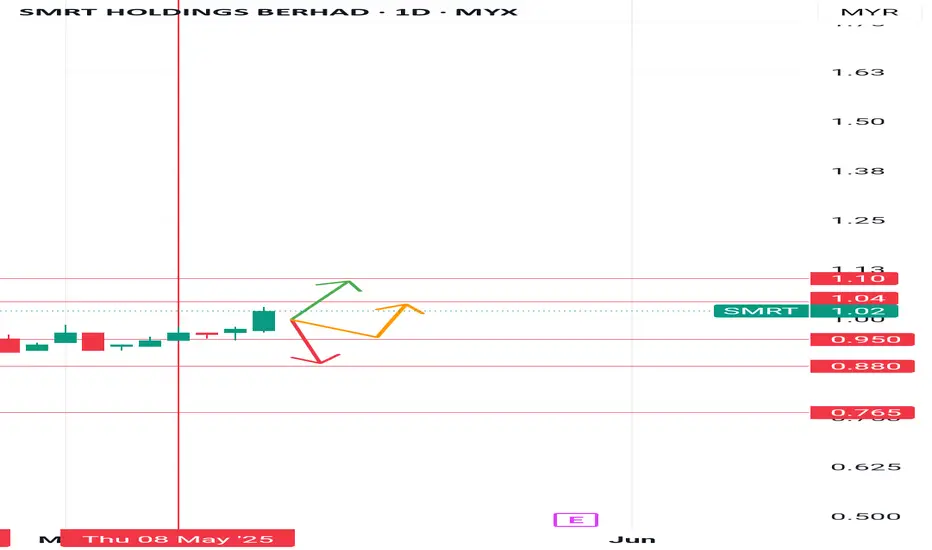
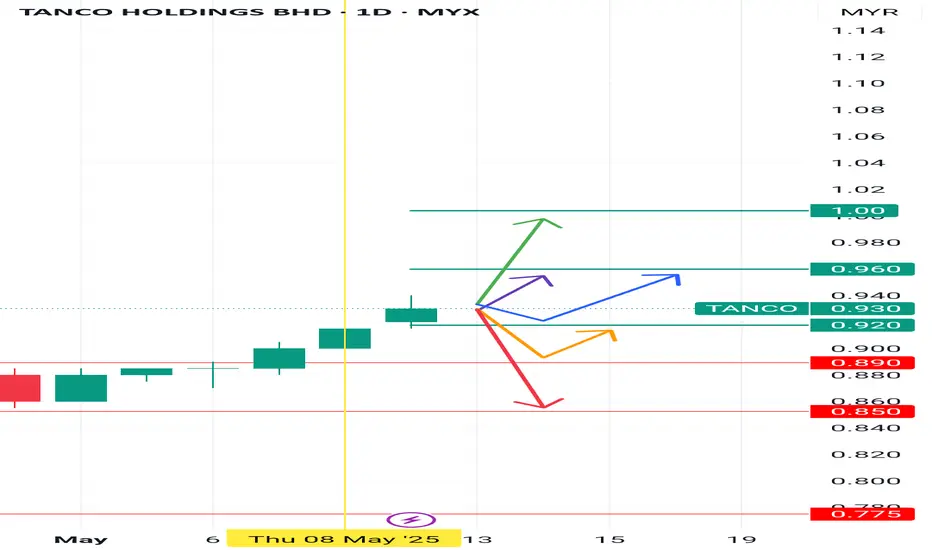
SALCONThe way price of i thinking.. i dont know what will happen.. At here, i just put memorial of the way i thinking.. It doesnt matter right or wrong.. If wrong, i will learn something new.. if right, it just right... Time will tell us the price will go up or down.

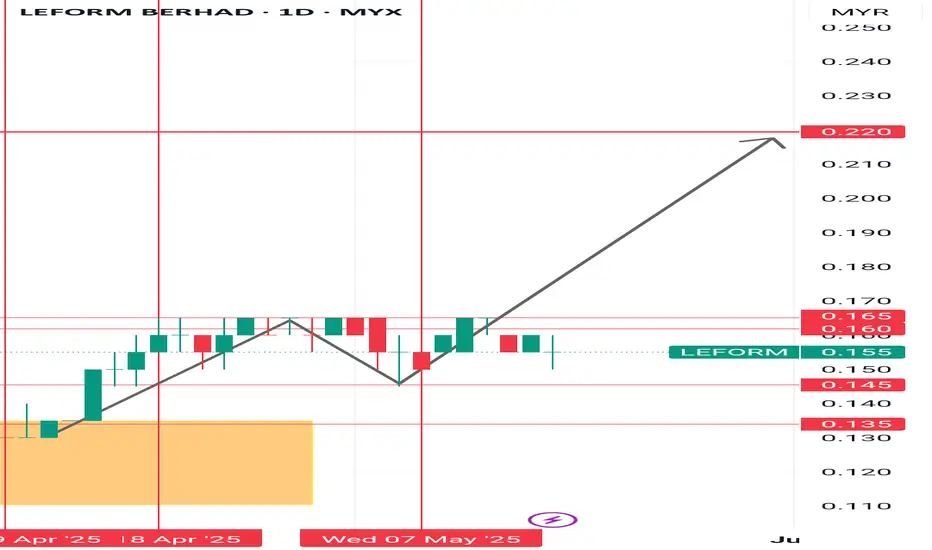
LEFORMPrediction the way price will move.. This just my opinion.. As trader, you can choose the way you want..
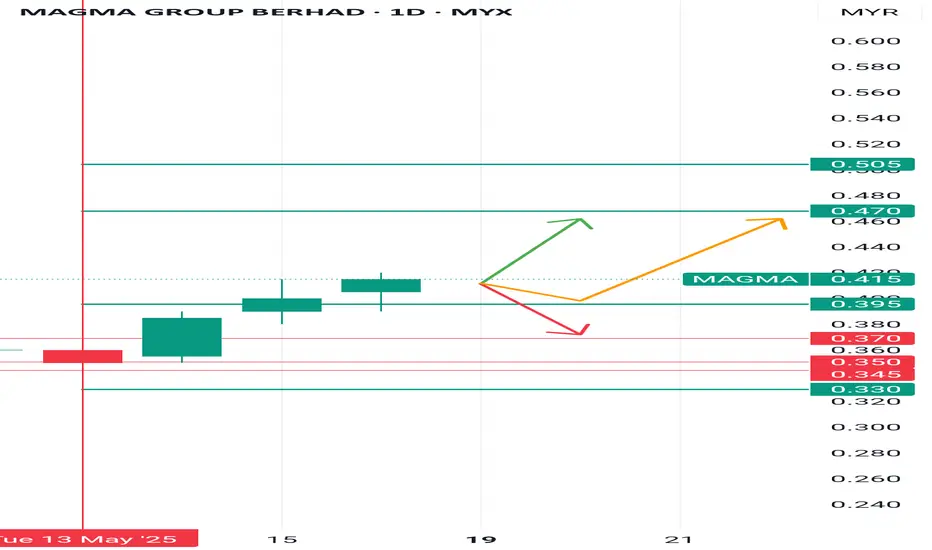
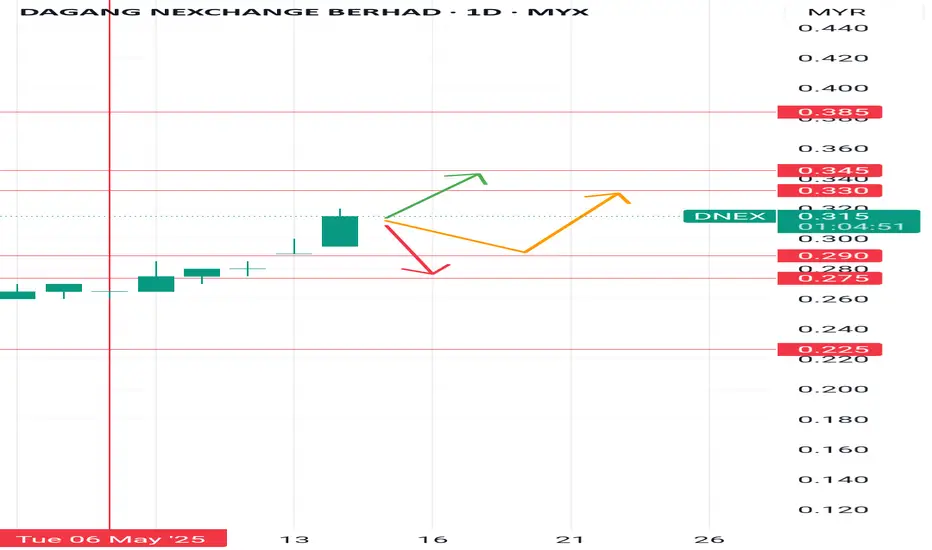
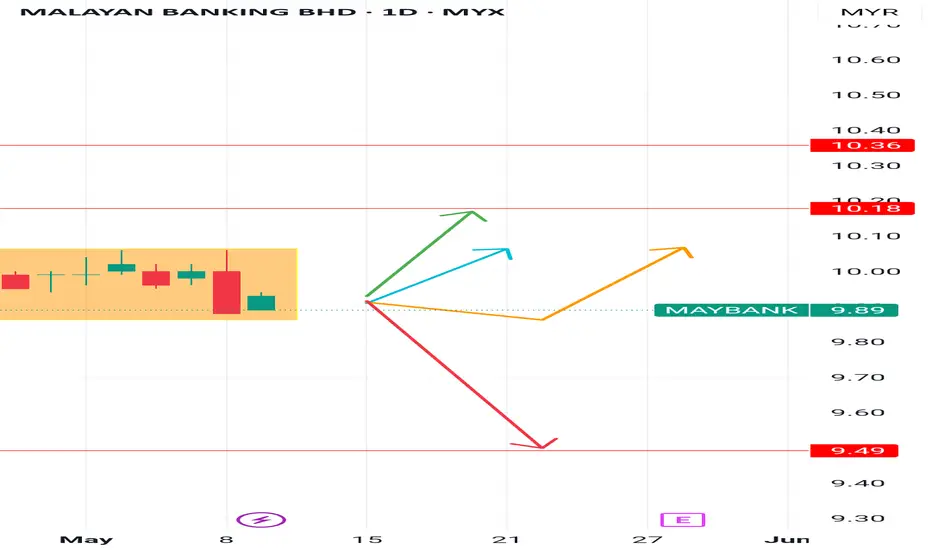
MAGMAThe way price will move
1.. Red arrow
2.. Orange arrow
3.. Green arrow
Trader will choose the way what their think
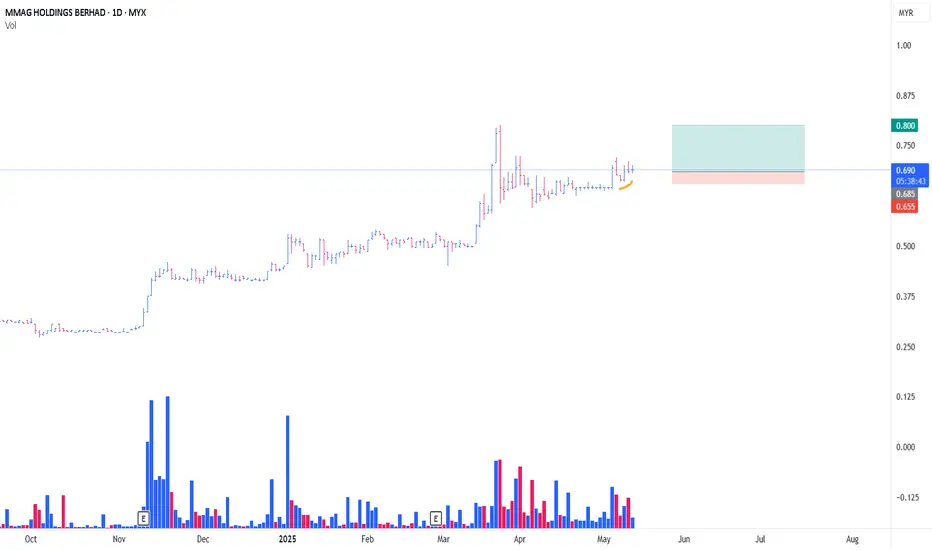
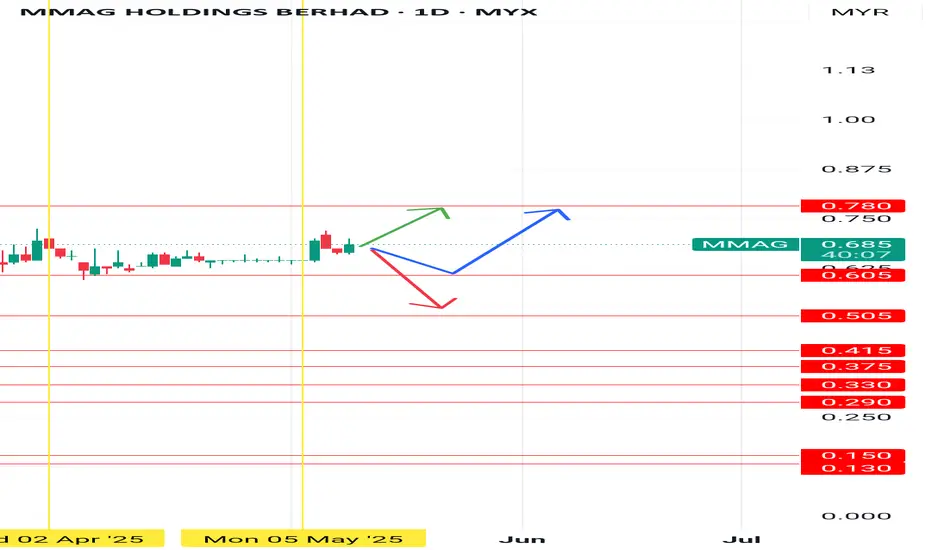
MMAG MARKING UPTypical Re-Accmulation pattern #2 The Rising Bottom
In view of formation feather's weight & possible SpringBoard (Yellow Color)
i always buy on strength , seldom on weakness
-but looks like , institutions have interest for MMAG.
Position intiated as attached
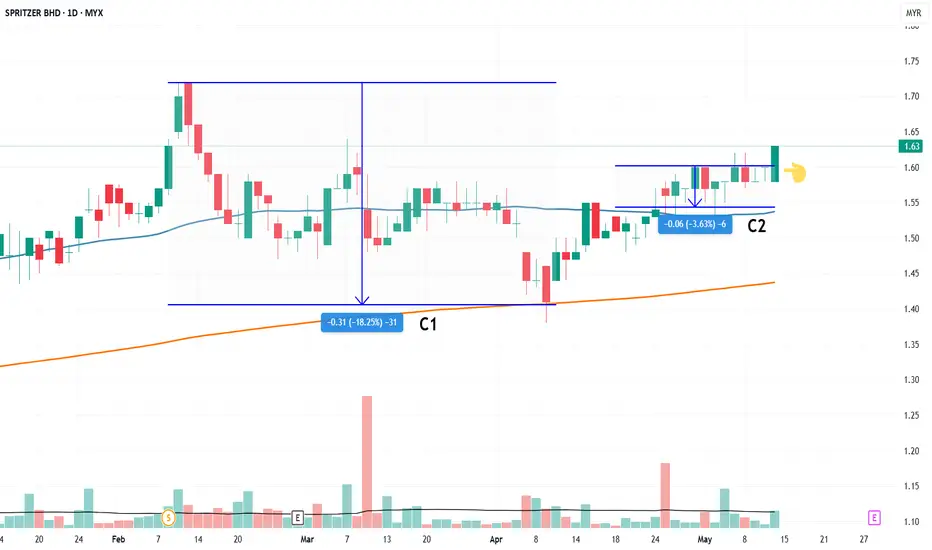
SPRITZER VCP SetupHow was everyone? 2024 construction sector really got a good rally! :)
My previous analysis for construction index:
SPRITZER VCP with 2 contraction:
C1:~18.25%
C2:~4%
Will it breakout and go to ATH?
NOTIONThe way of price
1.. Red Arrow
2.. Green arrow
What ever trader choose, trader will wait fot outcame


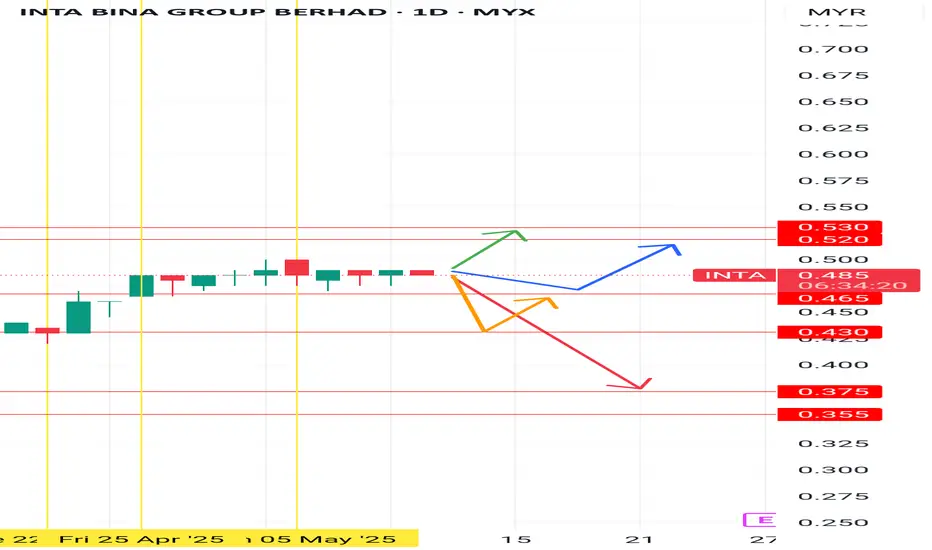
IntaWhich way you will walk....
1.. Red Arrow
2.. Orange Arrow
3.. Blue Arrow
4.. Green Arrow
We trader.. we choose what we are
GtronicWhich way trader will choose...
1.. Red Arrow
2..Blue Arrow
3.. Green Arrow
What will we choose.. that what we are..
