Investment Opportunity: A Review of UBA Shares in NSMIntroduction:
In the dynamic landscape of the Nigerian Stock Market, understanding the fundamental aspects of a company like UBA is crucial for investors seeking lucrative opportunities. In this review, we delve into the key metrics and performance indicators of UBA shares, providing insights and recommendations for potential investors.
Fundamental Analysis:
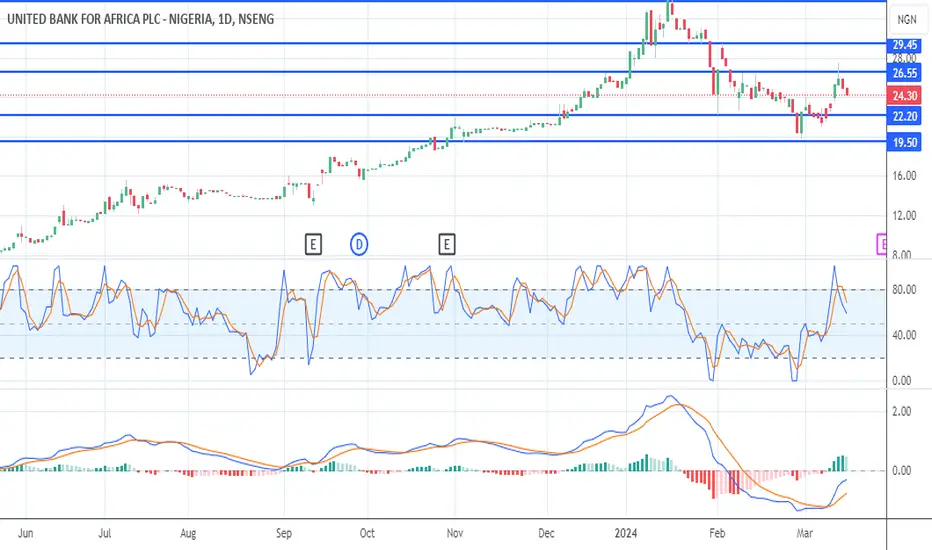
Current Performance: UBA's bid/ask prices stand at 24.40/24.45, reflecting stable trading activity. With a previous close of 24.9 and an open of the same value, the stock exhibits consistent market presence.
Price Range: UBA shares have seen a day's range of 24.5-25, highlighting moderate volatility within the trading session. However, the 52-week range of 7.7-34 showcases substantial growth potential.
Volume and Market Cap: With a volume of 2,723,610 and an average volume of 33,068,225 over three months, UBA maintains a significant market presence. The market cap of 831.05B further solidifies its position as a prominent player in the Nigerian market.
Financial Performance: UBA's revenue stands at 1.02 trillion, reflecting its robust operational performance. The P/E ratio of 1.69 indicates an undervalued stock, presenting an attractive opportunity for investors.
Dividend Yield: With a dividend yield of 5.76%, UBA offers an attractive income stream for investors. The streak of 11 consecutive dividend payments underscores its commitment to shareholder returns.
Growth Potential: UBA has demonstrated an impressive 1-year change of 203.73%, indicating substantial growth momentum. Moreover, its EPS of 14.49 and a book value per share of 50.42 highlight its strong financial standing.
Recommendation:
Considering UBA's solid financial performance, consistent dividend payments, and growth potential, it presents a compelling investment opportunity in the Nigerian Stock Market. Investors seeking stability, income, and capital appreciation can consider adding UBA shares to their portfolio.
Conclusion:
In the ever-evolving landscape of the Nigerian Stock Market, UBA emerges as a standout performer with promising prospects. By leveraging its strong fundamentals and market position, UBA shares hold the potential to deliver significant returns for investors. However, as with any investment, conducting thorough research and seeking professional advice is paramount to making informed decisions.
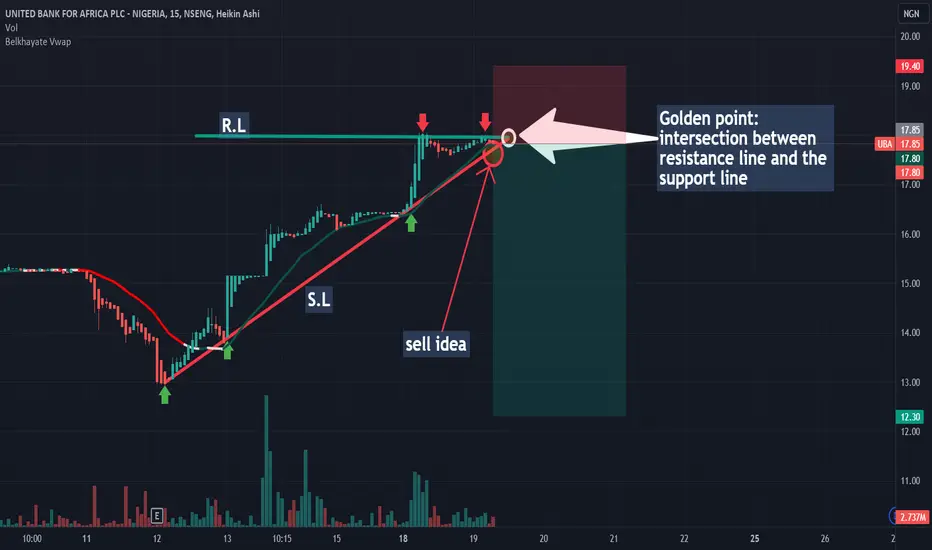
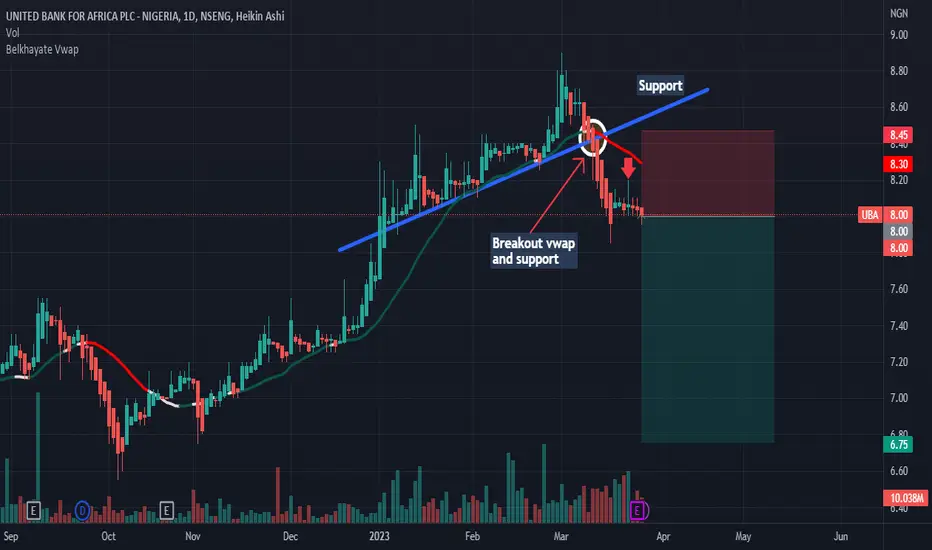
UBA: Sell ideaSell idea on UBA as you see on the chart if only if we have the breakout with force the vwap indicator and the support line by a big red candle with a large red volume.Thanks.
LOOK FOR BUYHello,
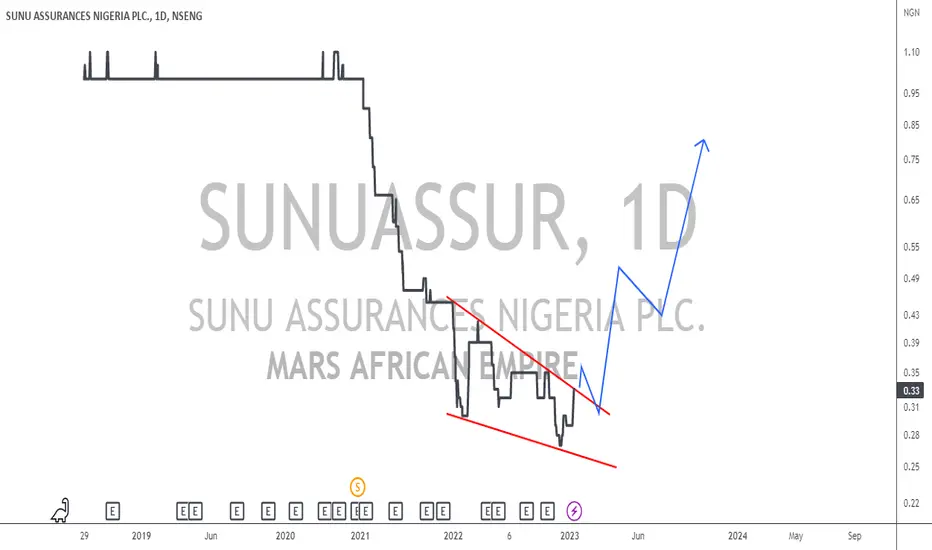
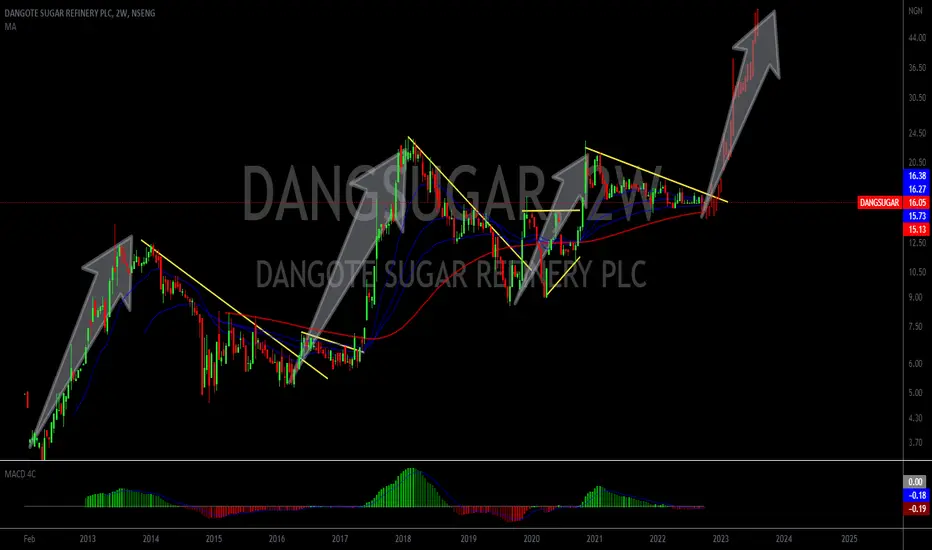
Dangote sugar stock chart from a technical view. Stock at a good place for buy.
Dangote Sugar Refinery Plc engages in the manufacture, refining, marketing, and distribution of sugar products. It involves in refining of raw sugar into edible sugar and the selling of refined sugar. The firm operates through the following geographical segments: Northern Nigeria, Western Nigeria, Eastern Nigeria and Lagos.
Market Capitalization 194.957B
Enterprise Value (MRQ) 71.156B
Enterprise Value/EBITDA (TTM) 1.1764
Total Shares Outstanding (MRQ) 12.147B
Price to Earnings Ratio (TTM) 6.5652
Basic EPS (TTM) 2.4447
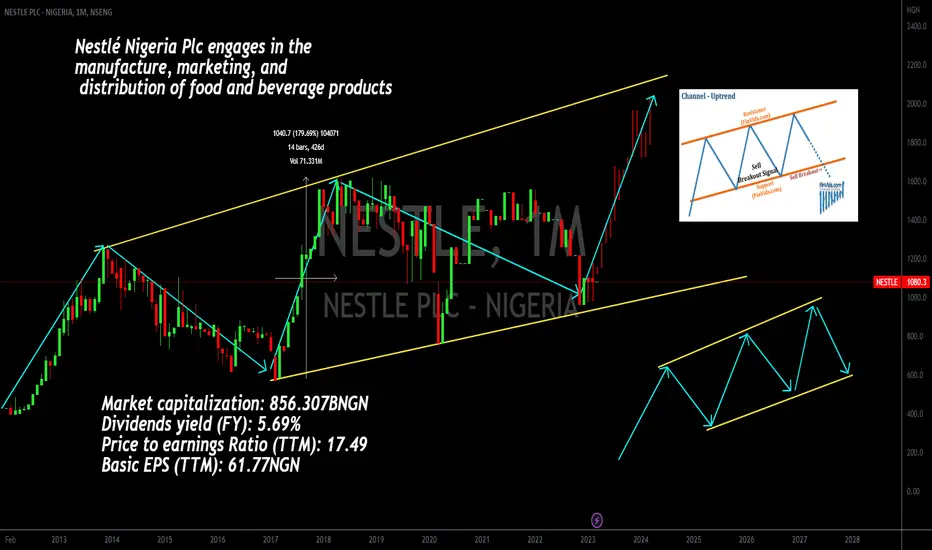
Look for a small buy to the topHello,
Nestlé Nigeria Plc engages in the manufacture, marketing, and distribution of food and beverage products. It operates through the Food and Beverages segments. The Food segment produces and sells food products under the Maggi, Cerelac, Nutrend, Nan, Lactogen, and Golden Morn brands. The Beverages segment offers products under the Milo, Chocomilo, Nido, Nescafe, and Nestlé Pure Life brands.
FY Revenue 446.82 Billion Naira, UP 27%
FY profit 48.97 Billion Naira, UP 22%
Final dividend proposed N36.50K
More info about the company can e found on their website
www.nestle-cwa.com
Good luck.
Cap Oil and cap hotel might see a push downthis guys might continue to go down after their PLO, they need to seek a strong demand which they will then use to climb
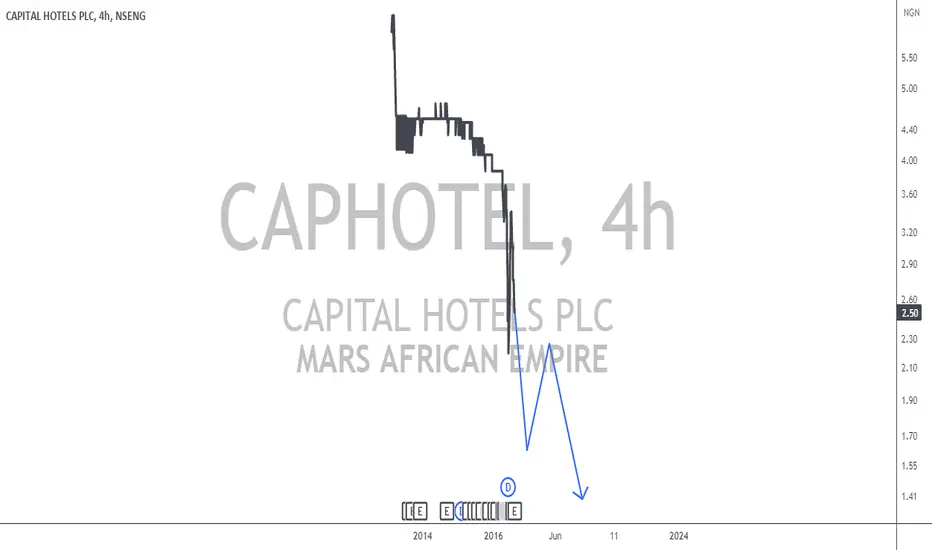
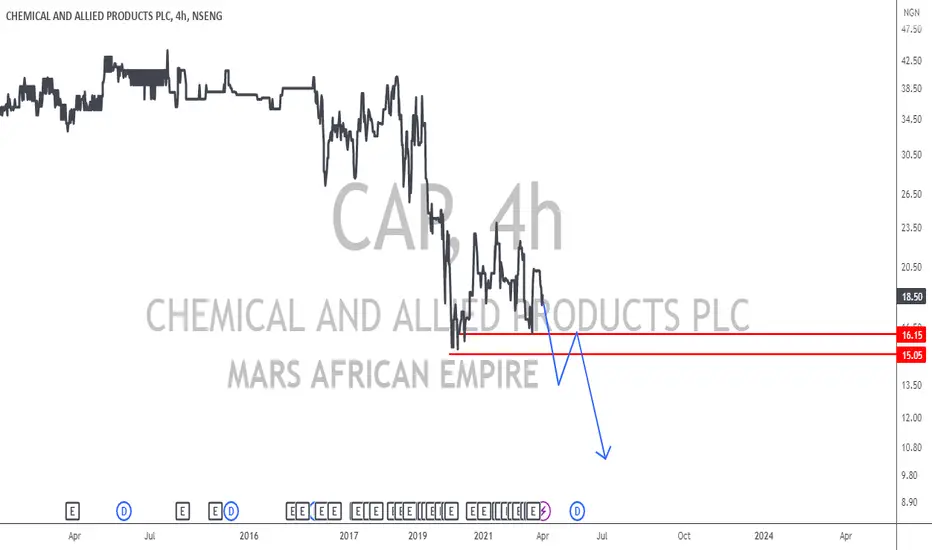
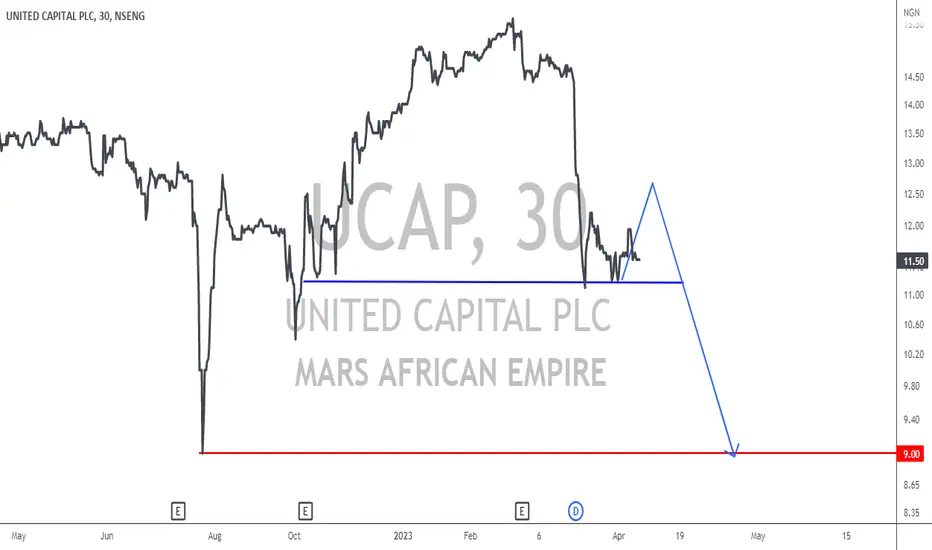
Cap might continue to DropWe might see this guys continue to push down, if it breaks then we might see a retest on that demand zone then another fall

THE FIRST QT OF A THINK:We are upcoming to the proving if could be call portfolio manager or is just a claim of position or title.
It's close last week and why you should wait for the trend to be done for the fact that today is like these and is favorable for entry or exit
I will be concerns but before that could you assist to know if there is other than me that is call Noble maumau-trend portfolio.
Trading channelsHello,
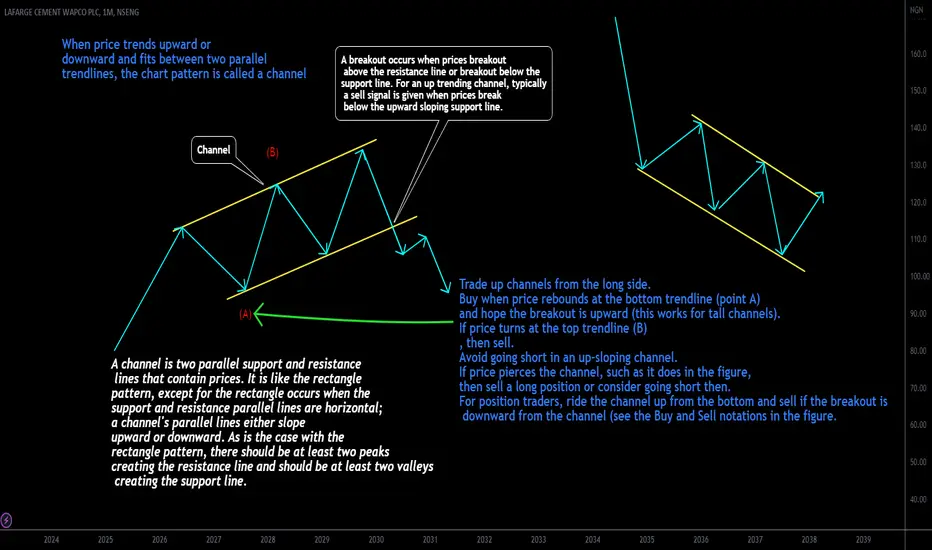
Channels are great setups to catch reversals. When price trends upward or downward and fits between two parallel trendlines, the chart pattern is called a channel.
Channel trading is a popular strategy in financial markets that involves identifying and trading within a channel formation on a price chart. A channel is formed when a financial instrument's price movement oscillates between two parallel trendlines, one acting as a resistance level and the other as a support level.
Traders can use channel trading to identify potential buying and selling opportunities. The strategy involves buying when the price reaches the lower trendline (support) and selling when the price reaches the upper trendline (resistance). Traders can also use other technical indicators, such as momentum indicators and moving averages, to confirm their trades.
When trading channels, it is important to consider the strength of the channel and the overall trend of the market. A strong channel is one that has been tested multiple times and has a consistent slope. If the channel is weak, it may be more susceptible to breakouts and false signals.
Channel trading can be used in a variety of financial markets, including stocks, currencies, and commodities. However, as with any trading strategy, there are risks involved, and traders should carefully consider their risk tolerance and develop a solid trading plan before using this approach in the markets.
Good luck
UBA: Downtrend continuityAs you see on the chart we have a big probability to have a downtrend continuity.Thanks!
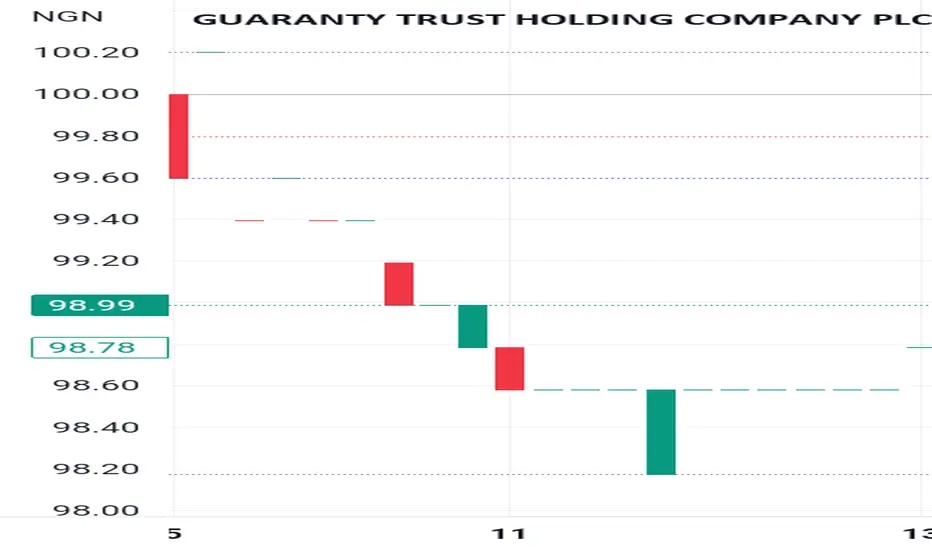
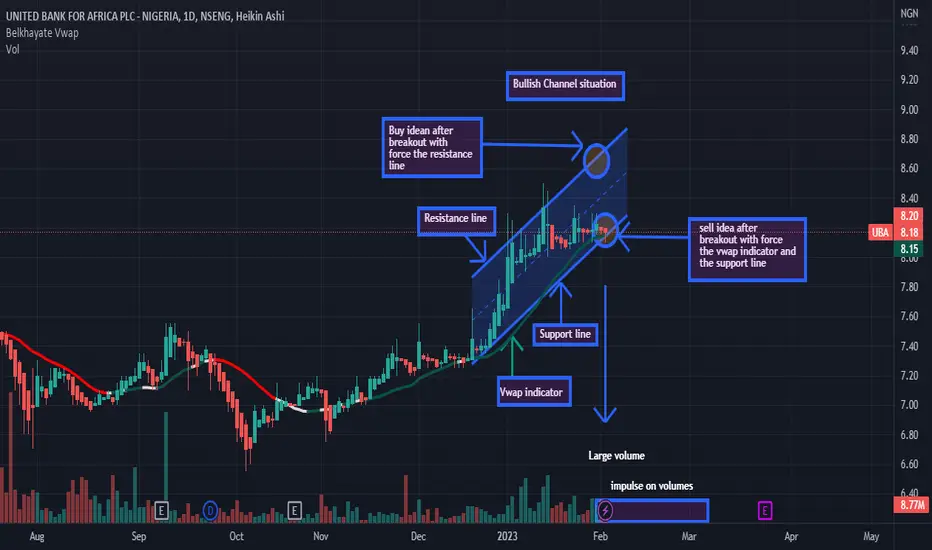
UBA: Analysis: Two situationsWe are in a one-day bullish channel situation here. When you look on the chart, we are above our vwap indicator which has taken a green color. This means that the buyers are above the sellers. We could have a nice uptrend if and only if the resistance line is forcefully broken by a large green candle and accompanied by large green volume. Furthermore, it should be noted that the market is unpredictable. So let's be careful and vigilant. Indeed, the market can also go down, however, if the vwap indicator as well as the support line are forcefully broken by a large red candle and accompanied by a large red volume. Thanks!
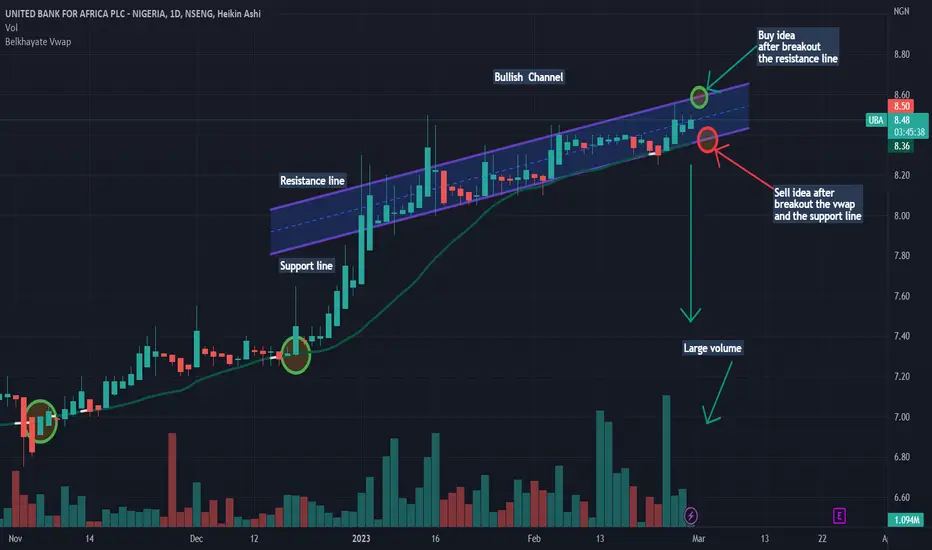
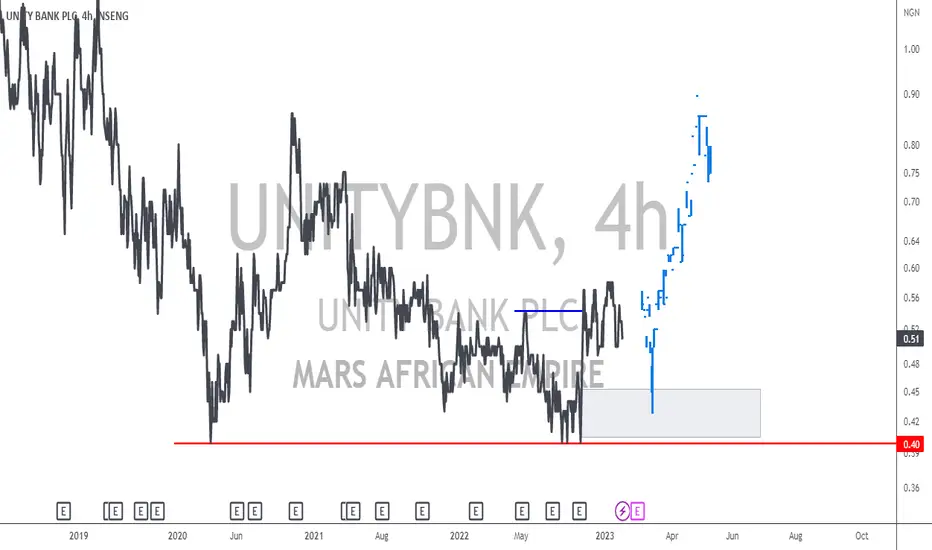
Analysis: two situationsAs you see on the chart we have two situations. We will have a big probability of an uptrend if we have the breakout with force the resistance line by a big green candle with a large green volume. In other hand, we could have also a big probability of a downtrend if we have the breakout with force the vwap indicator and the support line by a big red candle with a large red volume. Thanks.!
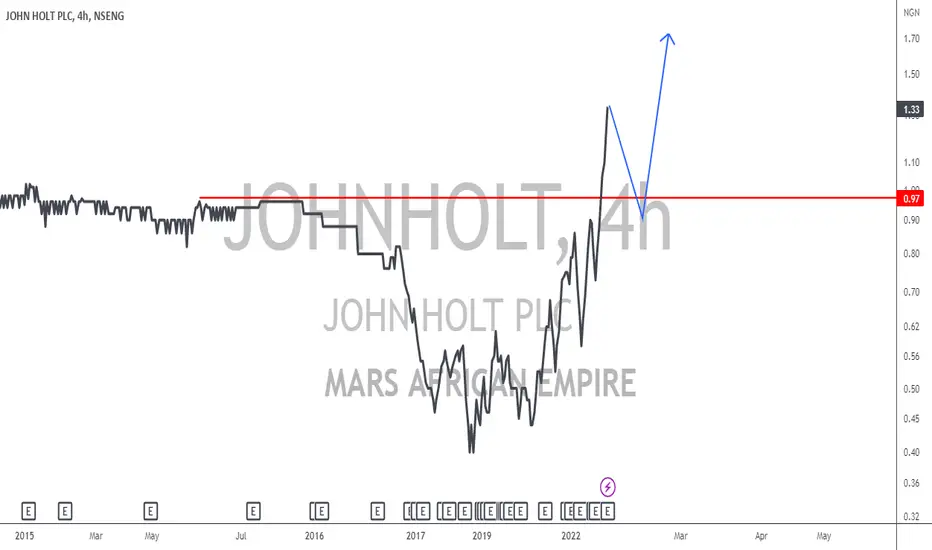
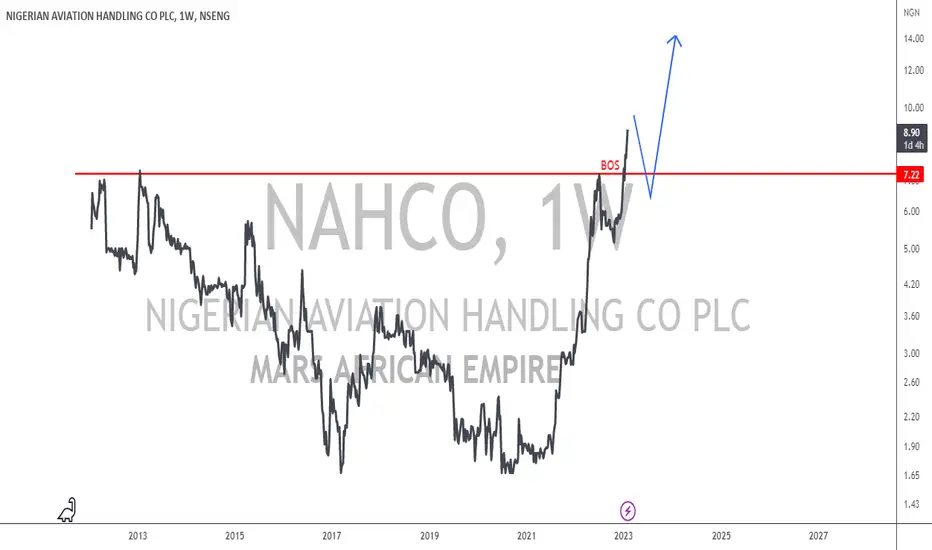
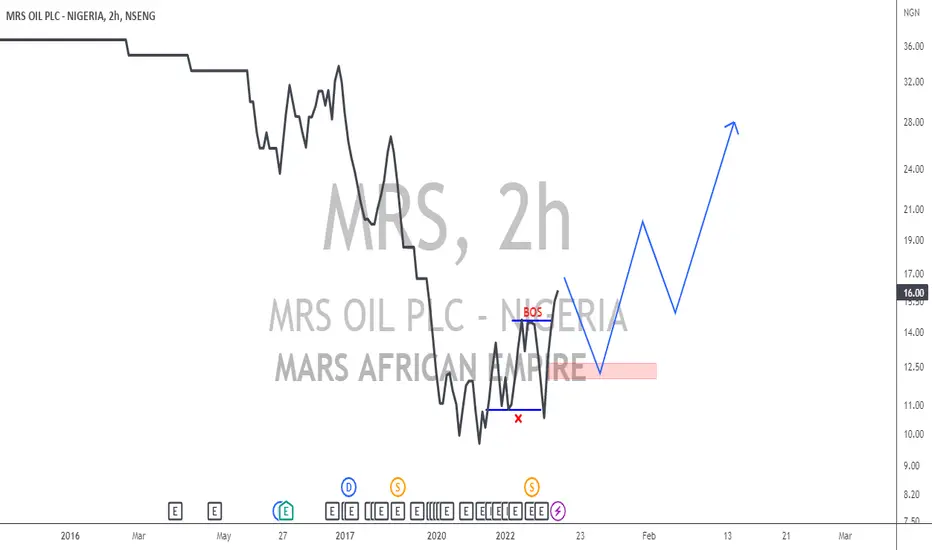
heading for 14.00we just witnessed the handlers breaking the all time highs, this gave us a nice BOS which we believe we just need to go down to mitigate a block below before we then shoot to at least hit 14.00
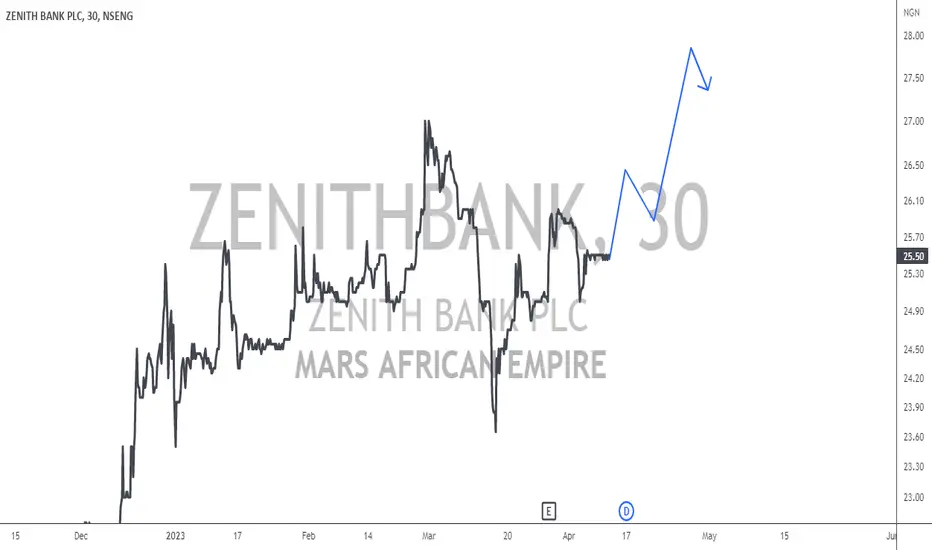
uptrendIt seems like Mrs Oils will soon be trading at 28 where she traded for sometime, we can see a change of direction taking place and now we will be rolling on an uptrend
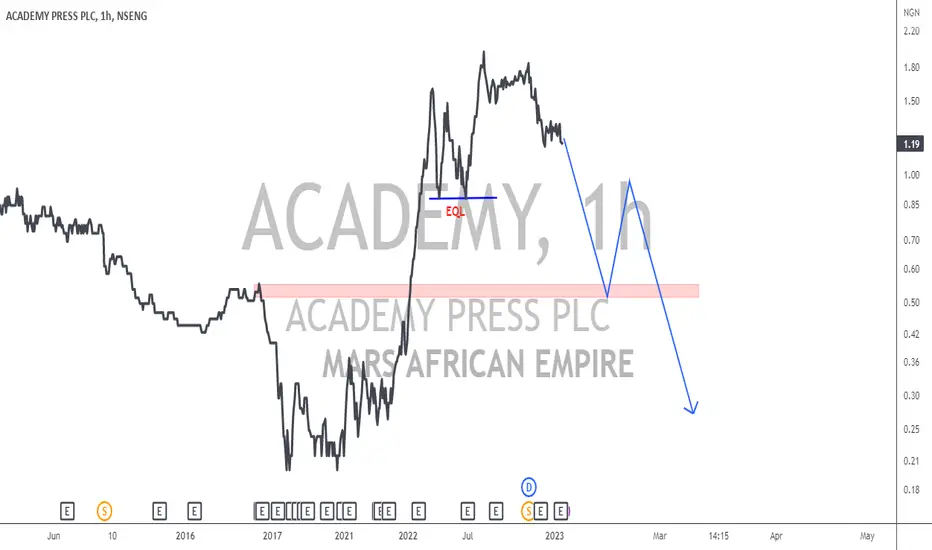
Down TrendIt seems like this guys might start declining on a downtrend, we can see equal lows below which we believe will be broken
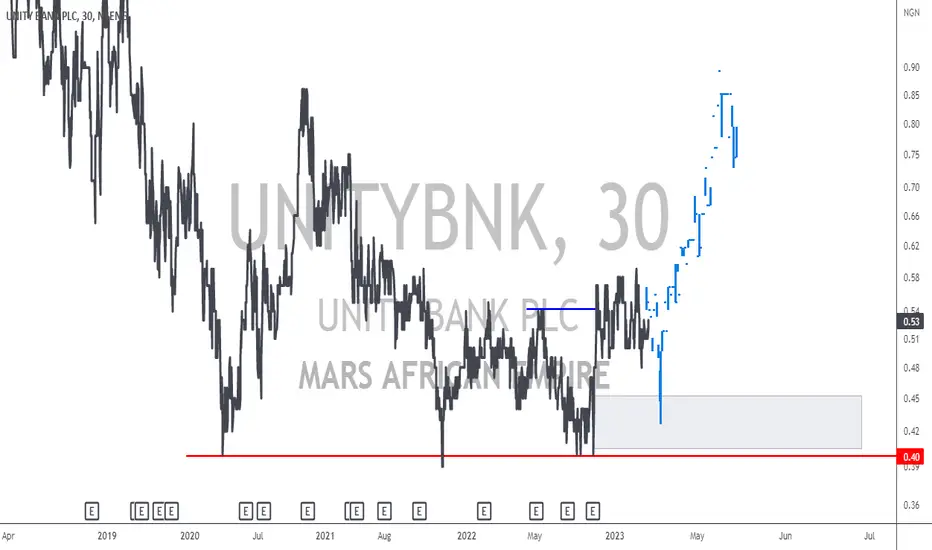
Might resetEver since this guys got listed, they lost so much weight we now believe they will gain back at they form a nice reversal