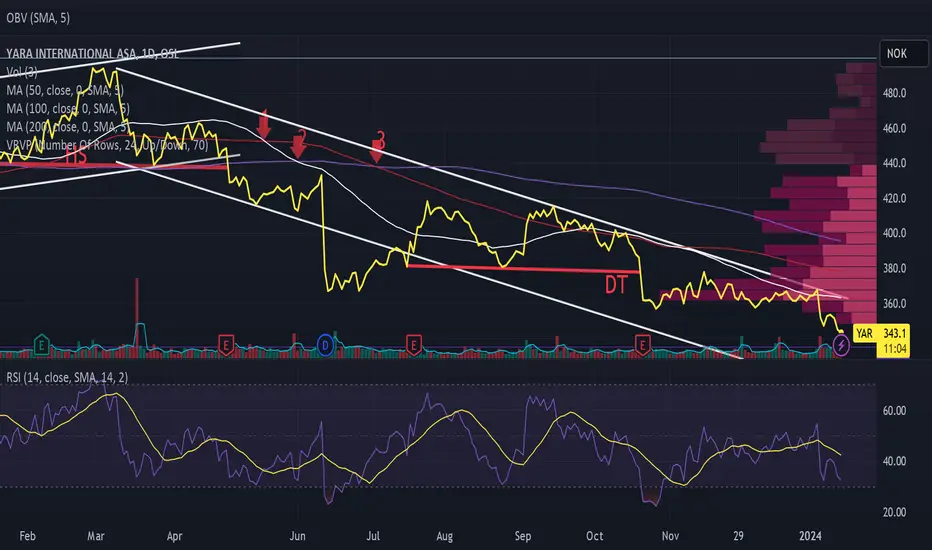
Yara is in a declining trend The analysis here may be irrelevant if you are long.
Yara is in a declining trend – price < SMA50 < SMA100 < SMA200.
Double peak (DT) from around July 17 to October 19, 2023, where the object has been taken out.
Support, when looking back in time on the 5 year chart, around 335 and 310.
Oversold January 5-8 and from January 12, 2024 at RSI 7, but not RSI 14.
Oversold in the same periods at Williams%R 14.
Price momentum indicators overall on sell.
There is no good correlation between price and volume.
The stock is technically negative over the medium term — one to 6 months.
The sum of short positions is 0.00%. On 28.11.23 there was a position of 0.5% one day and from 3 to 5 July -23 a position of 0.5%. That doesn't suggest that those who shorter think there's much to be gained.
The price is in down trend as the last 3 quarters have been disappointing. Fundamental analysts are, on average, neutral on the stock. Refers to Trading View and Yahoo Finance.
NB: Remember you must do your own research and assessment before buying and selling.
NB: I have a position in Yara. I have an unrealized price loss on the stock, but it's only about half of my dividend on the stock. Consider down selling or stop loss to reduce the risk of loss.
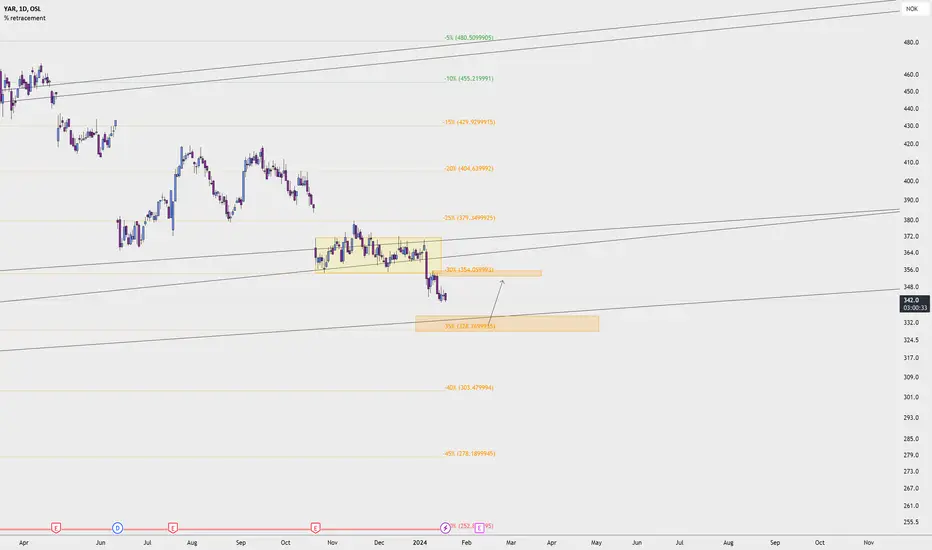
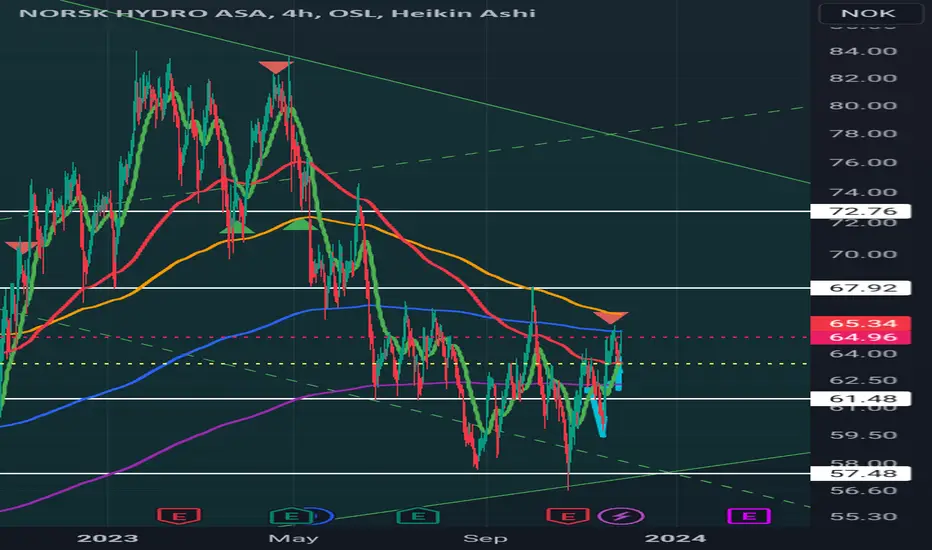
YAR: Potential Buy AreaKey level combined with long term trend line. First target at 352 NOK. BEWARE OF THE COMING EARNINGS. The earnings always pose a surprise risk.
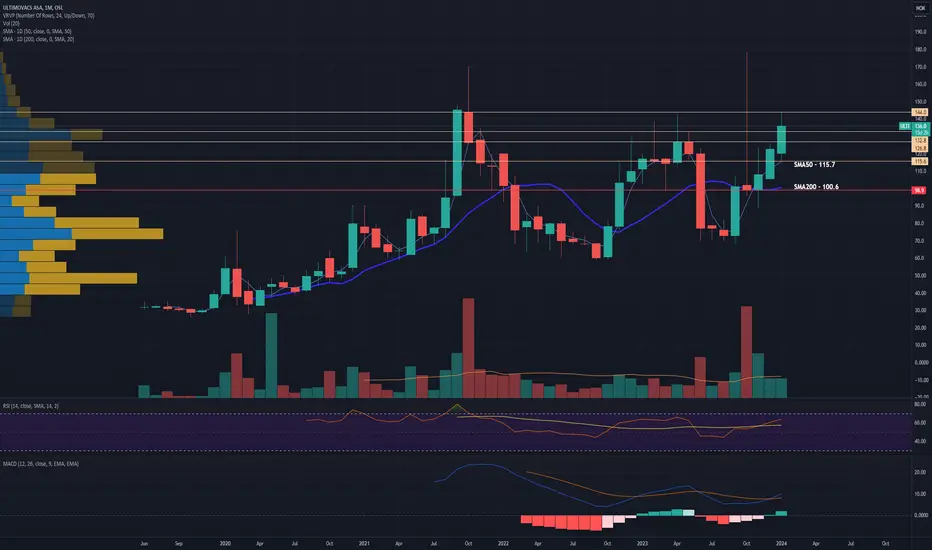
Ultimovacs finalize topline data for ph2 cancer vaccine trialUltimovacs is a norwegian clinical phase biotech with a universal cancer vaccine as its lead product.
Today the company reported to the market that in march it will share topline data from its randomized phase 2 trial INITIUM for its lead product UV1 , a universal cancer vaccine to be used in combination with checkpoint inhibitors.
The stock is at the moment testing the last major resistance level at around NOK 140, before the way is open to a retest of ATH.
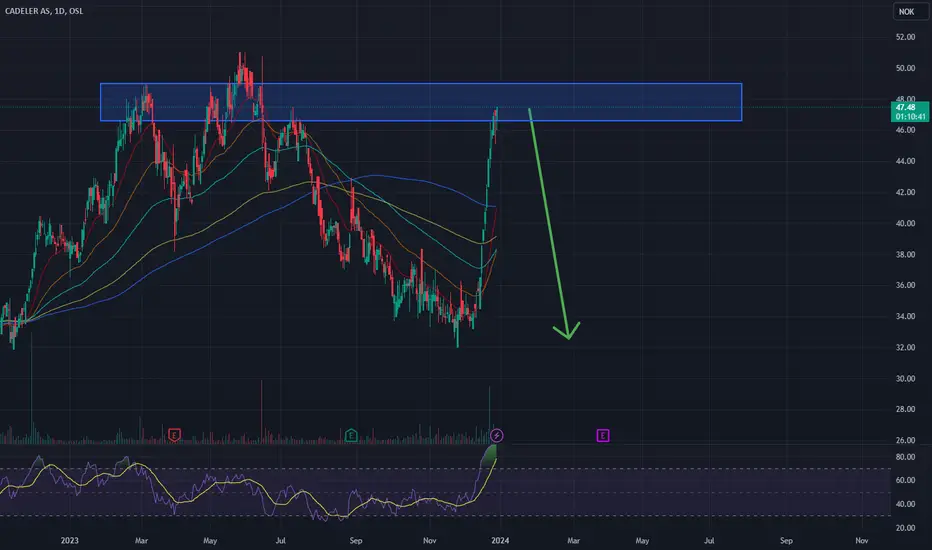
Careful with Cadeler, Possible fadeCareful with trading cadeler. May be taken right back to where it came from.
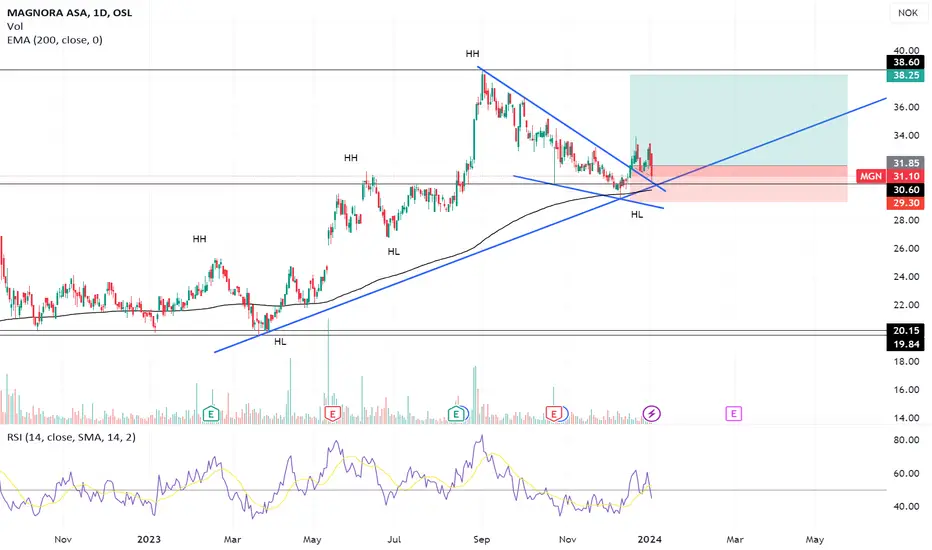
Falling wedge patternMagnora ASA is a Norwegian company operating in the field of renewable energy and sustainability. They specialize in the development, investment, and operation of projects related to wind power, solar energy, and other renewable forms of energy.
The stock is currently in an upward trend, characterized by the establishment of Higher Highs (HH) and Higher Lows (HL). Recently, it broke through a falling wedge pattern, indicating a continuation of the trend.
I have taken a long position with a Risk-Reward Ratio of 2.5. The stop-loss is placed just below the trendline, while the price target is set at the resistance level to optimize the profit.
I plan to provide an update in the comments section once the stock price reaches either the price target or the stop-loss.
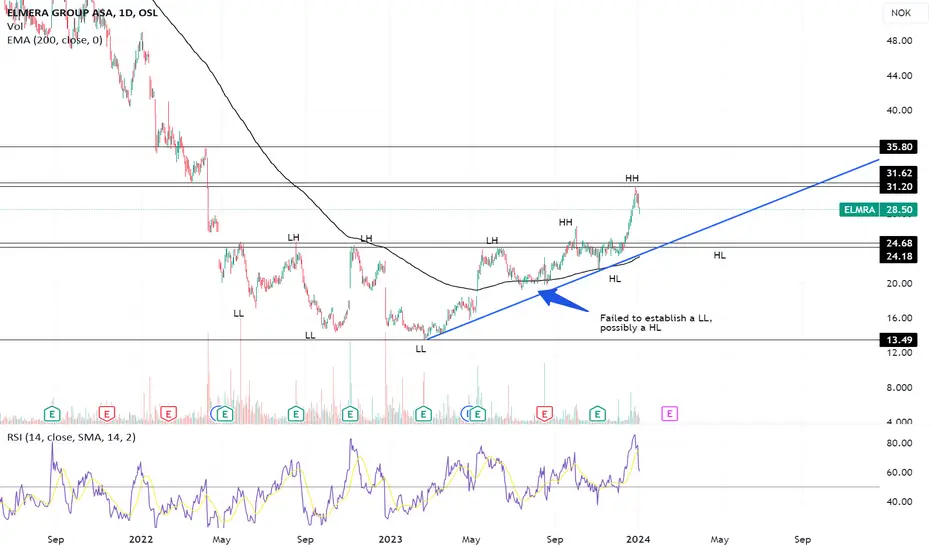
Elmera Group ASA has broken through a significant resistance levElmera Group ASA, a Norwegian electricity supplier catering to both private and public residences and buildings, has experienced a downward trend from September 2020 to September 2023, characterized by consistently Lower Lows (LL) and Lower Highs (LH).
However, over the past five months, from May 2023 to September 2023, the stock has entered a sideways trend, and recently, it has broken through a significant resistance level at 24–25 Norwegian kroner. This market shift has led the stock to transition from establishing Lower Lows (LL) and Lower Highs (LH) to forming Higher Highs (HH) and Higher Lows (HL), indicating a clear change in the dynamics between bears and bulls.
Considering this shift in the market, a retracement to the former resistance level at 24–25 kroner, now functioning as support, could occur. This might provide a possible entry point for individuals interested in taking a long position.
Emphasizing the importance of considering both technical and fundamental factors, it is recommended to conduct thorough assessments, analyze trends, as well as support and resistance levels. Additionally, staying attentive to any news or events that may impact price movements is crucial. Do not overlook the necessity of a clear risk management plan and a thoughtful evaluation of portfolio diversification.
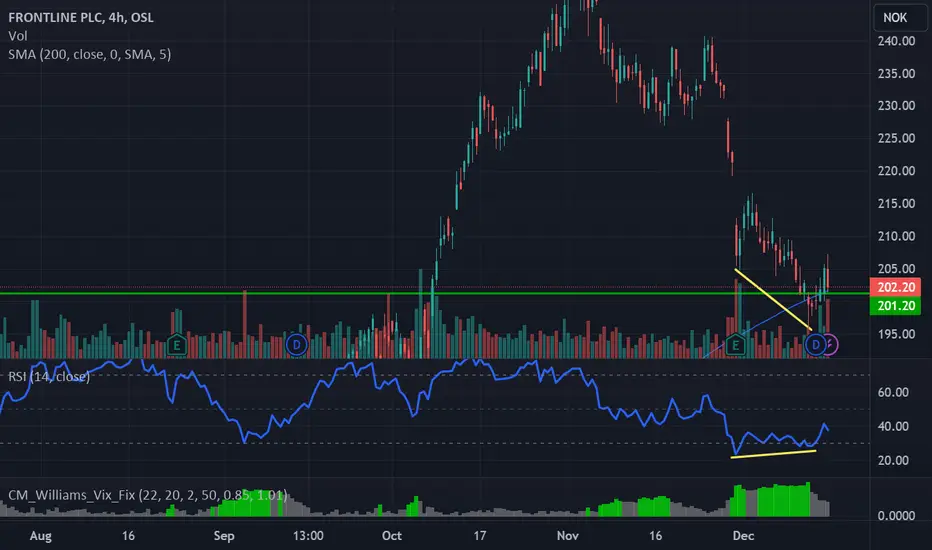
FRONTLINE PLC Long - Dollar Cost AverageThis is an analysis of Frontline PLC - a Norwegian oil transportation company, the following is strictly my own personal opinion and does not constitute financial advice.
Key numbers:
Dividend yield expected 2024 - 17%
P/B - 2.03
P/E - 5.41
Market cap 47 178 MNOK (4.5 BUSD)
Analyst estimates:
Analyst estimate average for FRO is 267.5 NOK which is equivalent to a 32.3% increase from todays price.
Key information:
FRO has had a significant increase in price the past 6 months, and analysts estimate an increase in both dividends and growth for the company in the coming years.
Technical analysis:
FRO made a bullish divergence on the 195-200 support level recently, after a significant sell off the past few weeks the stock did not even drop as a result of dividends being paid out to stock holders, and I see this as a sign of the stock being about to reverse the downwards trend and begin to move back towards my price target of 260-280.
Strategy:
I am currently in possession of FRO shares with a GAV of 150 NOK/Share as well as increasing my position on friday for 200 NOK/Share. I am looking to hold these shares until price reaches 260-300 NOK/Share depending on coming events. If the price keeps moving down, I will look to hold my position until the stock reaches my price target regardless, as the dividend payout is significant. This might change if significantly bearish news arise, but I do not see that as a high probability at this moment.
If price reaches my profit target, I will again look at analyst estimates and given there is no change I will exit my position for a significant gain. If analyst estimates increase I will either close part of my position or hold it until bearish divergence on the 4H timeframes.
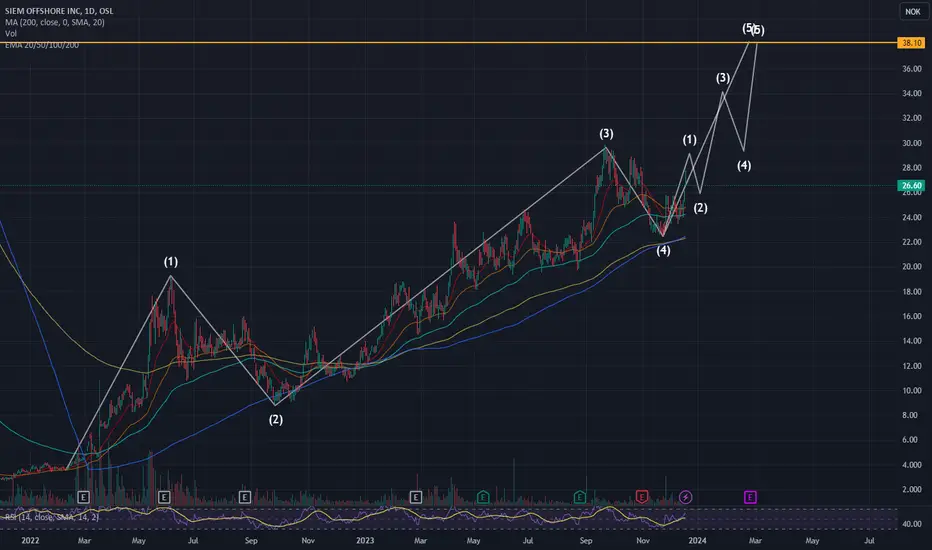
SIEM OFFSHORE ELLIOTT WAVE ANALYSISSIEM OFFSHORE ELLIOTT WAVE ANALYSIS. Based on wave 1 we should now see wave 5 target around 38 area.
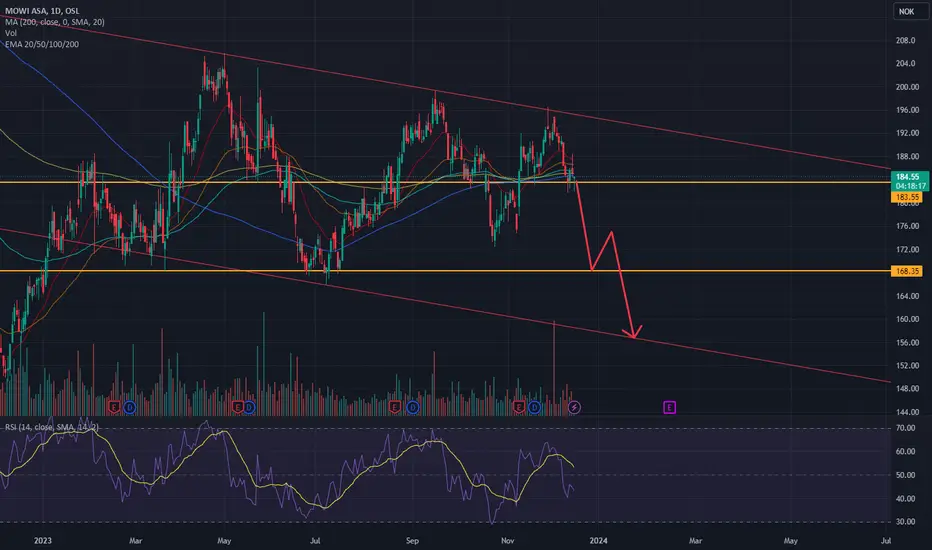
MOWI PredictionMOWI seems to be in a downtrend, if support level breaks, we may see a fall to the bottom of the channel with a stop at next support level.
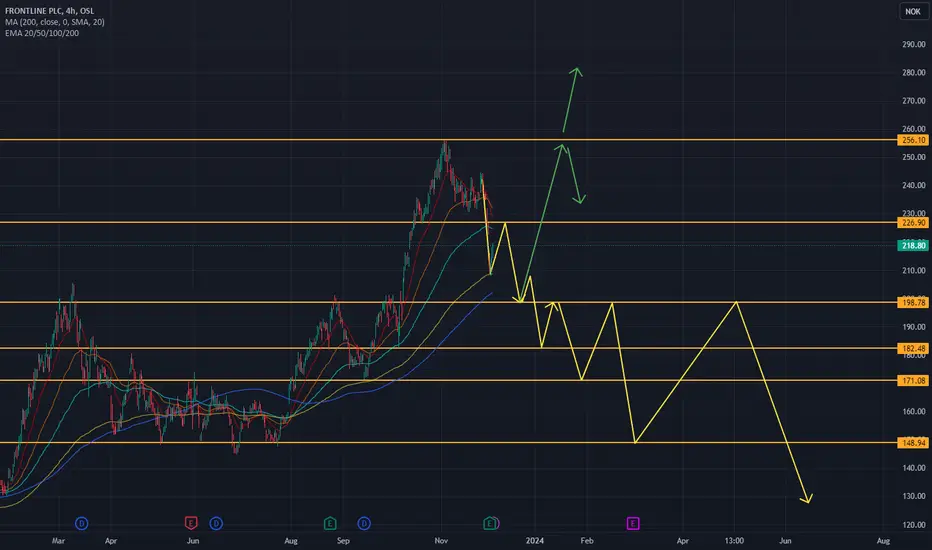
FRO S and R + Possible moves. Possible move prediction for FRO. Maybe top is in, maybe not?
Possible moves in support and resistance zones
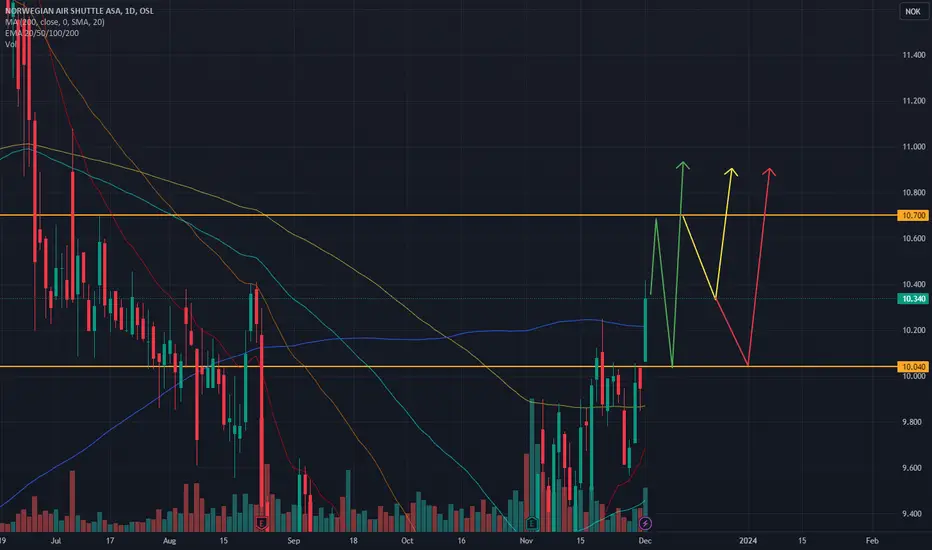
NAS Support and ResistanceNAS support and resistance possibility.
Resistance at 10,7. May be optimistic about break to upside, as support may not hold when coming down.
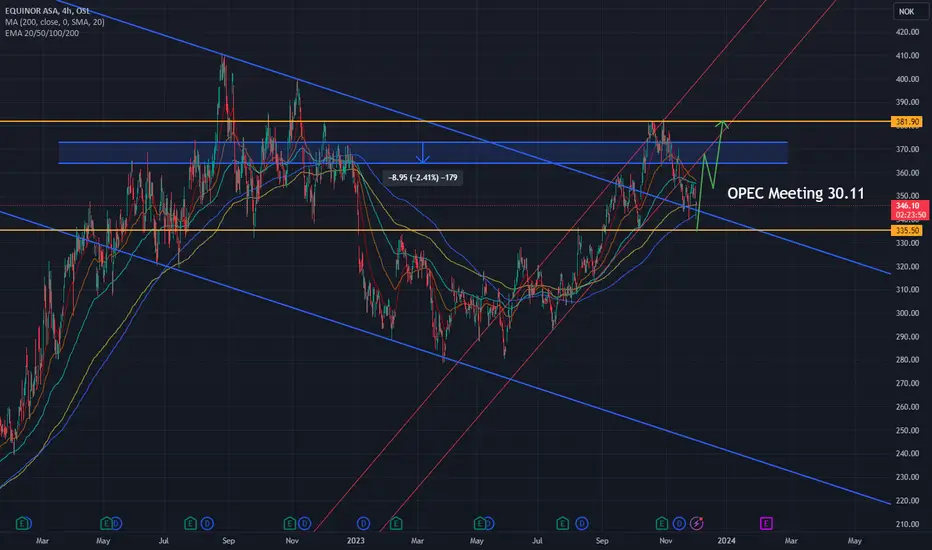
EQNR BounceOPEC meeting can be the trigger for this bounce if oil prices move higher, can even see new ATH if it breaks resistance.
Trade carefully.
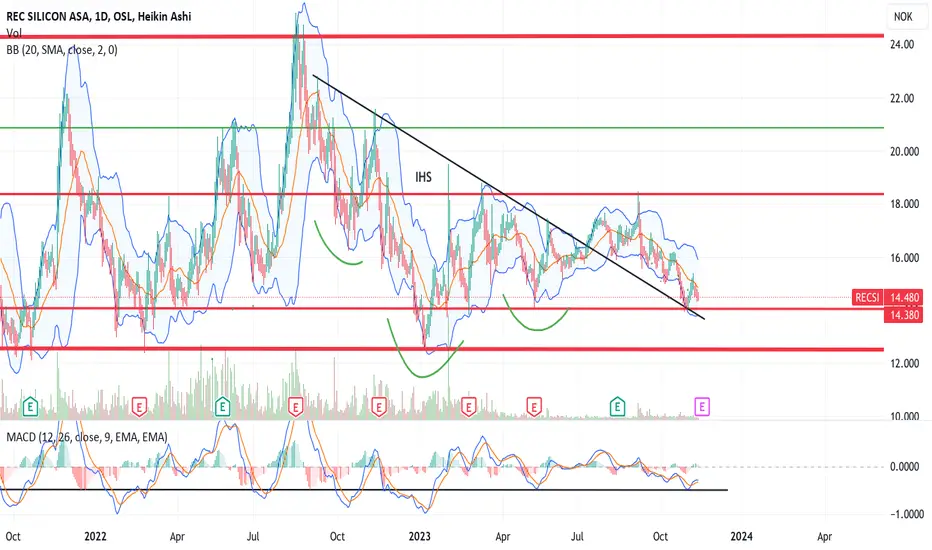
IHS confirmed , next BIG short squeeze?Long and strong IHS confirmation breakout and tested
Fundamentals:
Company fully funded and largest factory in Moses Lake has started production with recent contract signed for the next 10 years worth around 3 busd. Todays mcap is around 0.6 busd.
Guided ebidta for 2025 is 100-300 musd
Dept around 260 musd with favorable terms
Production within 3 megatrends in the U.S, semi chips, solar and batteries (silane gas)
All production sold out, but silicon anodes manufacturers ( Sila Nano, G14, Oned) has established around their Moses Lake facility in hopes for silane offtake.
Amprius and Cenate has mentioned and hopes for REC silicon silane gas, and company itself says they have discussions with multiple companies regarding silane.
REC has 70% markets share of silane gas, and it looks that replacing grafite with silicon will be the next big thing. The potential for REC silicon and its silane gas are endless the next 5 years as this explodes.
REC also has a 15% stake in Yulin factory in China, and are in proccess of selling this stake, which is valued to 150 musd. 1/4 of todays mcap just in cash!!
Proccess is going slow but we are close to an end...
This stock is worth following the next year!!
Also to mention is that due to restart and impairments, Moses Lake factory(replacement cost 1.7 busd) is zero in the books. Yulin has also been written down to zero... and revarsal of impairments would most likely be reversed next quarter, Yulin is a huge bonus with cash, and company has also recievd a large amount of pre payments in the 3 busd contract recently signed.
Today REC silicon is one of the most shorted stocks in Oslo stock exchange, but there is a huge chance of a potential short squeeze here when market discovers fully what is about to happen here....
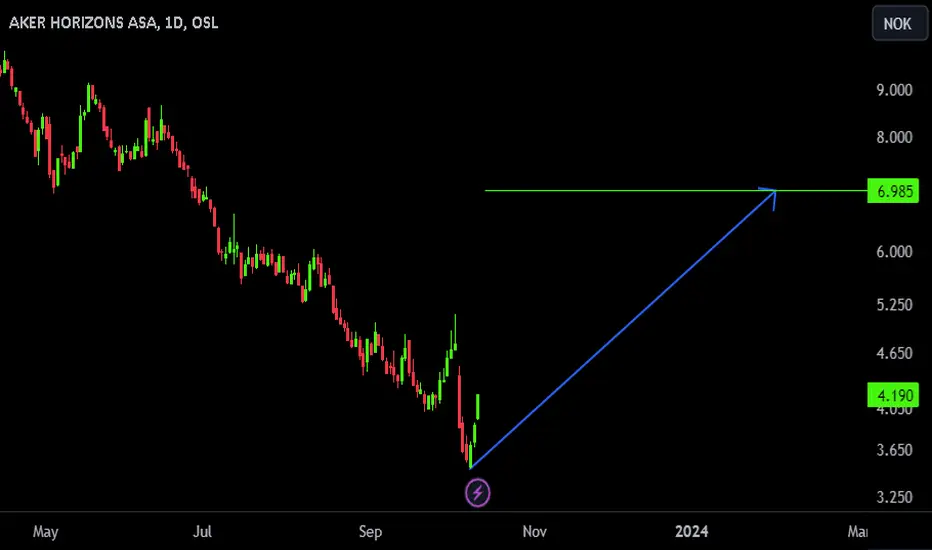
AKER HORIZONS ASA Targets 7 NOK End of January 2024The stock ended the decline wave after its listing on the financial market in February 2021, and it recorded 55 NOK
It reached its lowest price on October 9, 2023 at 3,480 NOK
According to EKMAREI's theory
The stock has begun a long-term upward wave
The arrow points will be updated in the future for followers
DNB HTF SHORTIn my opinion - DNB is about to give back most of its gains from its IPO. This high might be its cycle high, I think we have a pretty good chance to lose 60-80% of its current market cap within the next 12-18 months. I do think we can see the price go to somewhere between 50-70 nok. I'll most likely track this going forward. The next support in the small time frame picture should be about 186. If we see new highs here on DNB, I think it will be swiftly. There is major signs that we are about to put in a significant cycle high up here.

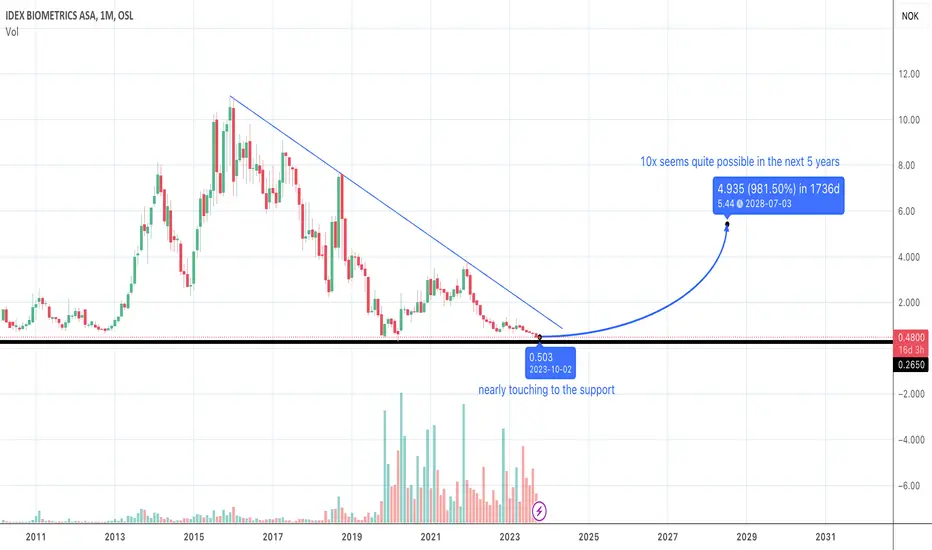
IDEX Biometrics - very good opportunity to enteridex shows good news in collaborations and technical development. it hit down to the support line at the same time. I believe it is best time to enter for long term 5 years investment
Tomra Systems: A Prime EU Expansion Play with 150% Growth PotentTomra Systems is an exceptional company poised for significant growth as they expand into the EU. I've been accumulating shares steadily each month, aiming for a target price of 76 NOK. The monthly RSI is soon approaching 30, and the Stochastic indicator is already at its low point. Furthermore, the stock is below its 618 Fibonacci retracement level, and the 200-day EMA is about to intersect. This presents a phenomenal buying opportunity. While it may seem like a long-term, less exciting investment, a potential 150% increase over the next three years makes it a promising choice.

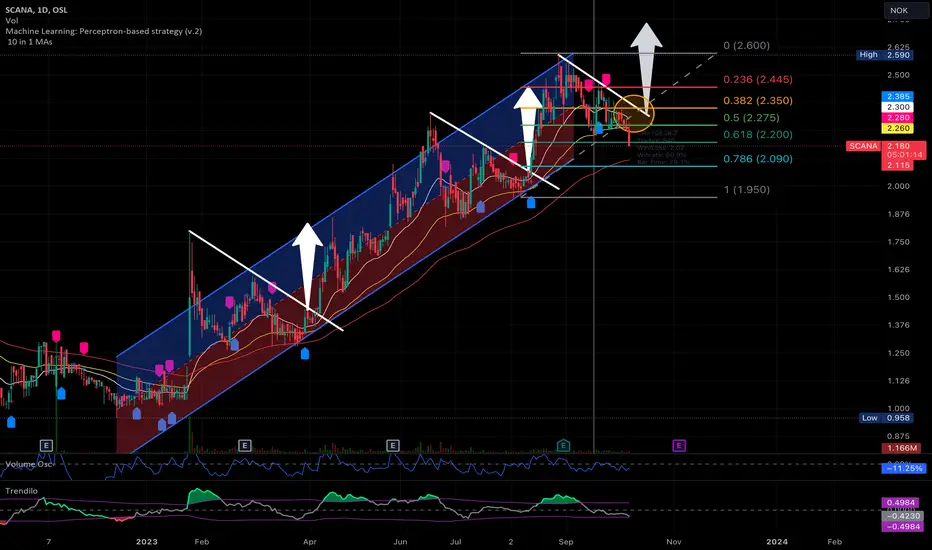
Uptrend Pullback Trafing strategy (Scana)Pullbacks are an expected feature of any long-term uptrend.
A pullback is a momentary price reversal or correction that occurs within the context of the current trend. It is a brief retracement against the dominating trend before the price returns to its original direction.
Technical analysis tools such as trend lines, moving averages, and Fibonacci retracement levels can be used to identify pullbacks.
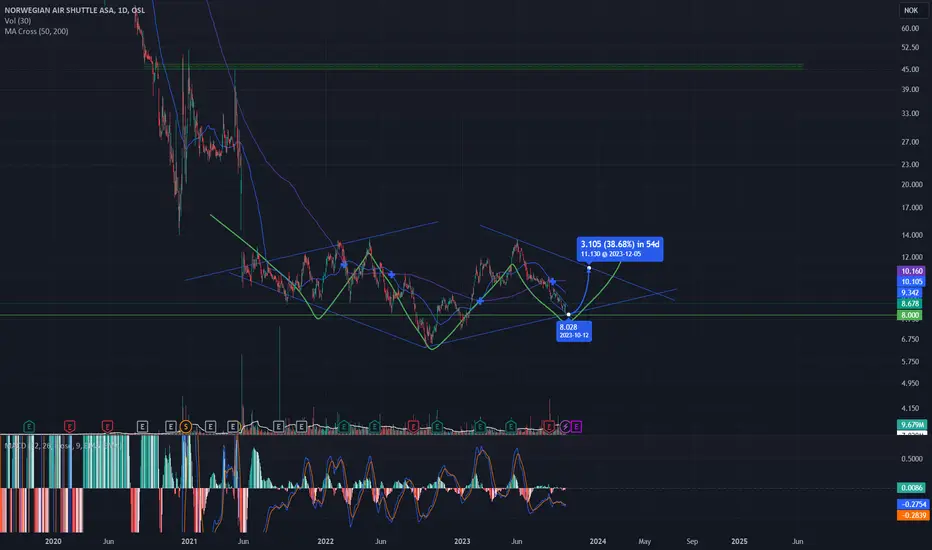
Diamond Pattern in Norwegian Air (NOK) Around 8 NOK supportHello TradingView Community,
I have news regarding a potential trading opportunity that has caught my attention, and I believe it's worth discussing and analyzing together.
Recently, I've observed what appears to be a developing Diamond pattern in Norwegian Air (NAS).
Notable Level 8 kroner (NOK) - Acting as a strong support
The current price action above 8 NOK has shown remarkable support, contributing to the formation of the lower part of the Diamond pattern. Given the volatility in NOK's recent performance, it's crucial to keep a close eye on this development.
Thank you for your time and contributions to our trading community. I look forward to engaging in a productive discussion regarding this opportunity.
Warm regards,
Diamond hunter
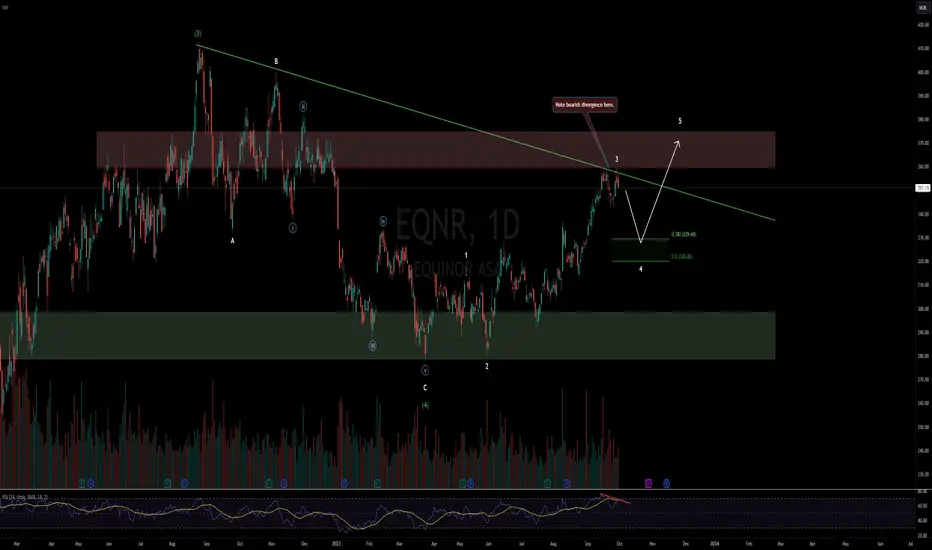
EQNR Chart UpdateEQNR Daily Chart
___
Looks like larger corrective W4 is in. Seeing some bearish divergence on the smaller degree, and could expect a pullback/rejection from upper TL..
Hope this helps!
KOG weak resistanceA lot of buyers seems to be interested in this key level. KOG have been returning to this resistance multiple times after breaking the structure downwards. Which means that there is more shorts stepping into the market but the buyers hold the demand in the market. When buying pressure have this control while the shorts cant push the price down, indicate that this resistance is getting weaker and is about to break.
