PSX- LONG TRADE13/4/25
TF 1D
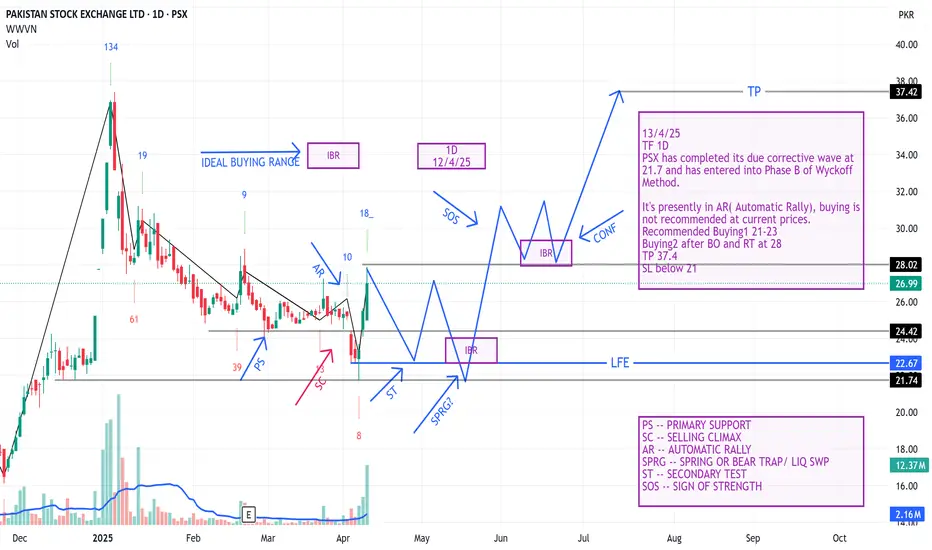
PSX has completed its due corrective wave at 21.7 and has entered into Phase B of Wyckoff Method.
It's presently in AR( Automatic Rally), buying is not recommended at current prices.
Recommended Buying1 21-23
Buying2 after BO and RT at 28
TP 37.4
SL below 21
HUBC ANALYSIS- LONG TRADEHUBC has successfully tested its 1D trendline, it's continuing its bullish momentum.
Buying Range 136-142
TP1 147
TP2 157
LONG TERM TP 164
SL BELOW 130

AVANCEON PSX (Daily Time Frame) Technical Analysis – AVANCEON LTD (PSX, Daily Chart)
Pattern: Inverse Head and Shoulders
Divergence: Bullish
Analyst: Musarrat Karamat | Date: 13-06-2025
AVANCEON Ltd (listed on PSX) is currently forming a classic Inverse Head and Shoulders pattern, which is a strong bullish reversal setup. The neckline breakout has been identified near the ₨53.97 level, which is the Buy Stop trigger for a long position.
Buy Stop: ₨53.97 – A breakout above this level would confirm the reversal and signal bullish entry.
Stop Loss: ₨47.12 – Placed below the right shoulder, providing a safe risk buffer in case of a failed breakout.
Target 1 (TP1): ₨60.57 – The first target is derived from the neckline-to-head distance projected upward.
Target 2 (TP2): ₨66.35 – A more optimistic target if bullish momentum continues post-breakout.
The RSI (Relative Strength Index) below the chart shows a bullish divergence, which further supports the reversal thesis. The RSI broke out of a downtrend with increasing momentum, hinting that institutional buying may be underway.
The price is currently trading around ₨50.05, indicating that the breakout hasn’t occurred yet. Traders should patiently wait for confirmation above the buy stop level before entering the trade.
Conclusion:
The setup reflects a textbook inverse head and shoulders with bullish divergence confirmation. If the neckline is broken decisively with strong volume, the stock may rally toward ₨60.57 and ₨66.35. However, prudent risk management is crucial, with a stop loss at ₨47.12 to limit downside exposure.

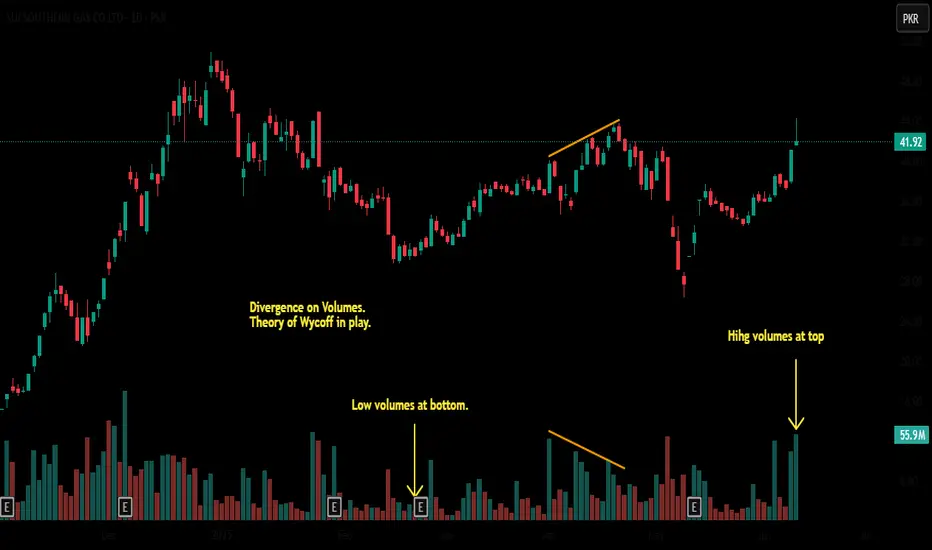
SSGC | Wycoff In PlayTheory of Wycoff has been observed in the Sui Southern Company chart.High volumes have been generated on top which can be described as distribution phase.And low volumes have been observed at bottom which can be termed as accumulation phase.
BIPL | Next Top Forecast | Fib RetracementBank Islami Pakistan has printed top and is ecpected to stay bullish since there is no divergence on RSI as well as Volumes.Fib retracement has indicated us the probable next new top.

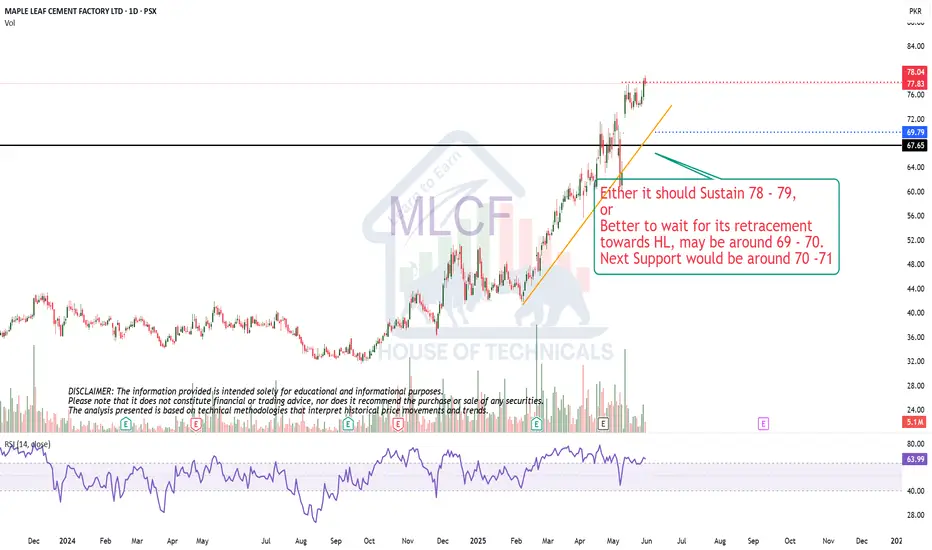
HH Printed on Bigger TfEither it should Sustain 78 - 79,
or
Better to wait for its retracement
towards HL, may be around 69 - 70.
Next Support would be around 70 -71
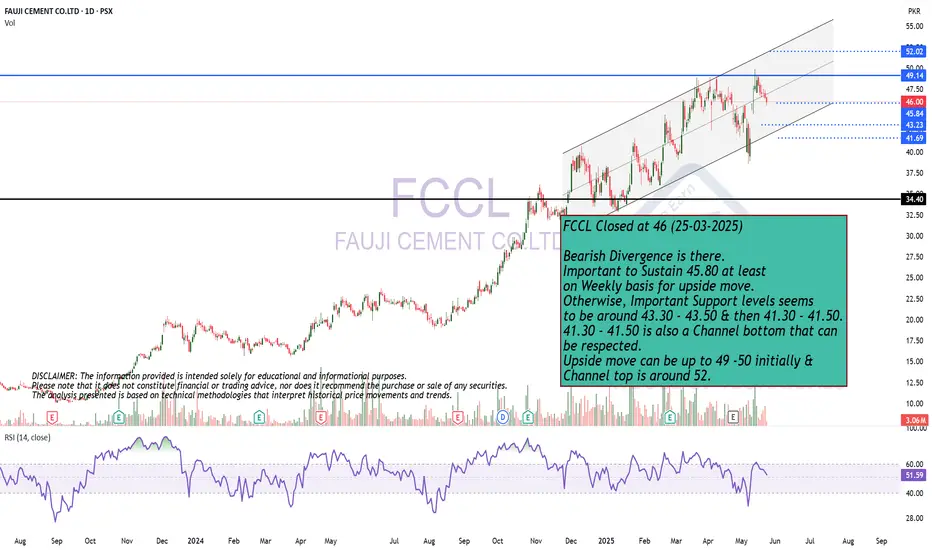
Make it Break it Situation!FCCL Closed at 46 (25-03-2025)
Bearish Divergence is there.
Important to Sustain 45.80 at least
on Weekly basis for upside move.
Otherwise, Important Support levels seems
to be around 43.30 - 43.50 & then 41.30 - 41.50.
41.30 - 41.50 is also a Channel bottom that can
be respected.
Upside move can be up to 49 -50 initially &
Channel top is around 52.
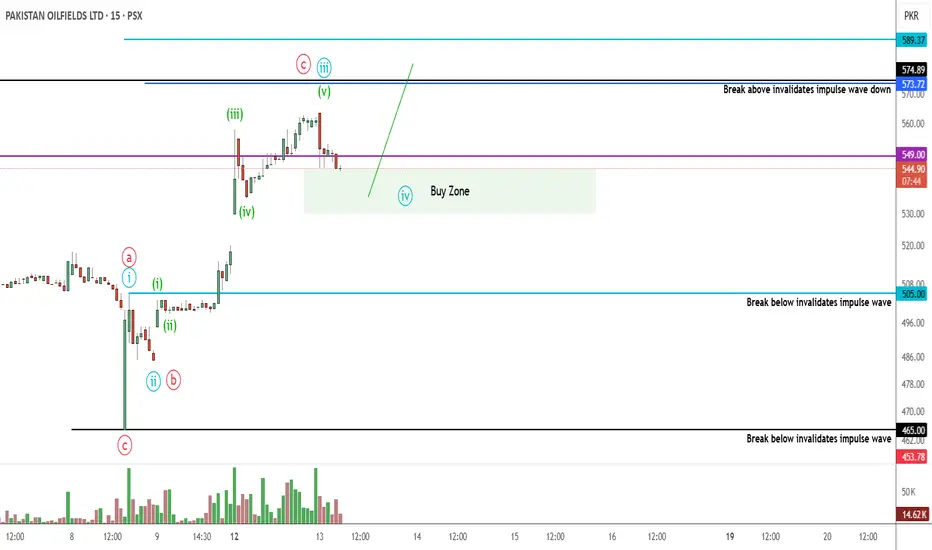
POL PROBABLY IN WAVE '' A '' OR " B " - LONGThis is in continuation of our ongoing tracking of POL wave structure.
Prices went below our buying zone of 475 touching 465, taking a cautious approach as the overall market was down, we did not buy at 475-465 area and waited for a bounce up for confirmation. Now the bounce has been significant and if our wave count is correct then we are most probably in wave 4 of an impulse wave of A or B.
This trade setup remains valid until 505 is taken out.
Trade setup:
Entry price: 545 - 530
Stop loss: 504
Targets: 575 - 590
Let see how this plays, Good Luck!
Disclaimer: The information presented in this wave analysis is intended solely for educational and informational purposes. It does not constitute financial or trading advice, nor should it be interpreted as a recommendation to buy or sell any securities.
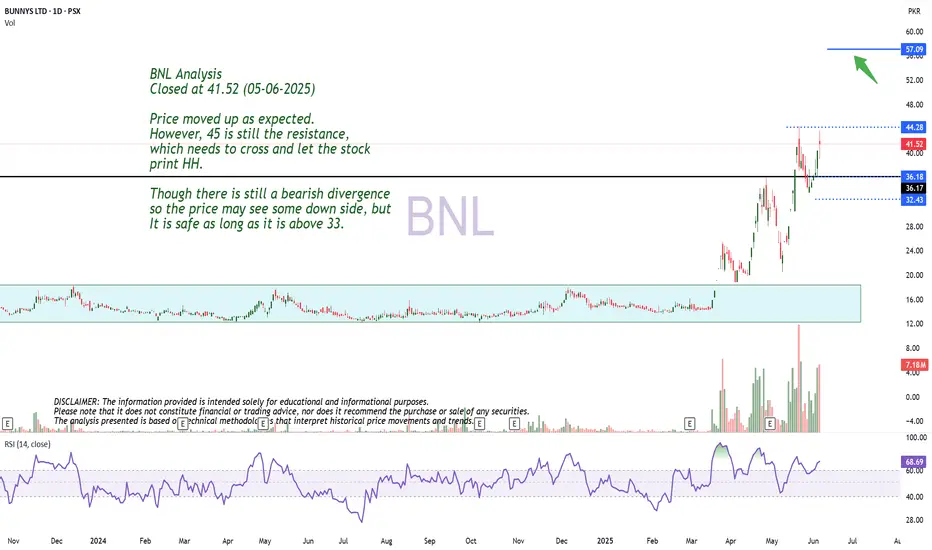
Price moved up as expected.
Closed at 41.52 (05-06-2025)
Price moved up as expected.
However, 45 is still the resistance,
which needs to cross and let the stock
print HH.
Though there is still a bearish divergence
so the price may see some down side, but
It is safe as long as it is above 33.
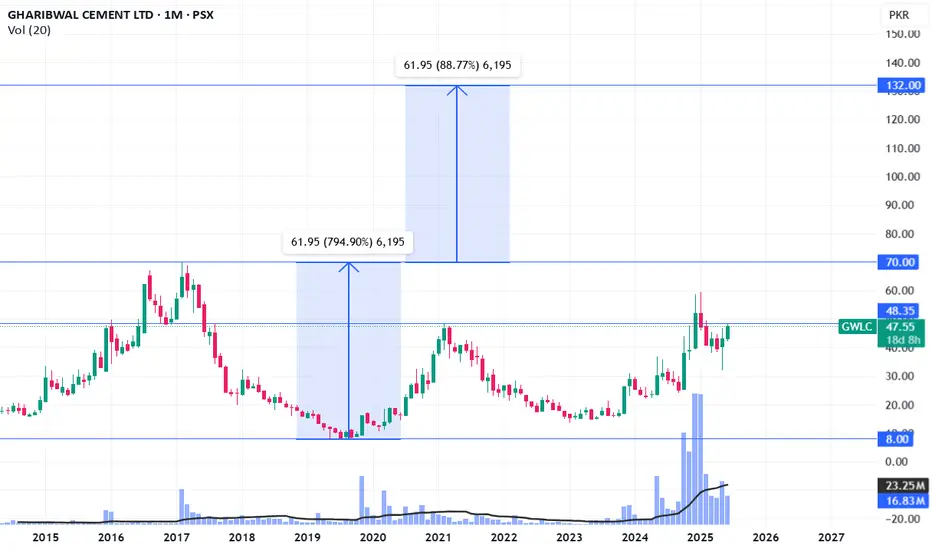
GWLC - About to have a breakoutGWLC tried to break its previous high but failed last time. Its again retesting it and hopefully will give breakout this time (48.35).
Then it may go to retest its all-time high (70). Ultimate target can be 132.
This is not a buy/sell call, just my own opinion.
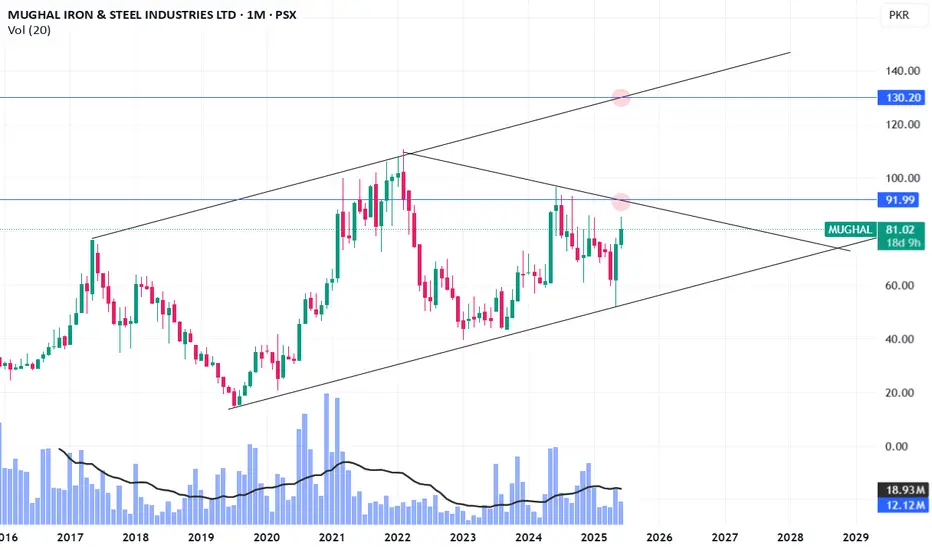
MUGHAL - Following its ChannelBreakout may happen at 92 and we may see Mughal touching 130 (Channel top) once again. What happens if it breaks Channel top resistance this time? We'll see later :)
This is not a buy / sell call, just my own opinion.
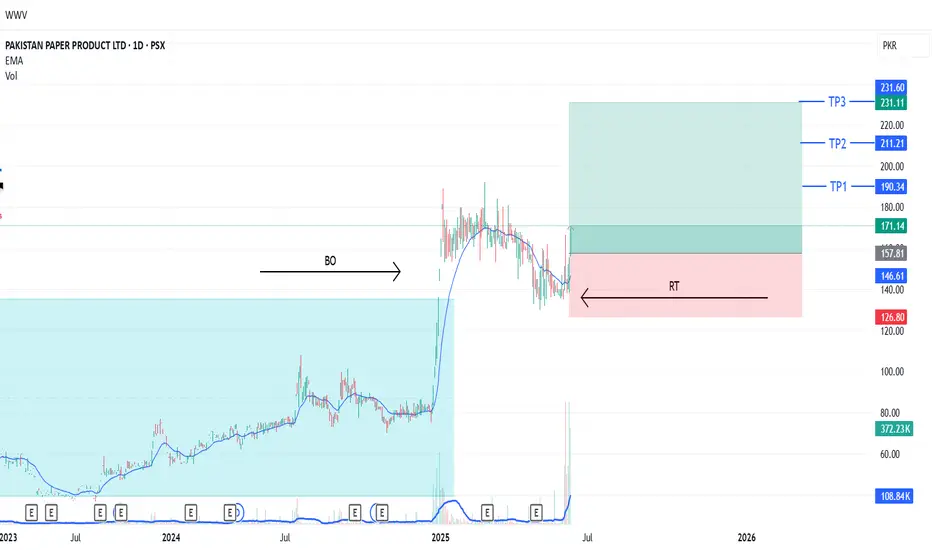
PPP LONG TRADE 11-06-2025PPP LONG TRADE
- *Historical Performance:* PPP started a gradual uptrend in 2013, followed by a spike-like upturn in April 2017, reaching 135. The stock then traded in a range between 35 and 137 until the start of this year.
- *Breakout and Pullback:* PPP broke out of this long-term trading range with strong volume distribution. After the breakout, the stock experienced a slow pullback, touching the breakout level and the major gap created by the breakout spike. Recently, it has shown reversal signs upwards.
- *Current Setup:* The stock is primed for an up move.
🚨 TECHNICAL BUY CALL – PPP🚨
- Buy levels:
- Current level: 170
- 162
- 155
- Targets:
- TP1: 190
- TP2: 210
- TP3: 231
- Stop Loss: Below 125
- Risk Reward Ratio: 2.4
Caution: Please buy in 3 parts in buying range. Close at least 50% position size at TP1 and then trail SL to avoid losing incurred profits in case of unforeseen market conditions.
PLEASE BOOST AND SHARE THE IDEA IF YOU FIND IT HELPFUL.
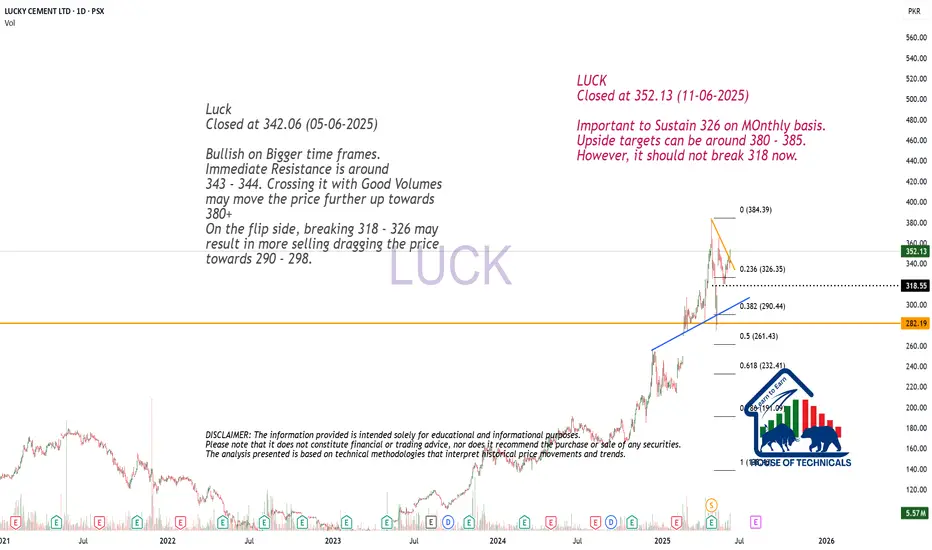
Important to Sustain 326 on MOnthly basis.LUCK
Closed at 352.13 (11-06-2025)
Important to Sustain 326 on MOnthly basis.
Upside targets can be around 380 - 385.
However, it should not break 318 now.
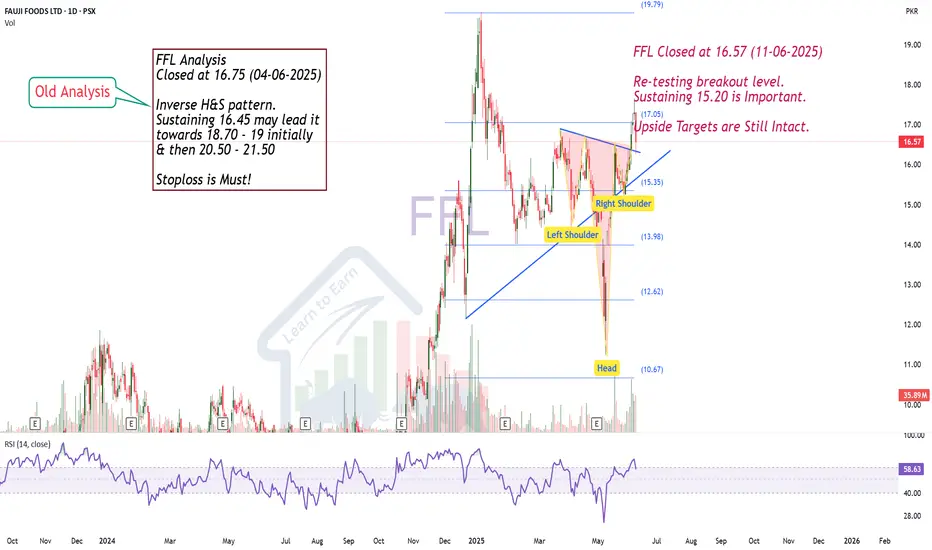
Re-testing breakout level.FFL Closed at 16.57 (11-06-2025)
Re-testing breakout level.
Sustaining 15.20 is Important.
Upside Targets are Still Intact.
GCIL | Swing Trade Setup!!!GCIL's current price action indicates a favorable technical setup.
Key observations include:
Uptrend indication: The stock price is trading above the 200-day EMA, suggesting an overall uptrend.
Fibonacci retracement: A fake breakout was observed on April 3rd, which coincided with a 61.8% retracement level from the low of 8.82 (October 4th, 2024) to the high of 23.50 (March 3rd, 2025). The stock has since appreciated by 9.10%.
MACD crossover: The MACD indicator is exhibiting a bullish crossover from its bottom, signaling a potential reversal and strengthening of the uptrend.
Trading Strategy
Based on the technical analysis, a long position can be considered at the support level of 16.16. To manage risk, a strict stop-loss is recommended at 14.40. Potential targets for the trade are:
Target 1: 17.89, representing a 10.71% upside
Target 2: 20, representing a 23.76% upside

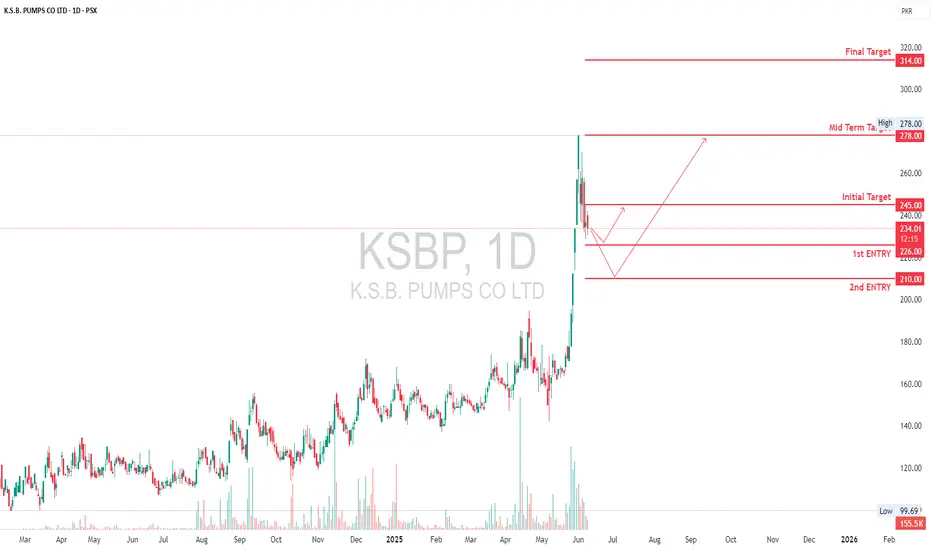
Trade Setup with Multi-Stage Target LevelsThe stock experienced a sharp upward movement, breaking out from a long consolidation phase and reaching a high near PKR 278. Currently, it has pulled back to PKR 235. The chart outlines a trading plan with multiple levels: the first entry point around PKR 226, and a second entry around PKR 210, indicating potential accumulation zones for traders. The initial target is set at PKR 245, the mid-term target at PKR 278, and the final target at PKR 314. The projected paths suggest two scenarios: either a bounce from current levels or a deeper pullback before resuming the uptrend. Volume spikes during the breakout phase suggest strong buying interest. Overall, the chart indicates a bullish outlook with clear risk management levels for potential entries and profit-taking.
FFL Next Buying Zone in Daily Chart FFL Next Buying Zone in Daily Chart
buying Zone 15.21 to 15.60.
This is for educational purpose. Do your own research for any financial investments.

BFBIO Analysis1- Price has been struggling to breakout previous HL since 22nd May
but went vain to date. Which show lack of interest from buyers.
2- Candles with upper wicks and RSI is taking resistance from 60
level on hourly is evident that price will retrace further.
3- Bearish divergence on daily confirming is also confirming the
retracement will proceed. The price may retrace in between
152~192 to form a right shoulder before and impulsive move or
else price need to break and retest the previous LH area to
confirm an impulsive move to start.
4- Keep monitoring for both above mentioned scenarios.

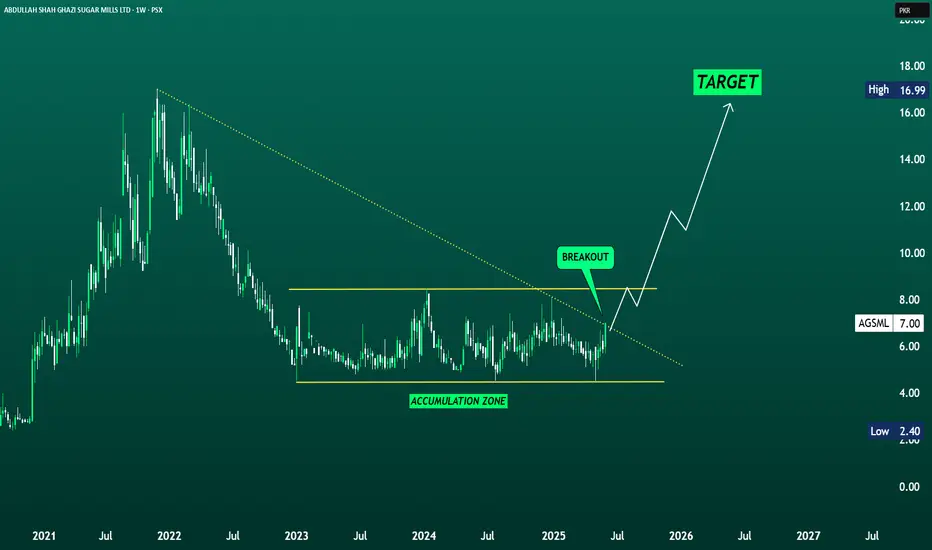
AGSML - BREAKOUT TARGETING 8.50 -11.00, FOLLOWED BY 13.50 - 16.5📈 AGSML (Abdullah Shah Ghazi Sugar Mills Ltd) – Technical Analysis
AGSML has confirmed a breakout from its long-term downtrend line after a prolonged accumulation phase around the PKR 4.5–6.5 range. The stock closed at PKR 7.00, gaining +18.64%, and is now positioned above key Fibonacci retracement levels — signaling a potential trend reversal.
With this breakout, immediate upside targets lie at PKR 8.49, followed by PKR 9.40–10.95 in the short to medium term. A strong move beyond these zones could extend the rally toward PKR 13.50–16.50, based on historical Fibonacci projections.
As long as the price holds above the 6.50–6.90 breakout zone, AGSML appears technically poised for a sustained upward move.
📌 Disclaimer:
This is a technical analysis-based trade idea for educational and informational purposes only. It does not constitute financial advice. Please do your own research (DYOR) and consult your financial advisor before making any investment decisions. Trading involves risk, and past performance is not indicative of future results.
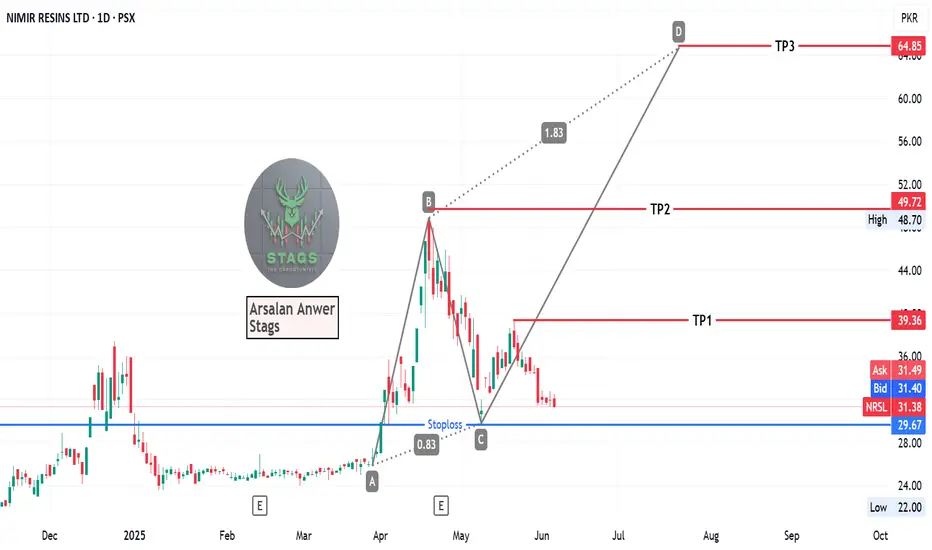
NRSL, 1D, ABCD Pattern, PSX, LongNRSL after hitting the 1st Leg now in consolidation phase.
Enter trade with current rate and SL closing below 29
TP1: 39
TP2: 49
TP3: 64
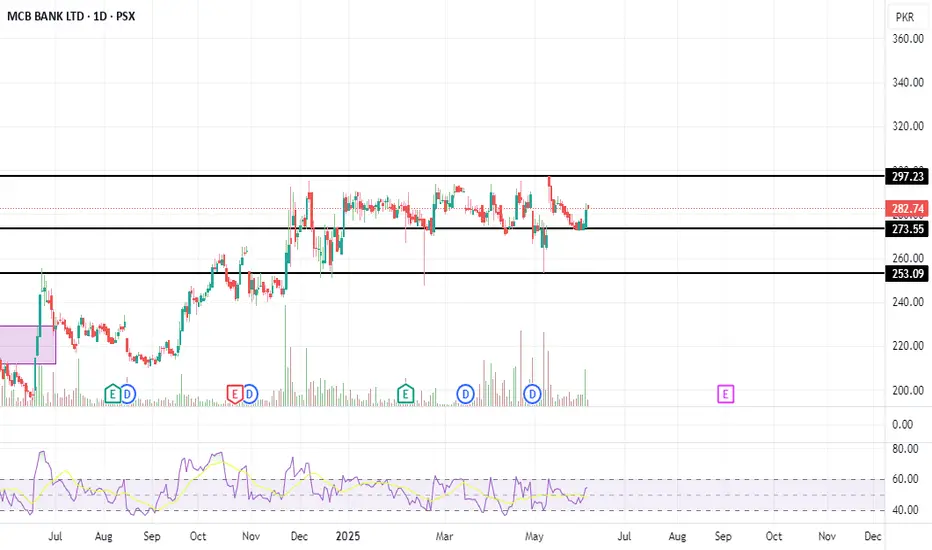
MCB Trading Strategy MB Share Buying Trading Strategy
MCB buying around 282-276
Stop loss 270
Target 296
SMCPL LONG TRADE 09-06-2025 (1H TF)SMCPL LONG TRADE
After a recent downtrend, SMCPL is showing signs of upper reversal in the form of an inverted head and shoulders pattern. This reversal is accompanied by increased volumes, adding credibility to the potential upside movement. The stock has created a flipped institutional demand zone and a gap, making this a safe long trade opportunity.
🚨 TECHNICAL BUY CALL – SMCPL🚨
- Buy 1: PKR 19 (current level)
- Buy 2: PKR 18.6
- Buy 3: PKR 18.1
- TP1: PKR 20
- TP2: PKR 20.94
- TP3: PKR 22.12
- TP4: PKR 23.40
- TP5: PKR 24.40
*Stop Loss:* Below PKR 17.7 Daily Close
*Risk-Reward Ratio:* 1:6.6
Caution: Please buy in 3 parts in buying range. Close at least 50% position size at TP1 and then trail SL to avoid losing incurred profits in case of unforeseen market conditions.
PLEASE BOOST AND SHARE THE IDEA IF YOU FIND IT HELPFUL.
