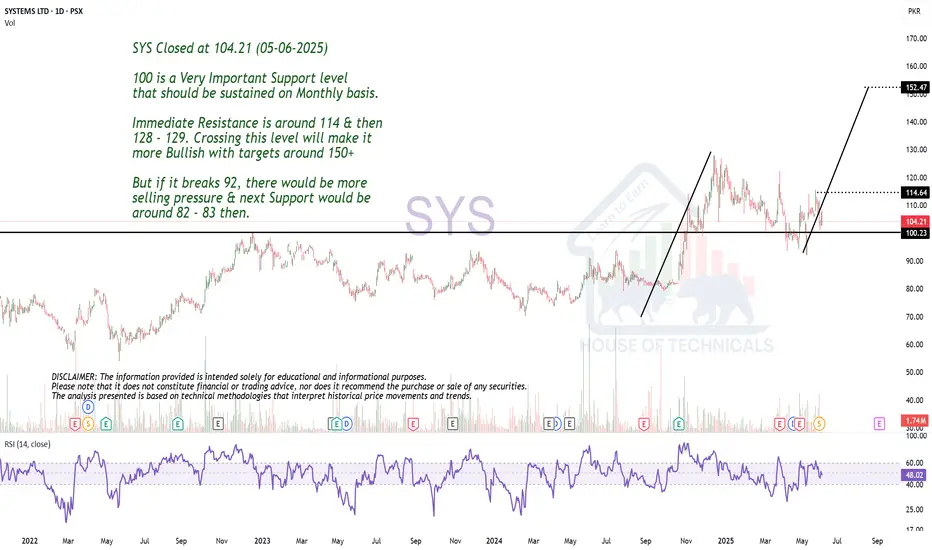
100 is a Very Important Support level.SYS Closed at 104.21 (05-06-2025)
100 is a Very Important Support level
that should be sustained on Monthly basis.
Immediate Resistance is around 114 & then
128 - 129. Crossing this level will make it
more Bullish with targets around 150+
But if it breaks 92, there would be more
selling pressure & next Support would be
around 82 - 83 then.
Currently trolling around channel resistance. Closed at 157.04 (05-06-2025)
Currently trolling around channel resistance.
Crossing 160 with Good volumes will bring more
positivity & upside price movement.
on the flip side, 151 - 152 & then 144 - 145 may
act as a Good Support.

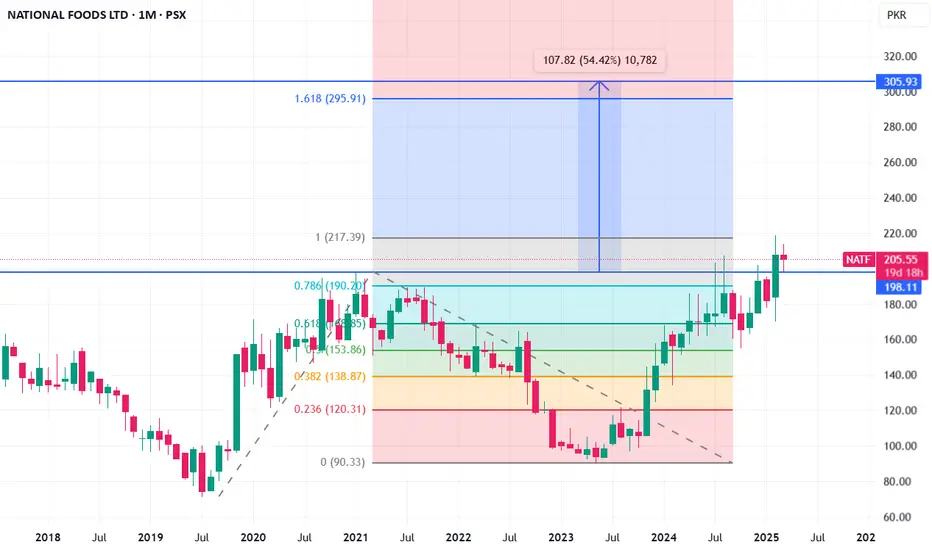
NATF LongNATF has broken its all time high with a marubozu candle and has retested its breakout level successfully.
Next targets are 295 (Conservative) and 305 (Optimistic).
Resistance level is 217-219 region.
Support is 198 and stop loss should be placed at 190.
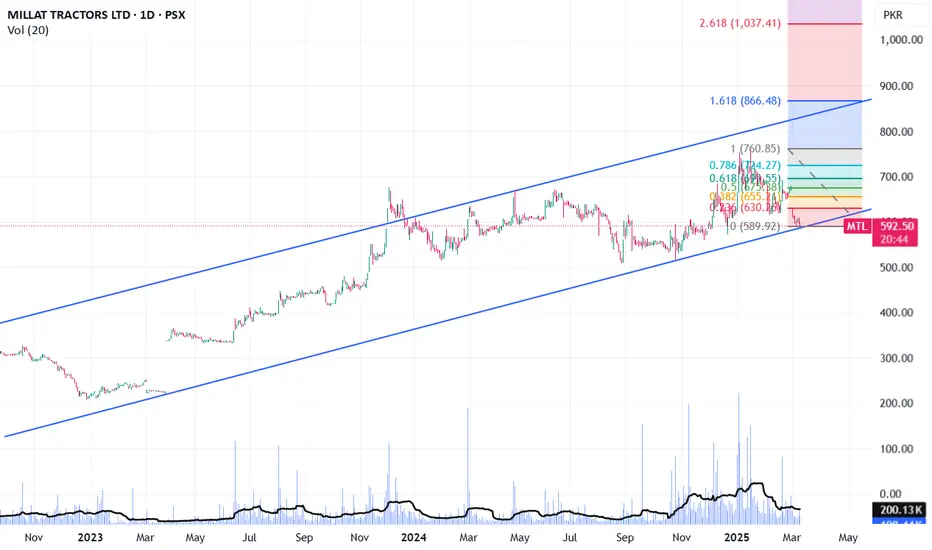
MTL has hit its channel bottomNow it will travel upwards. Next targets are 670, 750 and ultimately 866 (Fib 1.618).
This is not a buy / sell call.
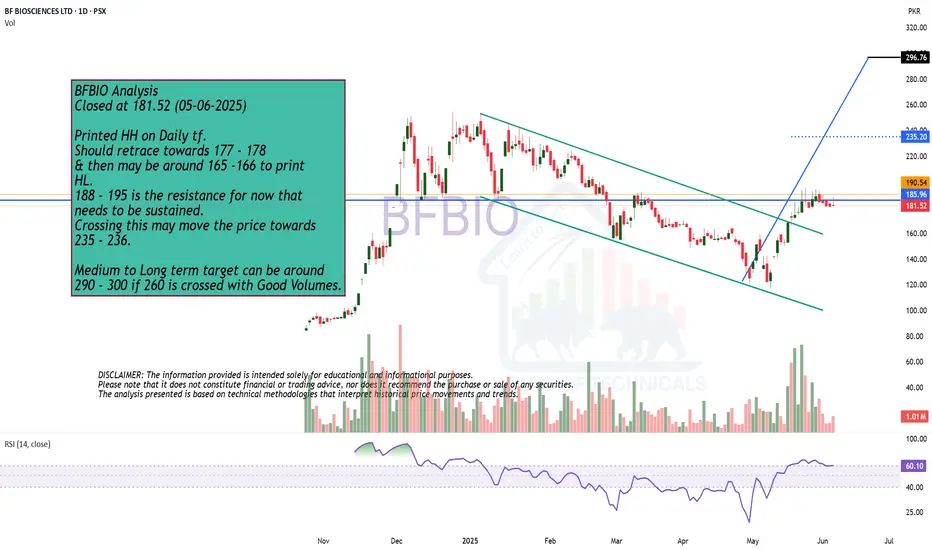
Good Stock for Medium to Long TermClosed at 181.52 (05-06-2025)
Printed HH on Daily tf.
Should retrace towards 177 - 178
& then may be around 165 -166 to print
HL.
188 - 195 is the resistance for now that
needs to be sustained.
Crossing this may move the price towards
235 - 236.
Medium to Long term target can be around
290 - 300 if 260 is crossed with Good Volumes.
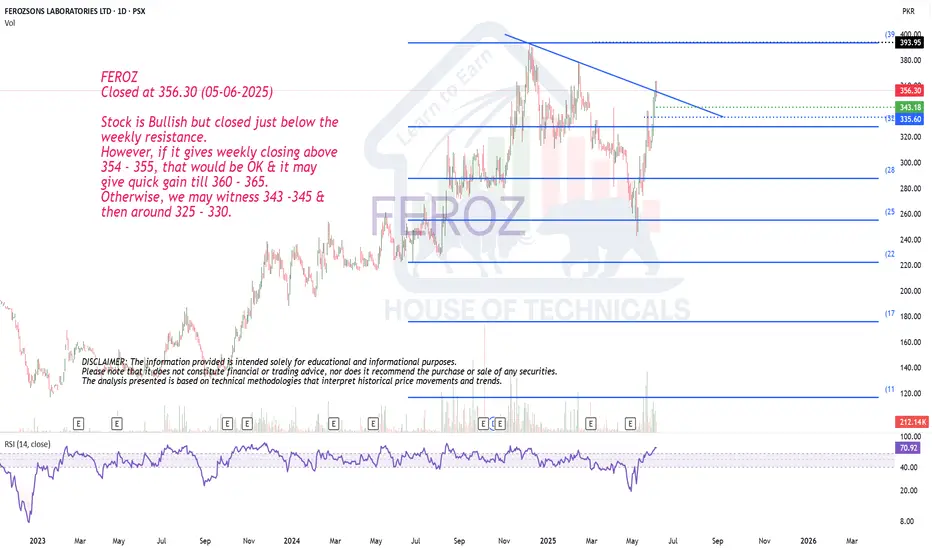
Stock is Bullish but..
Closed at 356.30 (05-06-2025)
Stock is Bullish but closed just below the
weekly resistance.
However, if it gives weekly closing above
354 - 355, that would be OK & it may
give quick gain till 360 - 365.
Otherwise, we may witness 343 -345 &
then around 325 - 330.
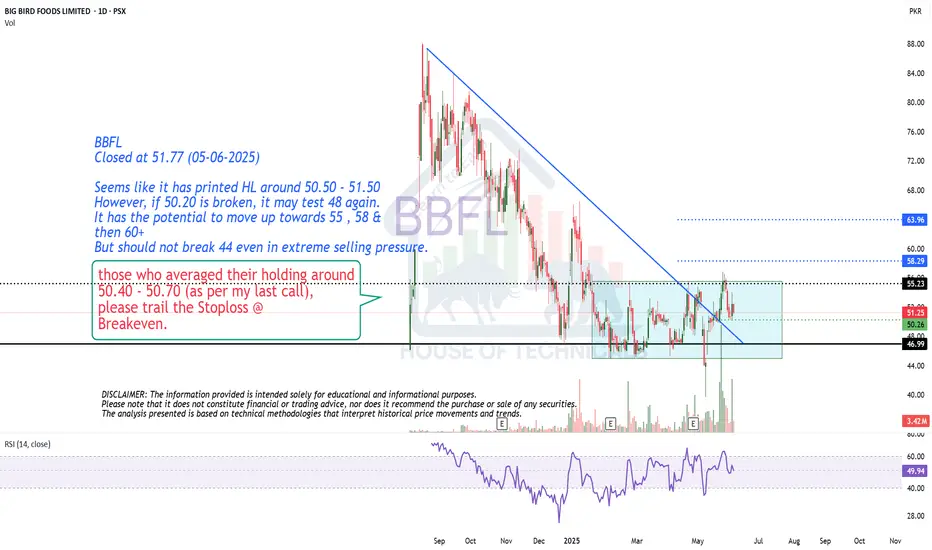
Seems like it has printed HL.
Closed at 51.77 (05-06-2025)
Seems like it has printed HL around 50.50 - 51.50
However, if 50.20 is broken, it may test 48 again.
It has the potential to move up towards 55 , 58 &
then 60+
But should not break 44 even in extreme selling pressure.
Bullish Divergence
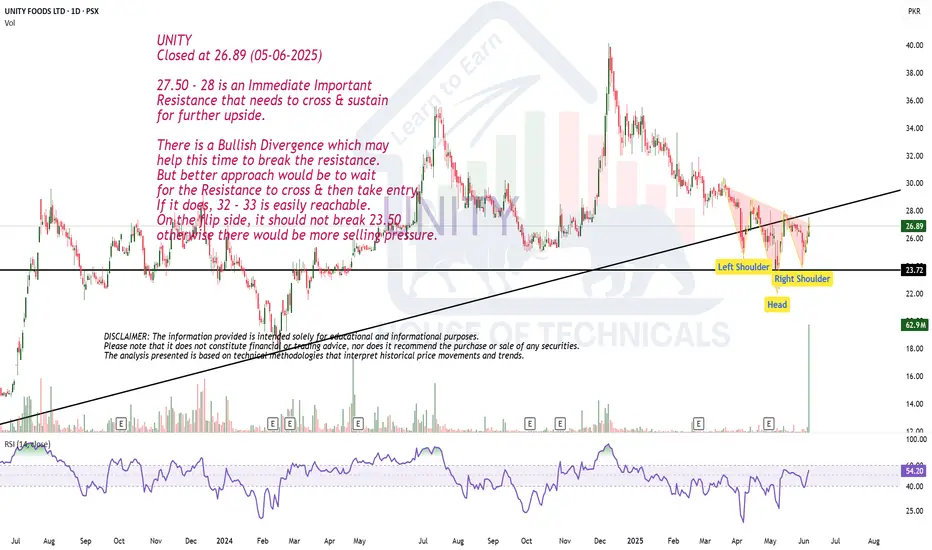
Closed at 26.89 (05-06-2025)
27.50 - 28 is an Immediate Important
Resistance that needs to cross & sustain
for further upside.
There is a Bullish Divergence which may
help this time to break the resistance.
But better approach would be to wait
for the Resistance to cross & then take entry.
If it does, 32 - 33 is easily reachable.
On the flip side, it should not break 23.50
otherwise there would be more selling pressure.
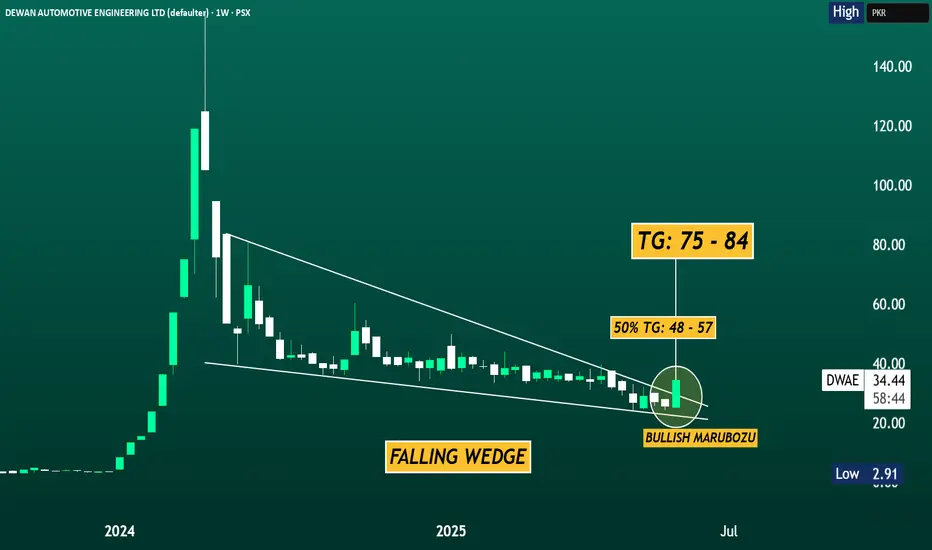
DWAE BULLISH MARUBOZU WITH STRONG BREAKOUT TG: 48 -57, 75 - 84📈 DWAE (Dewan Automotive Engineering Ltd) - TECHNICAL VIEW
Dewan Automotive Engineering Ltd (PSX: DWAE) has delivered a decisive breakout from a long-standing falling wedge pattern, accompanied by a powerful bullish marubozu candle on the weekly chart. The stock surged by +34.01%, closing at PKR 34.44, signaling the potential start of a new uptrend after an extended consolidation phase.
The falling wedge, a classic bullish reversal formation, had been compressing price action for several months. The current breakout, confirmed by increased volume and a strong weekly close above the wedge resistance, marks a shift in momentum from distribution to accumulation.
From a technical standpoint, the immediate initial target lies in the PKR 48–57 range—roughly the 50% retracement zone of the previous decline. A sustained move above this range would open the door toward the broader breakout objective of PKR 75–84, offering significant upside potential.
To maintain this bullish outlook, DWAE must hold above the breakout zone near PKR 28–30, which now acts as strong structural support. Any consolidation above this level would be viewed as a healthy retest and continuation setup.
In summary, DWAE has initiated a high-probability breakout from a classic wedge pattern, supported by a bullish candlestick structure and rising volume. As long as it holds above key support, the stock is well-positioned to advance toward PKR 48–57, with an extended target of PKR 75–84 in the coming weeks.
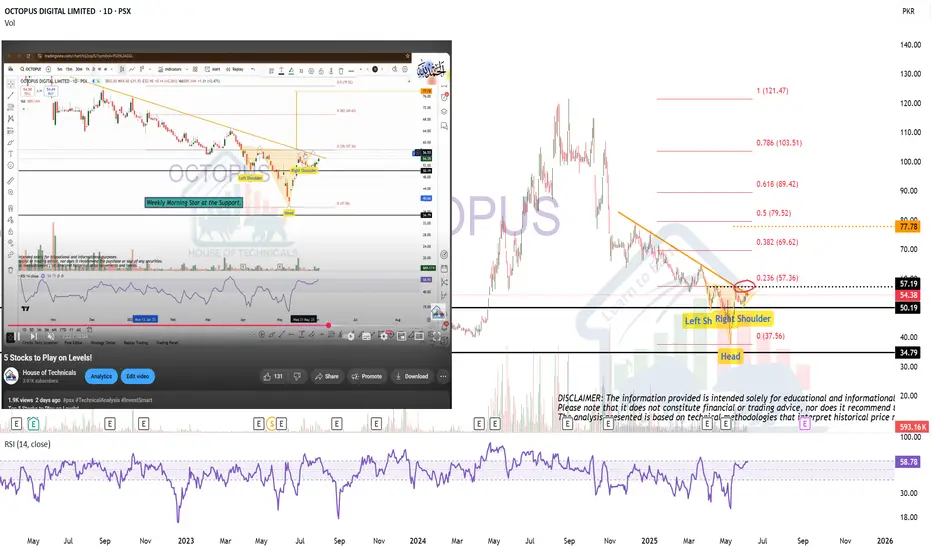
Inverse Head & Shoulders Forming – Watch for Breakout Above 28UNITY indicates the formation of an inverse head and shoulders pattern, a bullish reversal setup. The neckline resistance is drawn around the PKR 27.5–28 level, which also aligns closely with the 200-day EMA at PKR 28.23, adding to its significance. Volume has notably increased during the formation of the right shoulder, suggesting growing bullish interest. A long position should only be considered after a decisive breakout above the neckline resistance , ideally on strong volume, confirming the pattern. If the breakout occurs, the projected upside target could extend toward the PKR 34–35 range, which is a previous major resistance zone. Until then, the setup remains neutral and unconfirmed.

Currently at Strong Resistance level.TREET closed at 19.53 (23-05-25)
Currently at Strong Resistance level.
However, Weekly closing above 19.50 would
be a positive sign and we may see upside
around 21 - 21.30 & then 23.
Very Important Support lies around 17.50
& then around 14.50; however that would be
a very crucial level as breaking 14.50 would
trigger more selling pressure.

Currently in Consolidation.
Closed at 276.91 (04-06-2025)
Currently in Consolidation.
Crossing 280 would make it more
bullish; but 315 - 317 is the immediate
resistance.
If this level is Crossed with Good Volumes,
we may witness 450+

Making HH HL.
Closed at 40.45 (04-06-2025)
Making HH HL.
Bearish Divergence played well &
dragged the price from 44 - 45 to around 33.
Printed HL & started moving upside.
If 45 is Crossed & Sustained, we may witness
new Highs around 55 - 57.
However this time, Stoploss should be 33.50
on Closing basis.

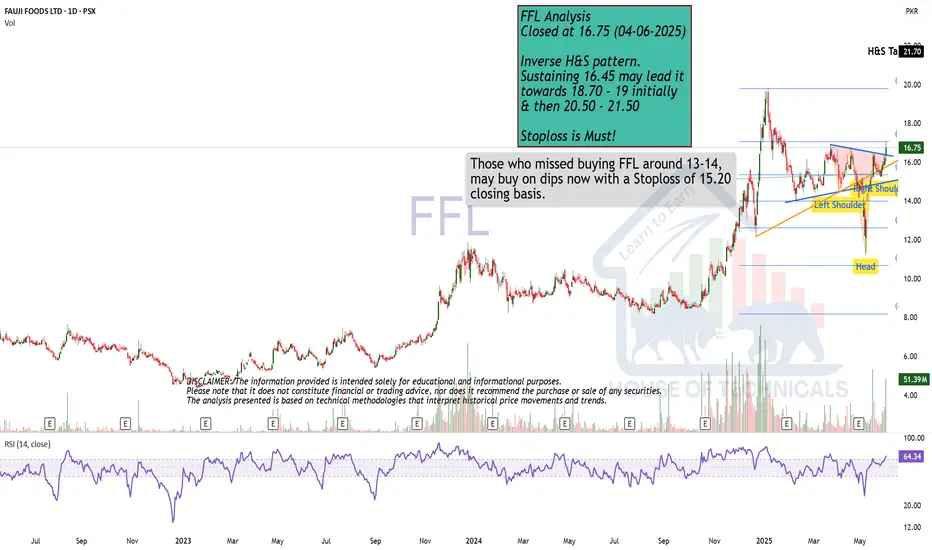
Inverse H&S pattern.Closed at 16.75 (04-06-2025)
Inverse H&S pattern.
Sustaining 16.45 may lead it
towards 18.70 - 19 initially
& then 20.50 - 21.50
Stoploss is Must!
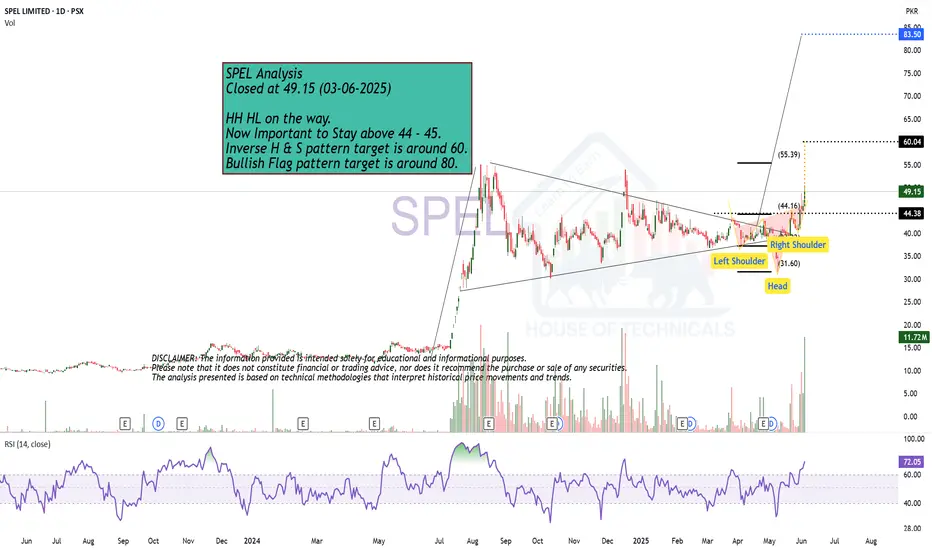
HH HL on the way.
Closed at 49.15 (03-06-2025)
HH HL on the way.
Now Important to Stay above 44 - 45.
Inverse H & S pattern target is around 60.
Bullish Flag pattern target is around 80.
Watchout LevelWatch out level for CRTM is around 17 - 17.10 which is actually a Strong Resistance point.
Crossing & Sustaining this level will lead it towards 21 initially.

GAL LONG TRADEGAL is in a Consolidation since past 5 months- the simple Rule of Trading Ranges is "BUY LOW AND SELL HIGH". GAL has been trading towards channel bottom and now has shown a significant reversal confirmed by HL, VG and price crossing over EMA-20 on 1H TF.
🚨 TECHNICAL BUY CALL –GAL🚨
🎯 BUY ZONE: Rs. 425-430
📈 TP 1: Rs. 445
📈 TP 2: Rs. 468
📈 TP 3: Rs. 490
🛑 STOP LOSS: Below Rs. 413 (Daily Close)
📊 RISK-REWARD: High Conviction | 1:5
Caution:
Buy in 3 parts within given range - Please close at least 50% position size at TP1 and then follow strict trailing SL to avoid losing incurred profits in case of unforeseen market conditions.
SHARE AND BOOST IF YOU FIND THIS HELPFUL

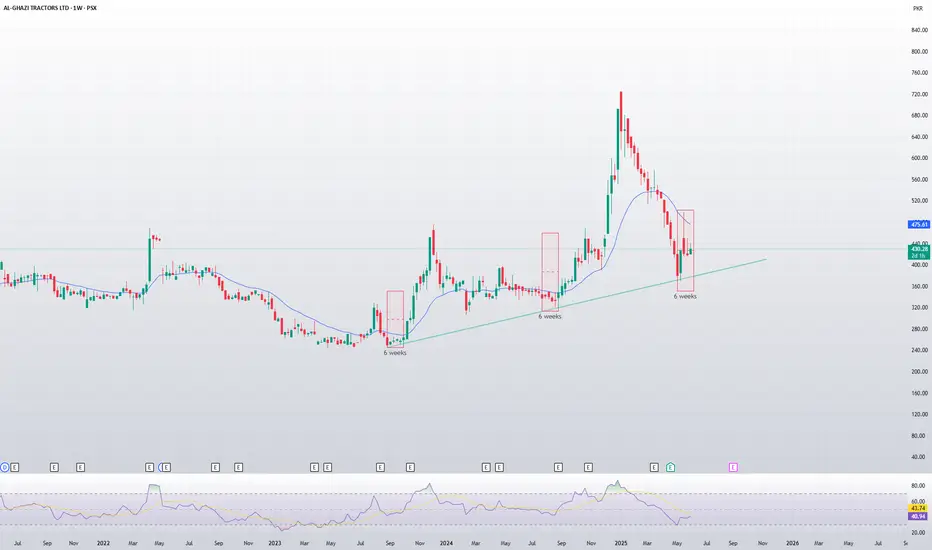
AGTL Weekly Chart Analysis (PSX: AGTL)🟢 Consistent Bullish Reaction from Trendline Support
Trendline Support: Price is respecting a strong ascending trendline that has been tested multiple times since 2023.
Key Observation:
Each time price touches the trendline, it consolidates for exactly 6 weeks.
After this 6-week consolidation, AGTL typically enters a strong bullish rally.
🔁 Repeating 6-Week Pattern
First Zone: October 2023 — 6-week base → breakout rally.
Second Zone: July 2024 — again 6-week accumulation → bullish trend resumes.
Current Zone: May 2025 — AGTL touched the trendline again and has completed another 6-week base.
This is the third time this exact behavior is repeating, indicating a strong fractal pattern and high probability of a new uptrend starting soon.
🔮 Bullish Outlook
If history repeats, AGTL is likely to start rallying soon, potentially leading to a new swing high over the coming weeks/months.
The 6-week cycle provides a time-based edge to anticipate movement rather than reacting late.
📌 Possible Price Projections for Bullish Trend
These are historically grounded targets based on actual previous price movements following similar trendline+consolidation patterns.
If AGTL follows the same 6-week base → rally pattern again:
Short-term target: ~670 PKR (87%)
Extended bull case: ~1030 PKR (188%)
📈 Conclusion
AGTL is showing strong technical consistency:
Each touch of the trendline has led to a 6-week accumulation followed by a bullish breakout.
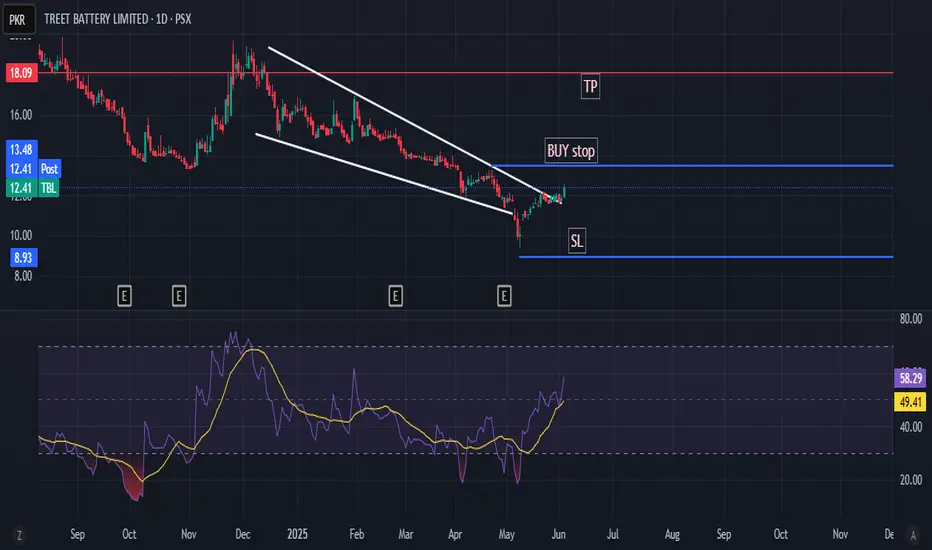
TBL printing a falling Wedge TBL printing a falling Wedge, entry with a buy stop right above last Lower High. RR 1:1
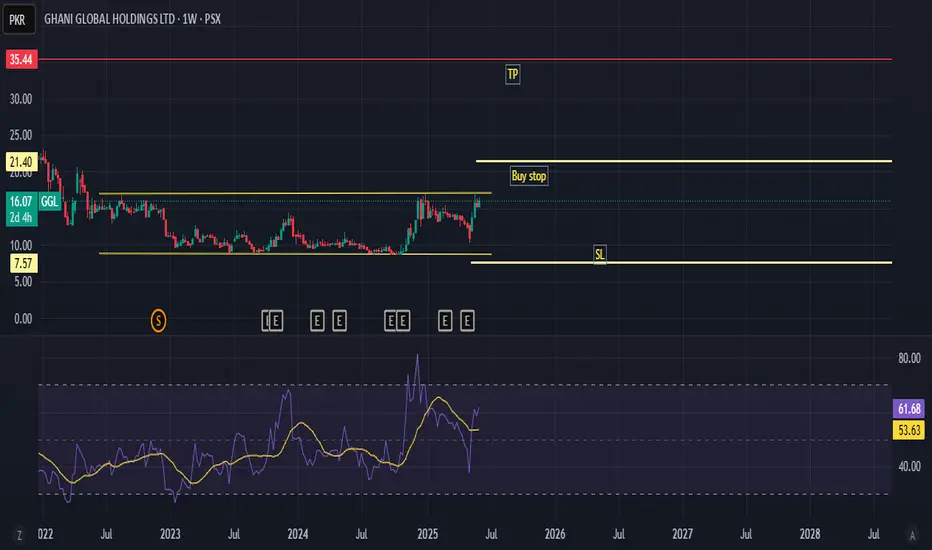
GGL potential bullish setup GGL in accumulation phase expected breakout is Bullish, entry with a buy stop over the Accumulation box.
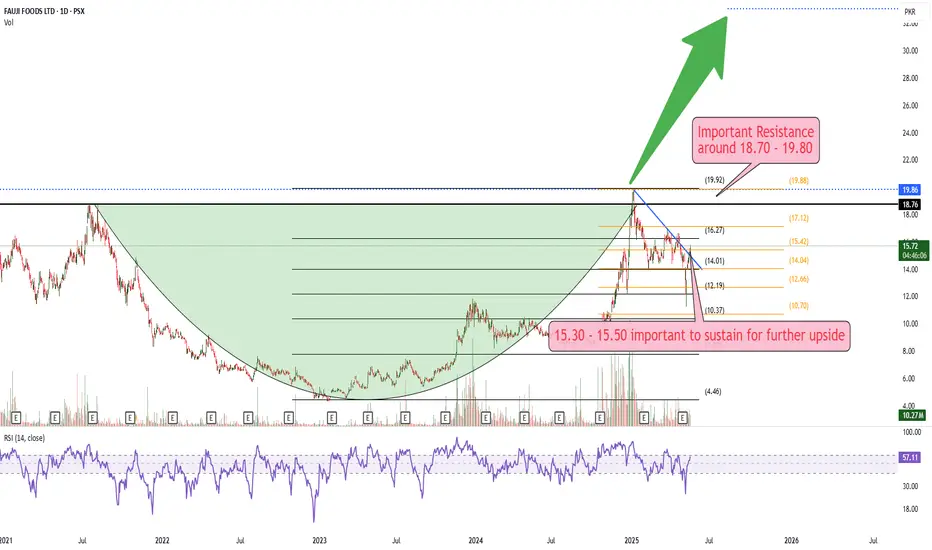
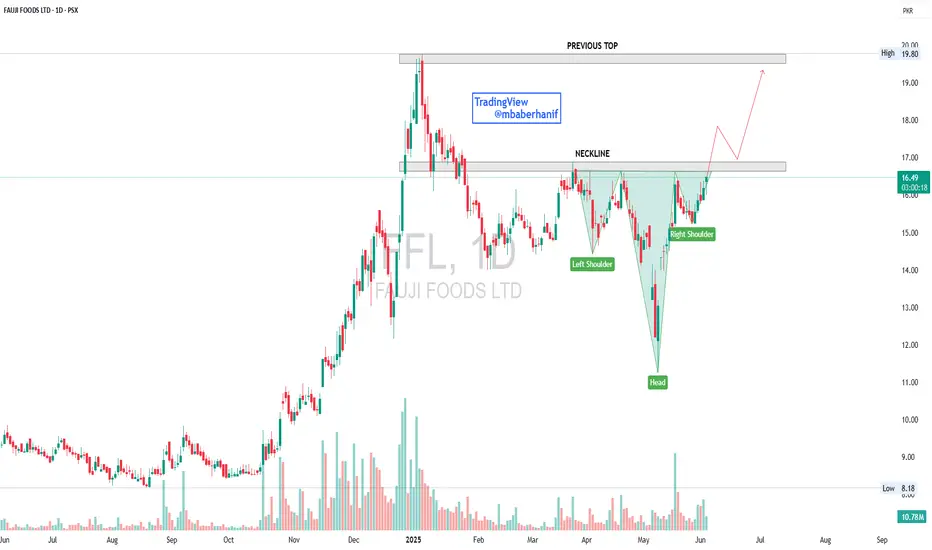
FFL | Inverse H&SFFL is forming Inverse Head and Shoulder Pattern on daily time frame, which a bullish reversal pattern, currently the stock is at neckline resistance upon break out and retest more upside towards 19.50 is expected.
Nice Setup15.30 - 15.50 important to sustain for further upside
Important Resistance is around 18 - 18.70