Taking Support from a Strong Trendline
Bullish Divergence on shorter tf.
Taking Support from a Strong Trendline
around 14.50 which is also a Channel Botom.
Channel Top is around 21 - 22 but mid-way
resistance is around 17 - 18
So Good Entry would be is 16 is Crossed & Sustained
on weekly basis otherwise around 13.50 - 14.60

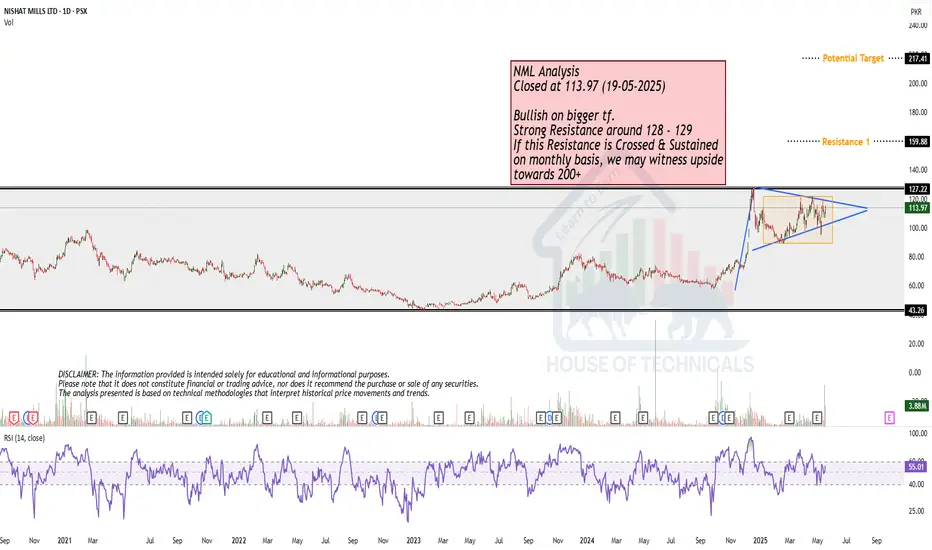
Bullish on bigger tf but Strong Resistance ahead.
Bullish on bigger tf.
Strong Resistance around 128 - 129
If this Resistance is Crossed & Sustained
on monthly basis, we may witness upside
towards 200+
ENGROH PSX trade ideaENGROH PSX trade idea:
Clear breakout and reversal on ENGORH chart are printed, Possible target and SL as mentioned.

AVN SHORT-SELL TRADEAVN been in DOWNTREND since Sep 2024.
Recent up leg has been mostly due to across the board Bullish Sentiments because of improvement in Geo Political Environment.
Current Up Move is also just a healthy Pullback in overall Downtrend.
There's strong Bearish Breaker Block overhead current levels which will obstruct any upward movement.
🚨 TECHNICAL SHORT SELL CALL –AVN 🚨
🎯 SHORTSELL ZONE : 52.2-50.2
📈 TP1 : Rs. 46.5
📈 TP2 : Rs. 41.2
🛑 STOP LOSS: Above Rs. 55 (Daily Close)
📊 RISK-REWARD: High Conviction | 1:3.8
Caution:
Please close at least 50% position size at TP1 and then follow strict trailing SL to avoid losing incurred profits in case of unforeseen market conditions
PLEASE BOOST THE IDEA IF YOU FIND IT HELPFUL.

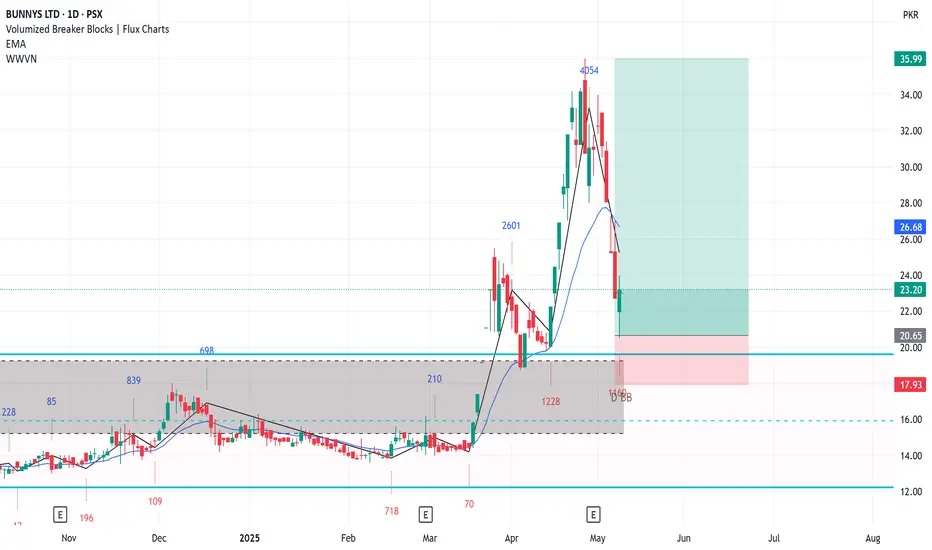
BNL LONGTRADEBNL has completed two upward legs after breakout, it is highly likely to start its third and final leg before starting major correction.
It is expected to at least test recent high of 36 and may even exceed it
BNL buy 20-24
TP1 28
TP2 36
SL 18.9
TPLP Technical Analysis(Weekly): Potential Bullish SetupTPLP (TPL Properties Ltd) has recently bounced from a monthly support level, accompanied by a strong bullish closing on the weekly chart, indicating a good discount level for potential buyers. The price also took support from a downward trendline on the weekly timeframe. While we may or may not retest the Buy 2 level, there is a probability as it aligns with a daily gap-up level that price might look to fill. After Take Profit 2, there isn't significant major resistance, suggesting the potential for the price to reach Take Profit 3. It's truly a game of probabilities, and the odds here look compelling for upside!
Trading Recommendations:
Buy 1 (CMP): 9.14
Buy 2: 7.3
Stop-Loss Level: Closing below 6
Take Profit 1: 14.7
Take Profit 2: 20
Take Profit 3: 38.5
Happy trading!

TELE Breakout: Bullish Momentum AheadThe chart shows a recent bullish breakout above a descending trendline, signaling a potential trend reversal after a prolonged downtrend. The price has moved above the resistance zone around 7 and is currently trading at 7.54. A projected bullish path is indicated with dotted red lines, targeting a future price of 10, suggesting investor optimism. The chart also outlines a risk management zone with a stop loss at 5.50, highlighting a favorable risk-reward ratio. This setup implies a bullish bias with potential consolidation around the 7.50–8.20 zone before any strong continuation upward. Expected final target towards 10 which is 42.86% gain from its entry point.

BNWM is above breakout levelBNWM is above breakout level of 32.95 and it is expected to cross 41 level.
SL is 29.57 and this is not a buy/sell trade call. It is an analysis. Trade at your own will.

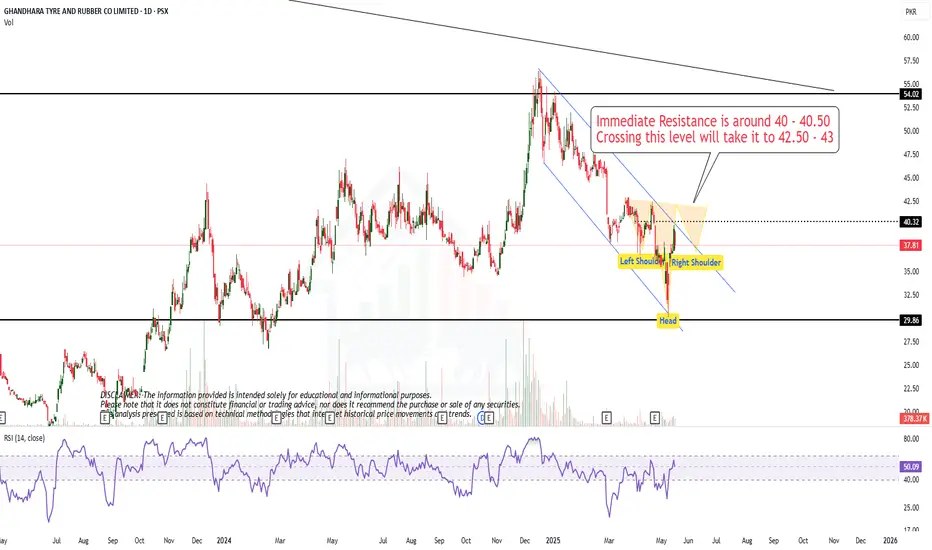
Possible Setup..Immediate Resistance is around 40 - 40.50
Crossing this level will take it to 42.50 - 43
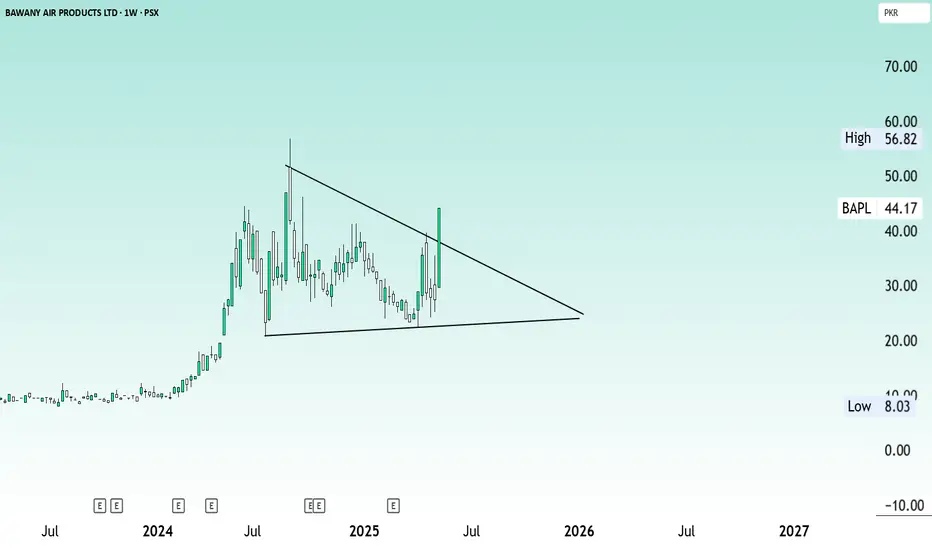
BAPL Breakout: Ignites with 61% Weekly Surge; TP 56 - 69 - 77Bawany Air Products Ltd (BAPL) has delivered a powerful breakout on the weekly chart, surging by an impressive 61.09% to close at 44.17 as of May 18, 2025. This move marks a clear breakout from a long-standing descending triangle pattern, signaling a shift from a consolidation phase to a fresh bullish trend. The breakout is technically significant and suggests strong buying interest and renewed momentum in the stock.
Using Fibonacci retracement levels from the prior swing high of 56.82 to the low of 22.30, BAPL has already surpassed the critical 61.8% level at 44.06. This opens the path toward the next resistance levels at 49.25 (78.6%) and 56.82 (100%). Beyond that, Fibonacci extension levels suggest medium-term targets at 64.48, 69.62, and even 77.78, indicating the potential for a multi-leg rally if the momentum sustains.
The Stochastic RSI is also supporting the bullish case, with both lines rising strongly—green at 61.93 and red at 57.23—indicating continued upward momentum. Immediate support lies around 40.00, while deeper support is near 35.40, both of which could serve as buy-on-dip zones. In summary, BAPL appears to be entering a high-momentum phase, with short-term targets in the 49–57 range and higher upside possible as long as key support levels hold.
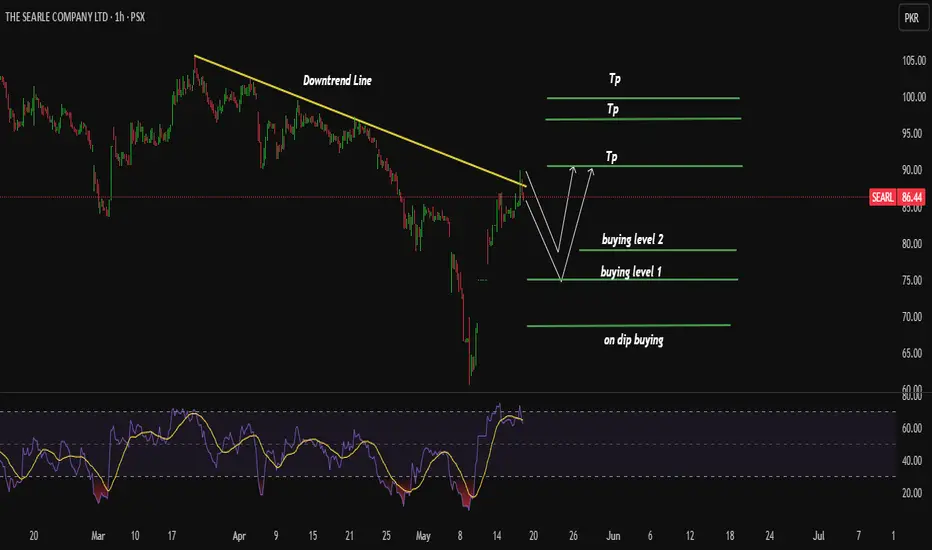
SEARLSEARL short swing
Buy on dip still facing rejection from top of downtrend line
buying levels mention

ISL Buying StrategyHere's a breakdown of the trading strategy for ISL stock:
Trading Strategy:
- *Breakout Confirmation:* Successful breakout above a certain level (not specified)
- *Buying Strategy:*
- Buy around: Rs. 81-77
- Stop Loss: Rs. 73
- *Targets:*
- 1st Target: Rs. 87
- 2nd Target: Rs. 100
- *Further Action:*
- Hold the stock if it sustains above Rs. 100
- Use trailing stop loss to lock in profits
Key Considerations:
- *Risk Management:* Setting a stop loss at Rs. 73 limits potential losses
- *Profit Booking:* Targets at Rs. 87 and Rs. 100 provide clear profit-booking levels
- *Trailing Stop Loss:* Adjusting the stop loss as the stock price moves up can help lock in profit

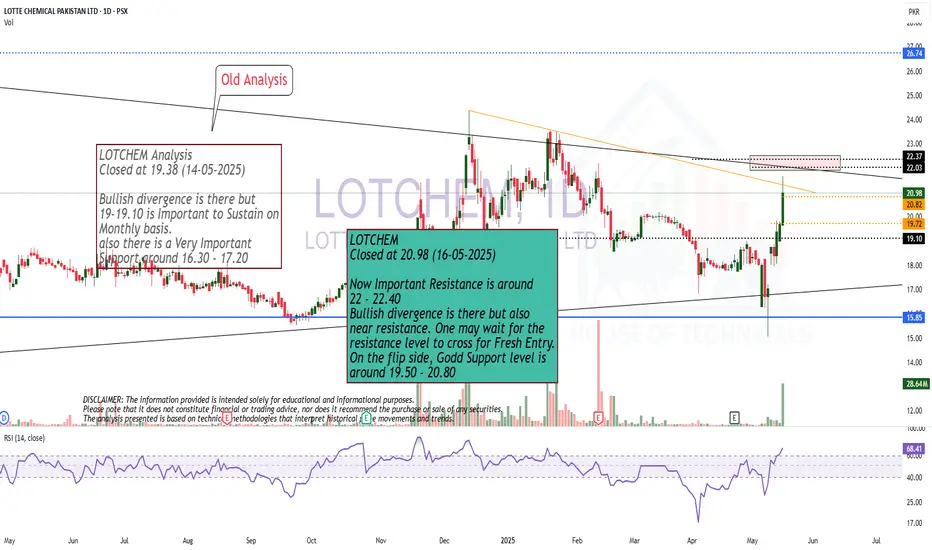
Play on levels.Now Important Resistance is around
22 - 22.40
Bullish divergence is there but also
near resistance. One may wait for the
resistance level to cross for Fresh Entry.
On the flip side, Godd Support level is
around 19.50 - 20.80
Play on Levels!
Monthly Closing above 290 -292 is a positive sign.
If this level is sustained, it may hit 335 - 348 easily.
On the flip side, Important Support levels are 280 - 283
and then around 250

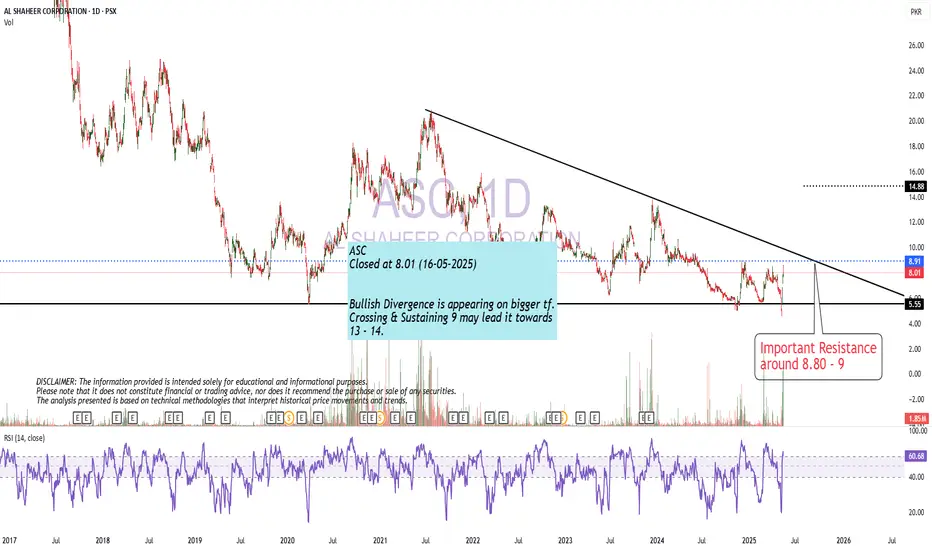
Bullish Divergence
Bullish Divergence is appearing on bigger tf.
Crossing & Sustaining 9 may lead it towards
14 - 15.
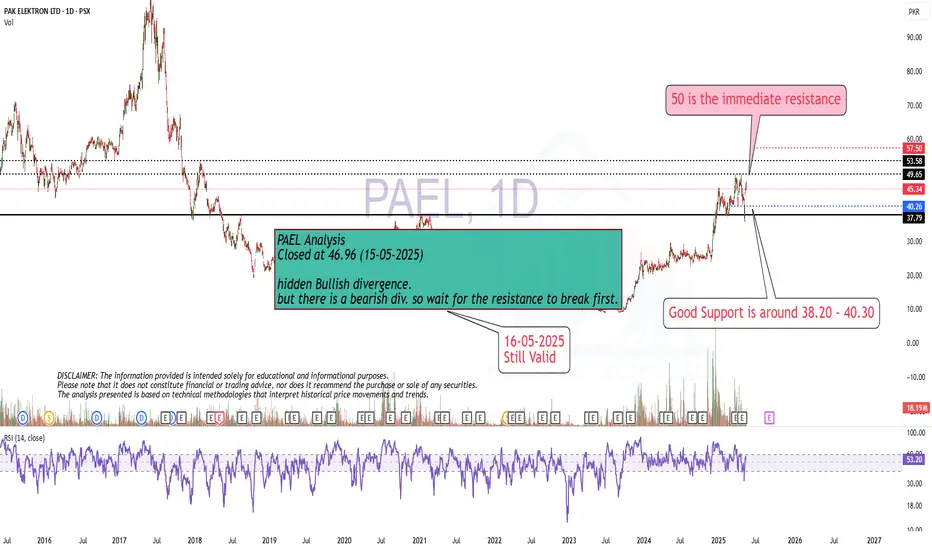
Wait for the Resistance to Cross!hidden Bullish divergence.
but there is a bearish div. so wait for the resistance to break first.
Beautiful candle but Bearish Divergence is also there..
Beautiful candle formed on Weekly basis.
But Bearish Divergence is also appearing
& a very strong resistance is around 111.
Crossing & Sustaining this level will expose
125+
Remember, if 104 - 105 is not sustained, the channel
bottom is around 80 - 82

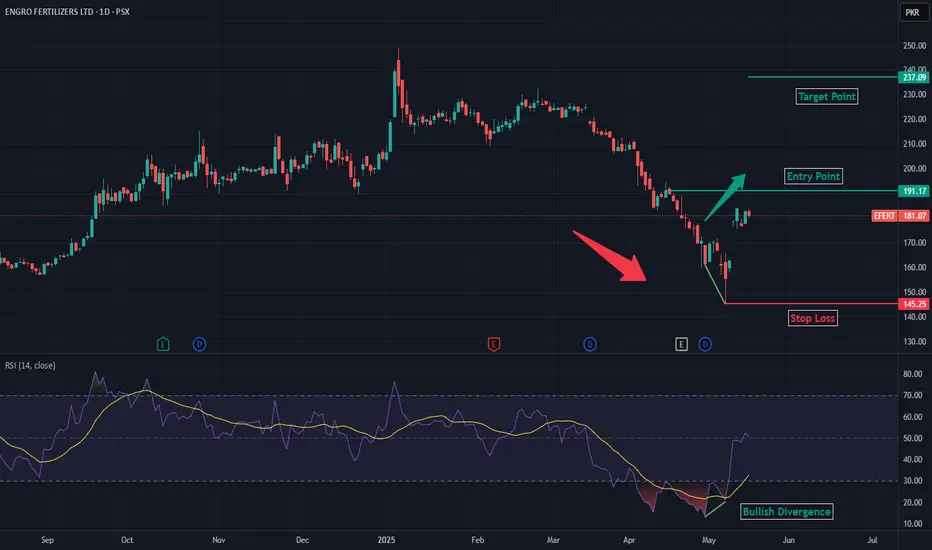
Bullish Divergence in EFERTThere is a bullish divergence observed in the EFERT chart on the daily timeframe. The current downtrend has already reversed and will be confirmed if the previous LH is broken and a new HL is formed. If the previous LH is broken, it will be a good time to take a long position as indicated on the chart.
Higher Low intact.Important to Sustain 51 - 52 on
weekly basis for further upside.
If this level is crossed with good volumes,
we may witness 59 - 60
and if 51-52 is not sustained, we may witness
36-37 again & even 26 - 27 (in extreme selling pressure)
which seems somewhat unlikely because HL has not yet broken.
