PIBTL SHORT TRADEShort sell PIBTL if it falls below its uptrend channel
It has already given upward Shortening of Thrust and a lower high
Short PIBTL 9.0
TP1 7.25
TP2 5.7
TP3 5.2
SL 9.55

BFAGRO SAFE LONG TRADEBFAGRO is going through textbook low volume Pullback, it's highly likely to rebound from underlying Breaker Block and Fair Value Gap.
Buy BFAGRO 28.7 & 28.0
TP1 30
TP2 32.3
SL 26.9

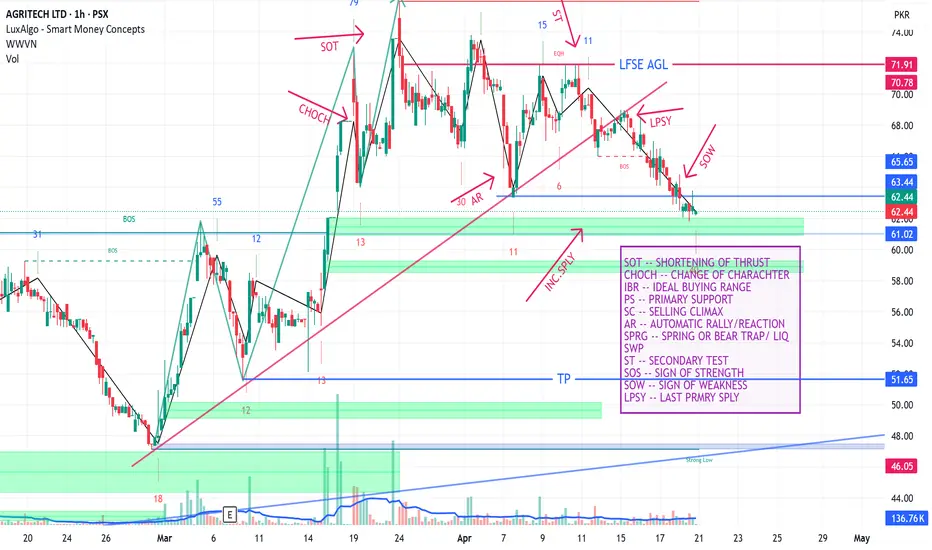
AGL SHORT TRADEAGL has completed its distribution phase of Wyckoff Cycle and has started its downtrend.
shortsell @ 64-62
TP 52
SL above 66
IF YOU MISSED BNL- DON'T SKIP TREET BREAKOUTTREET was in long-term downtrend till June 2021, it gave breakout in June and it's Pullback continued from July 21 to Dec 2022. I has been long term accumulation phases A,B,C & D of Wyckkoff Method from Dec 2022 to Dec 2024. It has given breakout from this consolidation and has given a beautiful Spring on Pullback of phase D. Huge up move after Breakout with above average volume and candle after Rs 22.2

UNITY- INVESTMENT TRADEUNITY in trading in uptrend channel since May 23
It has reached bottom of this channel
It has successfully created a perfect spring/bear trap in Prominent OverSold Area (POSA)
It is low risk high probability investment trade set up with around 50% potential gain.
BUY1 @27.8
BUY2 @26.1
TP 35.8
SL 23.9

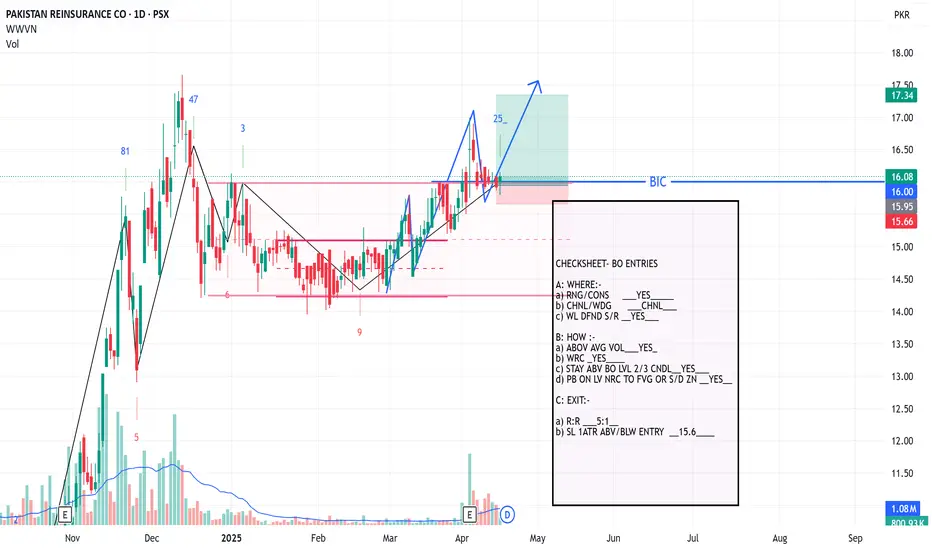
PAKRI LONG TRADEPAKRI was in consolidation range for four months, it gave a BreakOut on 4th April. It has successfully retested the BO.
Buy around 16
TP 17.3
SL below 15.5
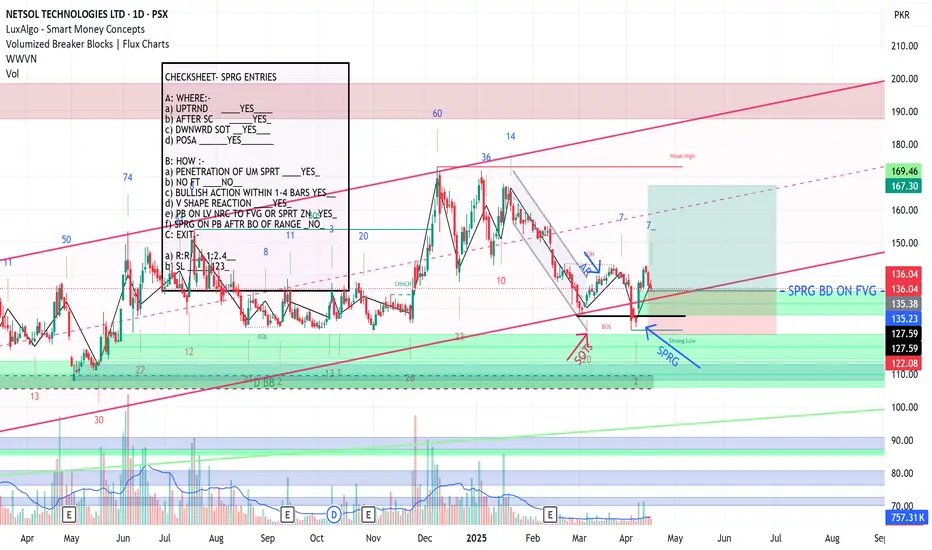
NETSOL- LOMG TRADENETSOL has reached bottom of its upward channel.
It has created an excellent Spring/Bear Trap in Oversold area/bottom of channel.
It is a low risk high probability set up
BUY 1 @136
BUY 2 @ 130
SL BELOW 123
TP1 @ 155
TP2 @ 166
R:R=3:1
FCCL- LONG TRADEFCCL is moving in Uptrend Channel. it recently broke a support but which proved to be a bear trap or spring. Currently it's on Spring board or retest lvl.
Buying 45-47
TP1 49
TP 2 51
TP3 53
SL below 44

SEARL- SHORT TRADESEARLE is in downtrend channel, its bearish attitude is also confirmed with Volume Behavior Analysis.

SHORT SELL AIRLINKAIRLINK is in Downtrend since January 2025.
It has recently tried to Breakout of the downward channel but failed to post a higher high
It has created a double top instead
Short Airlink 166-177
TP1 156
TP2 143
SL 186

BOP SHORT TRADEBOP has recently broken its upward trendline with heavy volumes
Short sell BOP 9.7-10.7
TP1 8.8
TP2 7.8
SL 11.1

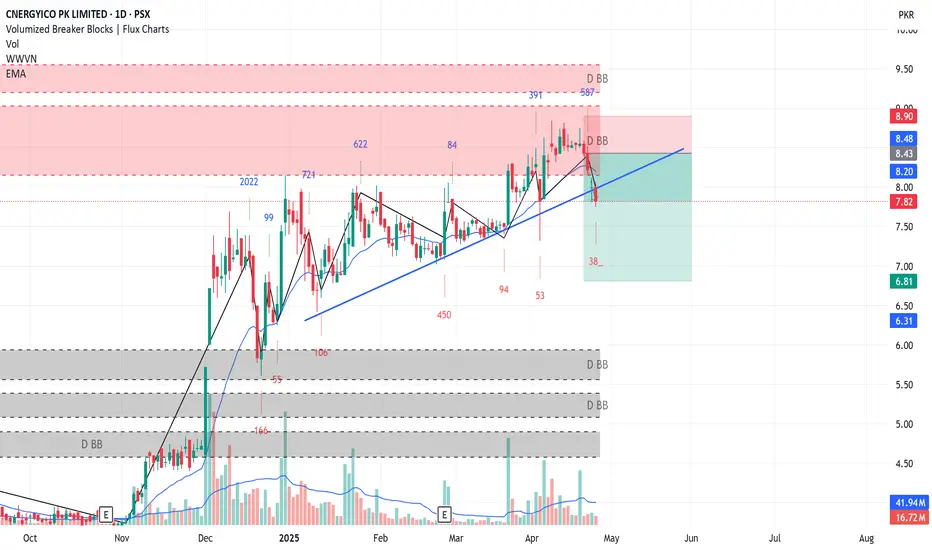
CNERGY SHORT TRADECNERGY has recently broken down of its upward trend line after encountering Bearish Breaker Block
It is expected to continue its new downtrend
Short CNERGY 7.8-8.1
TP 6.8
SL 8.9
PSO SHORT TRADEPSO failed to post a Higher High in its effort in March 2025
It has broken down its Upward Trendline with heavy volumes
It is expected to continue downward at least till its next support at 325
Short Sell PSO 370-360
TP 325
SL 381

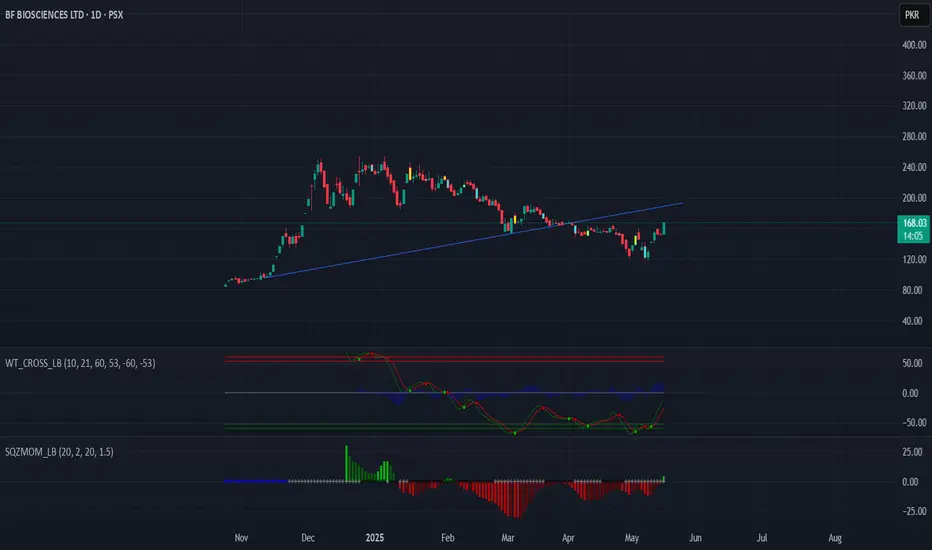
BF BIOSCIENCE BullishBUY SIGNAL...!!!!
Recent Price Movement: As of May 16, 2025, BFBIO's stock price closed at PKR 168.03, marking a 10% increase for the day. Over the past week, the stock has risen by 11.86%, although it has experienced a 3.45% decline over the past month.
TradingView
Technical Analysis: The stock is currently in a bullish zone, with analysts suggesting potential movement towards the PKR 200–250range in the near future. WT Cross indicators shows a great breakout from -55 zone which shows a strong trend reversal where as squeeze momentum breakout green histogram
Moving Averages: The 5-day and 50-day moving averages are at PKR 153.76 and PKR 143.35 respectively, both indicating a bullish trend.
Investing.com
Relative Strength Index (RSI): The 14-day RSI stands at 62.67, suggesting that the stock is approaching overbought territory, which often precedes continued upward momentum
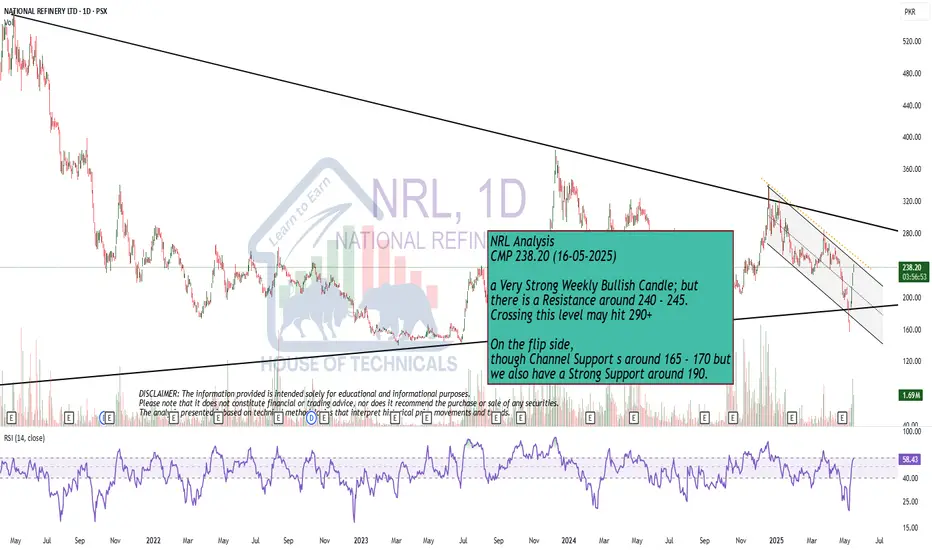
a Very Strong Weekly Bullish Candle; but
a Very Strong Weekly Bullish Candle; but
there is a Resistance around 240 - 245.
Crossing this level may hit 290+
On the flip side,
though Channel Support s around 165 - 170 but
we also have a Strong Support around 190.
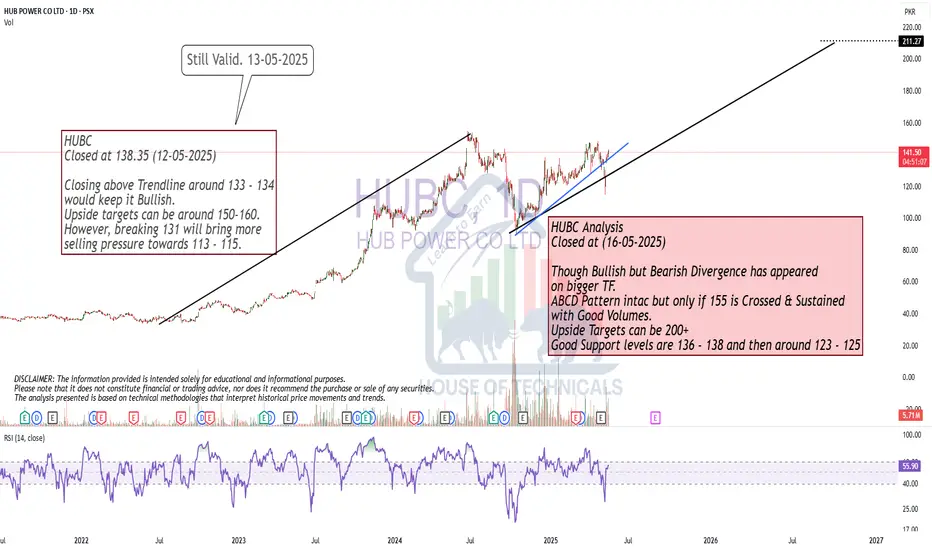
Though Bullish but..
Though Bullish but Bearish Divergence has appeared
on bigger TF.
ABCD Pattern intac but only if 155 is Crossed & Sustained
with Good Volumes.
Upside Targets can be 200+
Good Support levels are 136 - 138 and then around 123 - 125
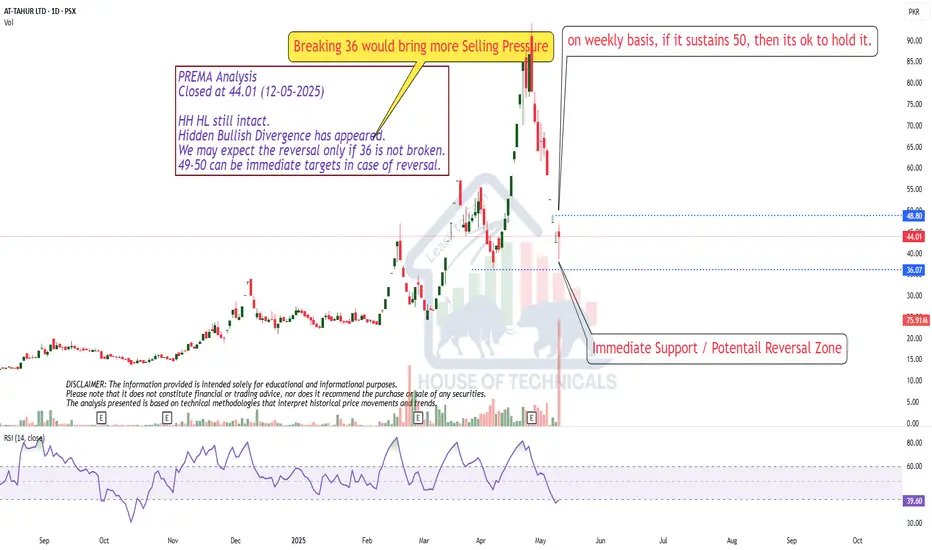
HH HL still intact.
HH HL still intact.
Hidden Bullish Divergence has appeared.
We may expect the reversal only if 36 is not broken.
49-50 can be immediate targets in case of reversal.
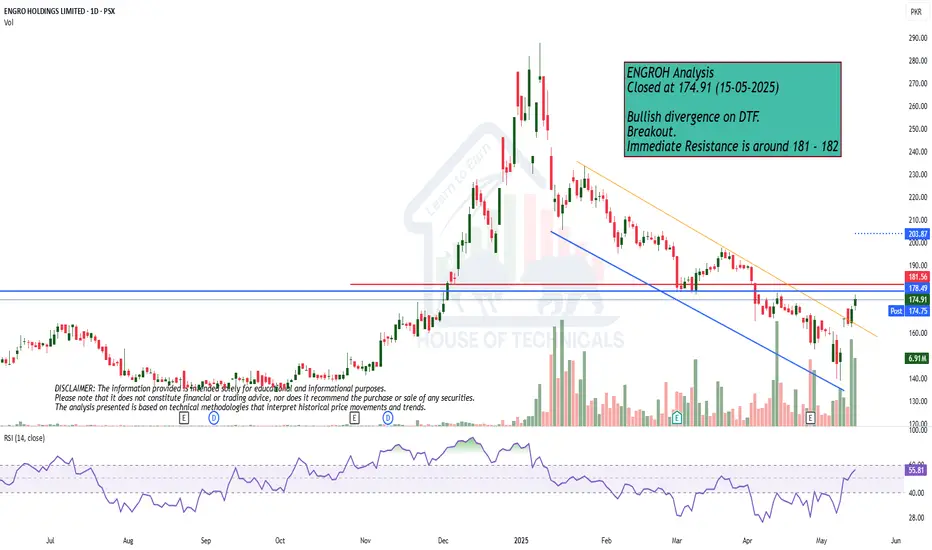
Bullish Divergence on DTF.
Bullish Divergence on DTF.
Important Resistance is around 52.50
However, sustaining this level will
expose 55 - 60 zone.

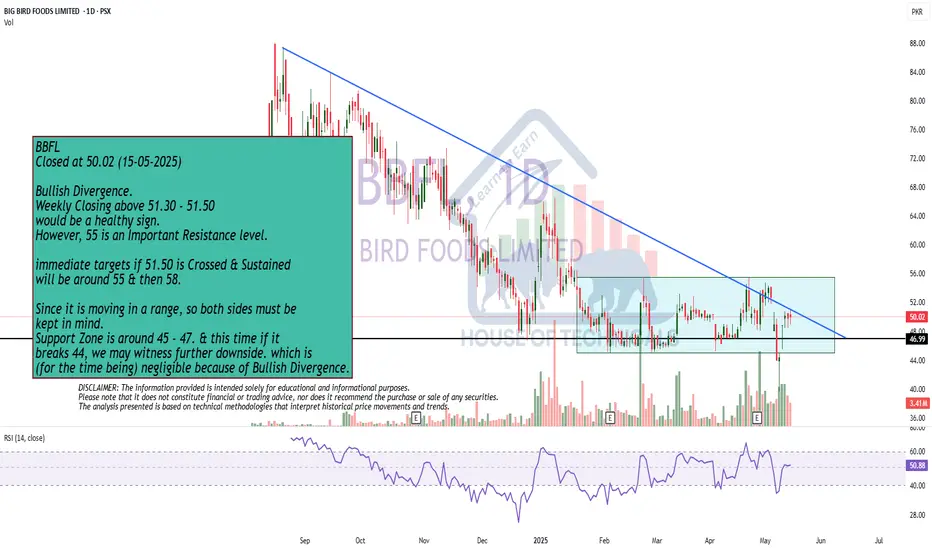
Bullish Divergence.
Bullish Divergence.
Weekly Closing above 51.30 - 51.50
would be a healthy sign.
However, 55 is an Important Resistance level.
immediate targets if 51.50 is Crossed & Sustained
will be around 55 & then 58.
Since it is moving in a range, so both sides must be
kept in mind.
Support Zone is around 45 - 47. & this time if it
breaks 44, we may witness further downside. which is
(for the time being) negligible because of Bullish Divergence.
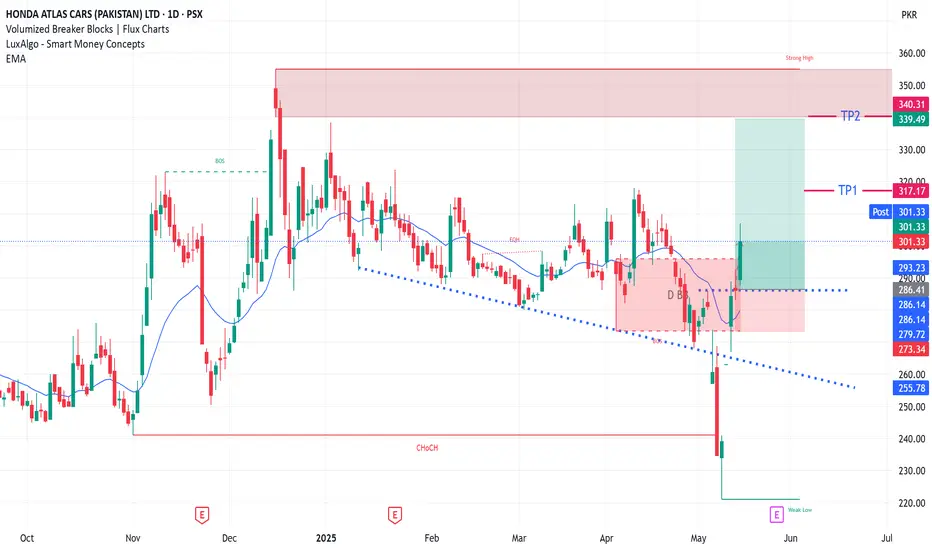
HCAR LONG TRADEHCAR has been in Bearish Channel which actually acts as Bull Flag.
It went below the channel in false breakdown to facilitate Selling Climax which is transfer of possession from Weak Hands ( Individuals ) to Strong Hands ( Institutions ).
This process and its components are actually a fuel for future uptrend.
Low Wave volume during Selling Climax/ Bear Trap are signs of Fake Breakdown to influence weak hands to sell their shares so that institutions have ownership during uptrend
BUY HCAR 290-300
TP1 320
TP2 340
SL BELOW 280
Monthly Closing above 7.50 - 7.60 will be very healthy!
Monthly Closing above 7.50 - 7.60
would be a very healthy sign.
We may then easily witness upside
towards 8.70 - 9.10 & then 10.50 - 11
Remember it is in a long consolidation
with Slowly moving in an Upward Channel.

Hascol is ready to flyHascol possible breakout level is 10.54. Possible TP could be above 12 and SL is below 10.
