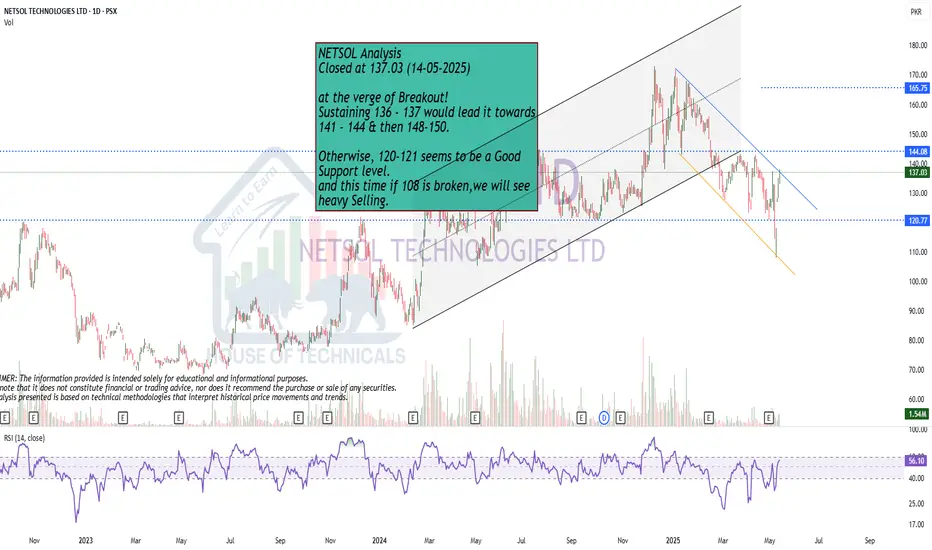
at the verge of Breakout!
at the verge of Breakout!
Sustaining 136 - 137 would lead it towards
141 - 144 & then 148-150.
Otherwise, 120-121 seems to be a Good
Support level.
and this time if 108 is broken,we will see
heavy Selling.
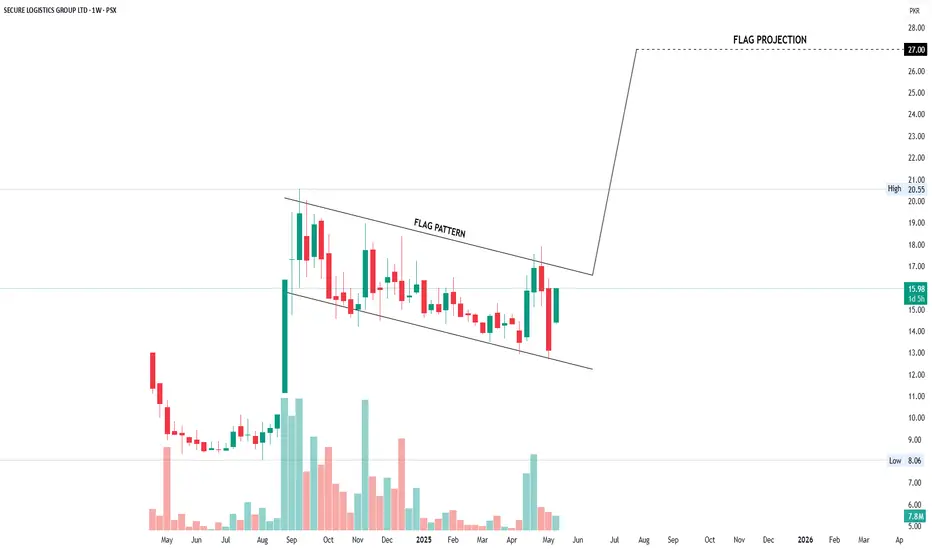
SLGL - Flag PatternSLGL is presently forming a flag pattern, which is expected to break out above the flag's resistance level of PKR 16.50-17. A successful breakout above this level could lead to a test of the previous top resistance at PKR 20-20.50.
If the stock breaks through this resistance with increased buying volume, the pattern's validity would be confirmed, with a potential target of PKR 27.
Disclaimer
This analysis is based on personal observation and should not be considered as investment advice. It is essential to evaluate the company's financial performance, monitor relevant news, and manage risk accordingly before making any investment decisions.

Haleon looks good to buyFresh buying is possible in Haleon, TP is 783, 812, 869 and 975.
SL is 711.
Note: This is not a buy/sell trade call.

Psx is in Bullish ZonePsx is above bearish zone and it is expected to cross 28.33 and 30.32 level.
SL is 23.26.
Note: This is not a buy/sell call.

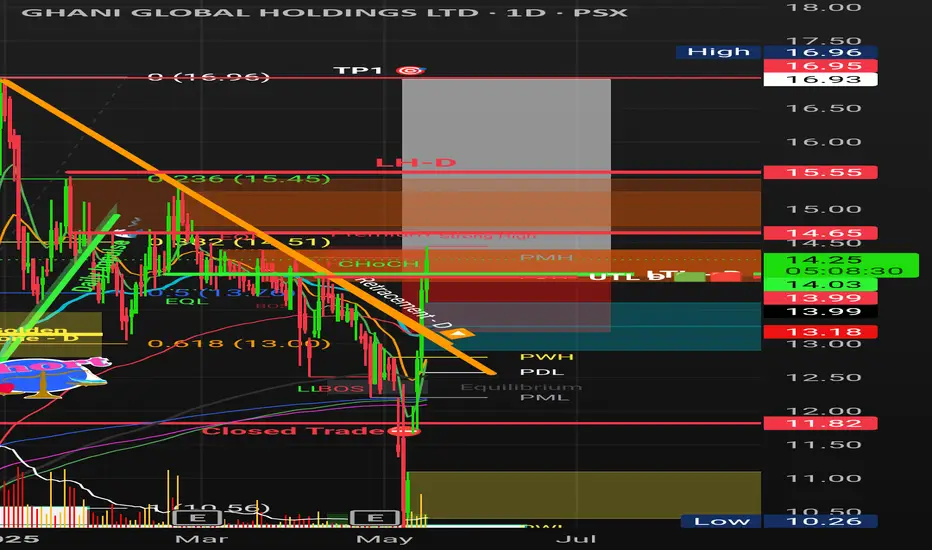
GGL BULLISHGGL dropped from 16.95 and made a low of 10.26 and now broke and vlosed above Daily Retracement Line and its further Target is 16.90
Bullish
GWLC is in Bullish ZoneGWLC is now above bearish zone and may be it will cross 45.3, 47.44 and 49.4 levels.
Stop loss 38.75
Note: This is not a buy/sell call.

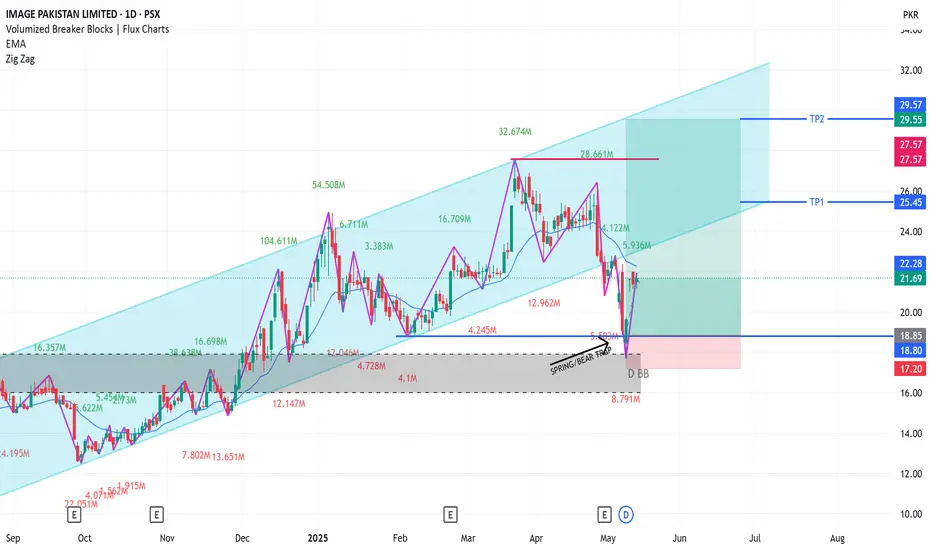
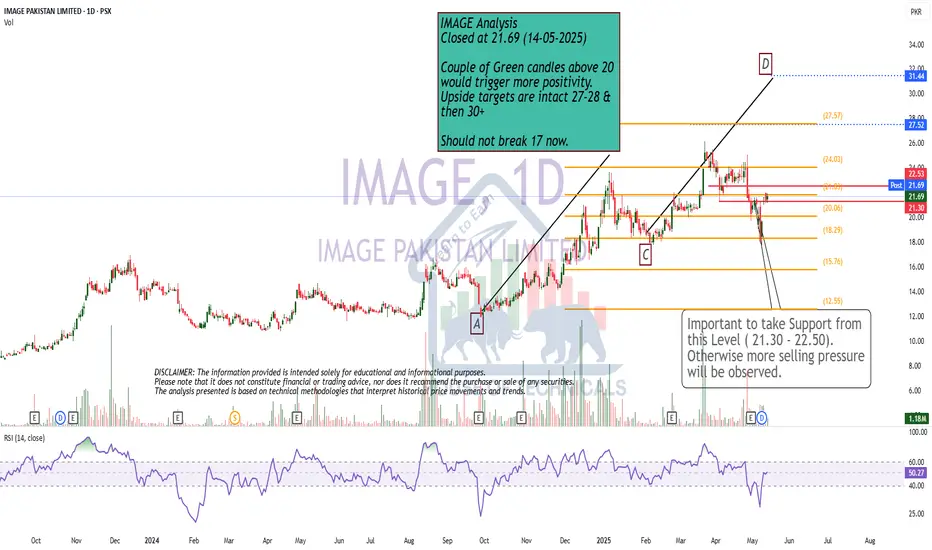
IMAGE LONG TRADEIMAGE has been trending in perfect uptrend channel.
Though it broke down from the channel but that behavior signifies impending bullish move for three reasons.
1. Price has created Spring or Bear Trap through its recent support level of 18.80 and rebound
sharply upwards in a Liquidity Sweep manner to shake off weak hands
2. Price also took support from major Bullish Breaker Block at 18
3. Wave Volumes support the impending up move
BUY IMAGE 19-22
TP1 25.50
TP2 29.50
SL 17.20
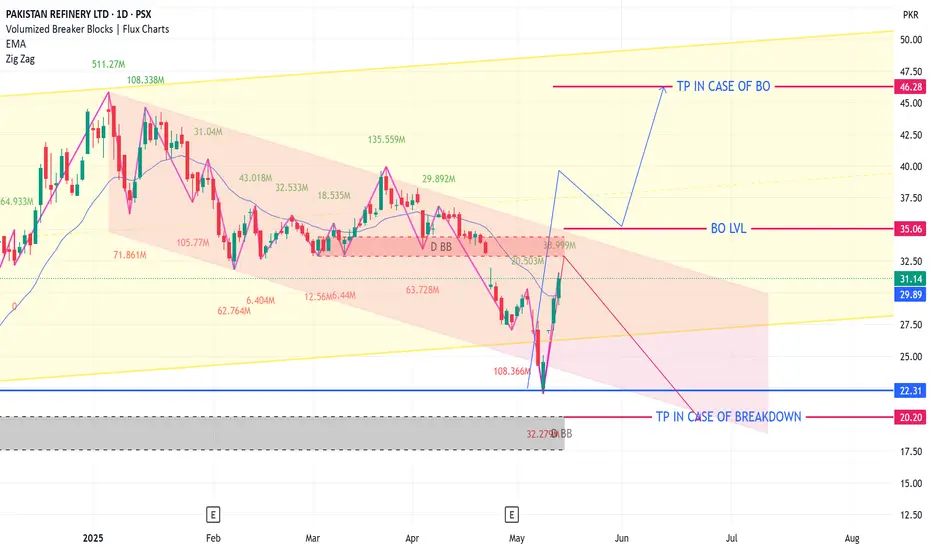
PRL ANALYSISThough PRL is trending in uptrend channel(yellow) in higher timeframe, presently it is in its down leg(pink channel), it has taken support from an important level of 22, it seems going towards higher end of Yellow channel or measured move after breakout from pink channel but there seem two main hurdles in this scenario, biggest is Bearish Breaker Block at 33 and others is still smaller volumes in its current rise from 22.
If PRL gets rejected from 33 then its downside target will be 20.
But on a brighter side if it manages to breakout from pink channel at 35 with heavy volumes only then can it go to target of measured move to 46 and yellow channel top 49
Conclusion: Don't buy at current levels before breakout at 35. In case of previous buying apply SL in case of rejection at 33
BFAGROAfter recent BREAKOUT BFAGRO has completed its pullback to the Breaker Block which caused the BO.
It's at perfect low risk level for a Long Trade
BUY BFAGRO 28.3-29
TP 32.2
SL BELOW 27

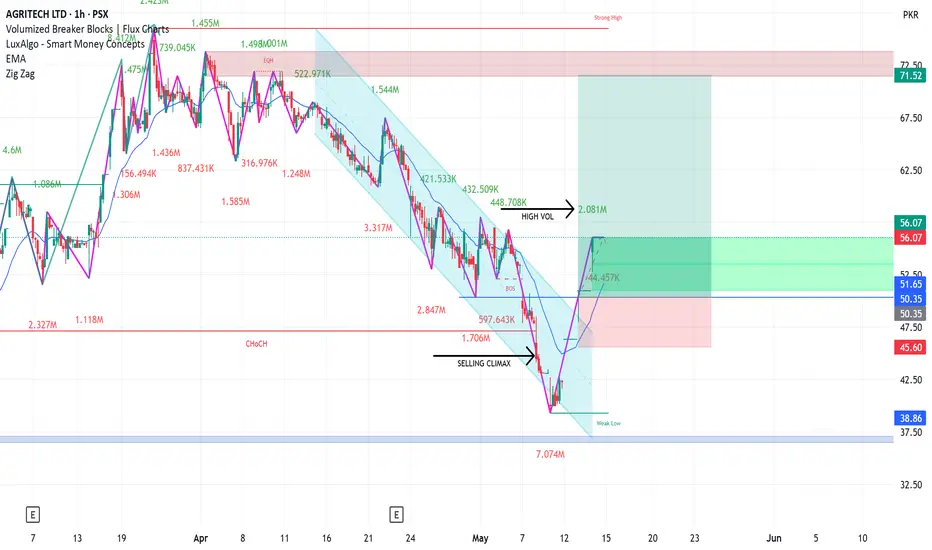
AGL LONG TRADEAGL was in downtrend since start of April.
It has completed three downward pushes which ended with Selling Climax
Selling Climax ensure transfer of possession from Weak Hands to Strong hands which results in rise of price or uptrend
AGL has also broken out of Bearish channel and 20 EMA with heavy volumes.
It can be bought at current price and also after pullback to Breakout.
BUY AGL 50-56
TP 72
SL 44
SEARLE LONG TRADESEARLE has been in downtrend since Dec 25, it has recently take support from a strong Breaker Block and also crossed over a bearish Breaker Block which is a sign of strength.
The downward Bear Channel is actually a Bull Flag as per Price Action Principles of Al Brooks the Father of Price Action.
Price went below this channel in shape of Selling Climax to dry out all Supply at those lower levels, this process has shifted the possession of Searle from Weak Hands to Strong Hands (Big Institutions). thus creating a Supply Vacuum.
Price has only logical direction to go and that's upwards.
BUY SEARLE 78-84
TP1 95
TP2 105
TP3 120
SL 70

BOP - PSX - Buy IdeaBuy BOP if it breaks above the resistance with a bullish candle. Place you Stop loss 9.15.
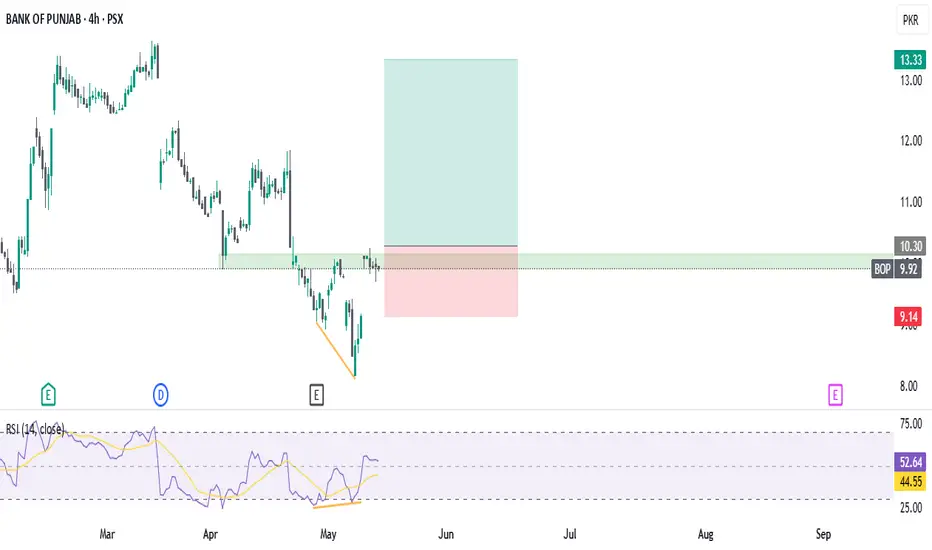

Bullish divergence is there but
Bullish divergence is there but
19-19.10 is Important to Sustain on
Monthly basis.
also there is a Very Important
Support around 16.30 - 17.20

ABCD still intact..Couple of Green candles above 20
would trigger more positivity.
Upside targets are intact 27-28 &
then 30+
Should not break 17 now.
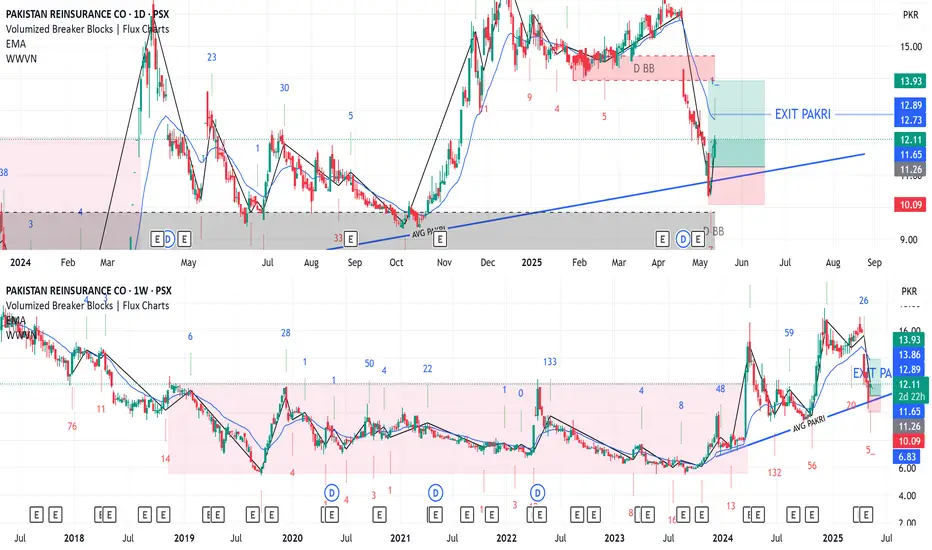
PAKRI LONG TRADEPAKRI broke out of its 07 years trading range in March 2025.
It is now trending in uptrend with a clear trendline.
In recent days it took support from this trendline and started new arm of its uptrend
Buy PAKRI 11-12
TP 14.0
SL 10.10
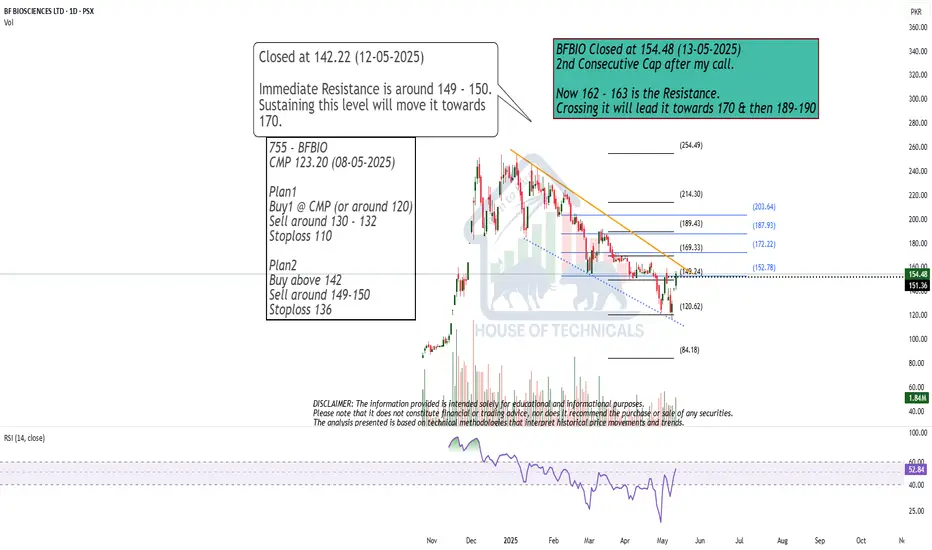
2nd Consecutive Cap after my call.
2nd Consecutive Cap after my call.
Now 162 - 163 is the Resistance.
Crossing it will lead it towards 170 & then 189-190
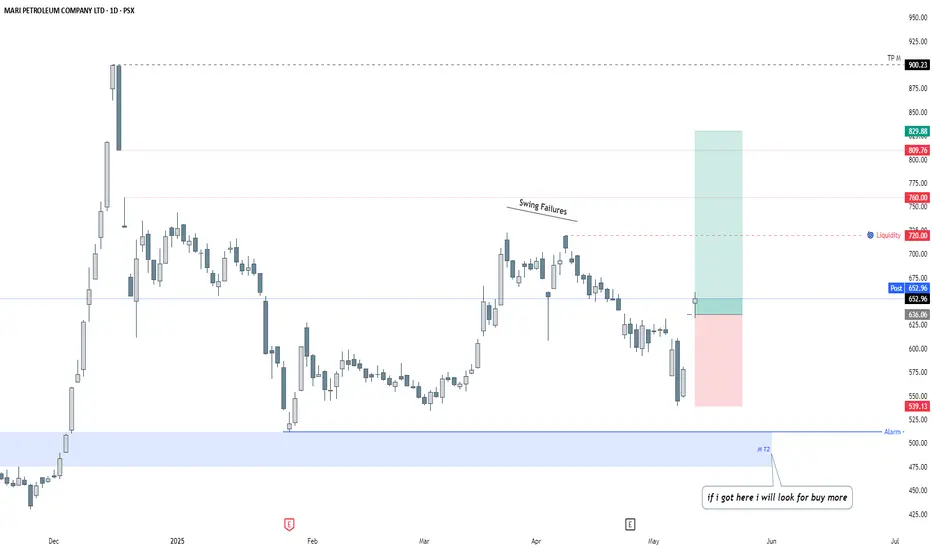
MARI Petroleum Company Ltd (PSX) Buy Idea✅ Buy Idea Summary
Symbol: MARI
Timeframe: Daily
Current Price: 652.96
📊 Analysis & Plan
Context:
Price has bounced from a higher-timeframe demand zone (highlighted in blue) and is currently forming a bullish structure.
Key Observations:
Swing Failure Pattern near top (distribution clue).
Liquidity Pool marked at 720 — likely target for short-term buy-side liquidity.
Strong bullish reaction after price tapped near the low of the previous range.
🛒 Entry:
At/around: 652.96 (Post price).
🎯 Target Levels:
TP1 (Partial/Intraday): 720 (Liquidity Zone)
TP2 (Major Target): 829.88
TP Final: 900.23
🛑 Stop Loss:
Below 539.13 (last swing low and structural invalidation)
📥 Reinforcement Buy Zone:
Blue Demand Area (around 460–500):
“If I got here, I will look to buy more.”
→ A key reaccumulation area if price revisits.
No Payout but..
Though NO PAYOUT, but Very Good Result.
If 31.50 is Sustained, we may witness 34-35
tomorrow.

Sazew is near to bearish zoneSazew is near breakdown level of 1297.87 (bearish zone). It is expected to drop to 1168.17. Stop loss is 1355
Note: This is not a buy/sell call, It is an analysis.

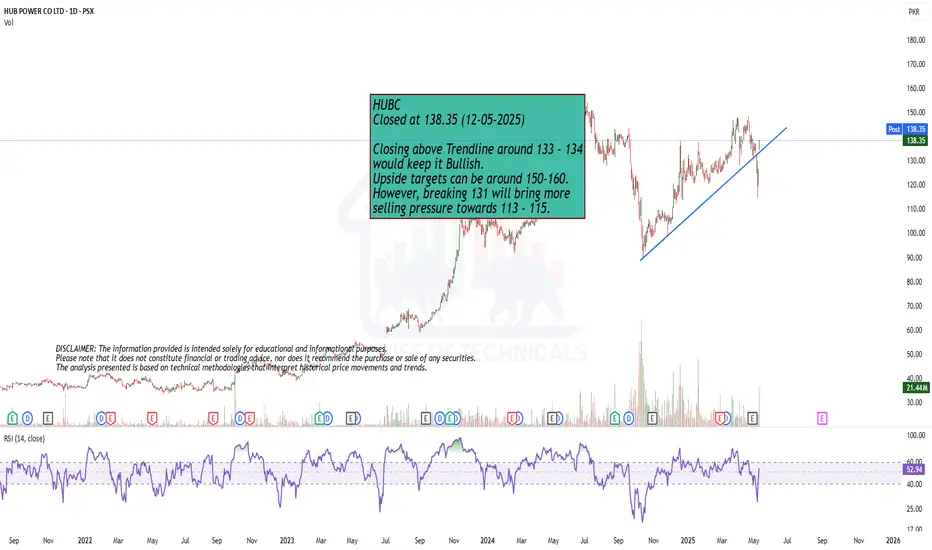
Bullish Momentum
Closing above Trendline around 133 - 134
would keep it Bullish.
Upside targets can be around 150-160.
However, breaking 131 will bring more
selling pressure towards 113 - 115.