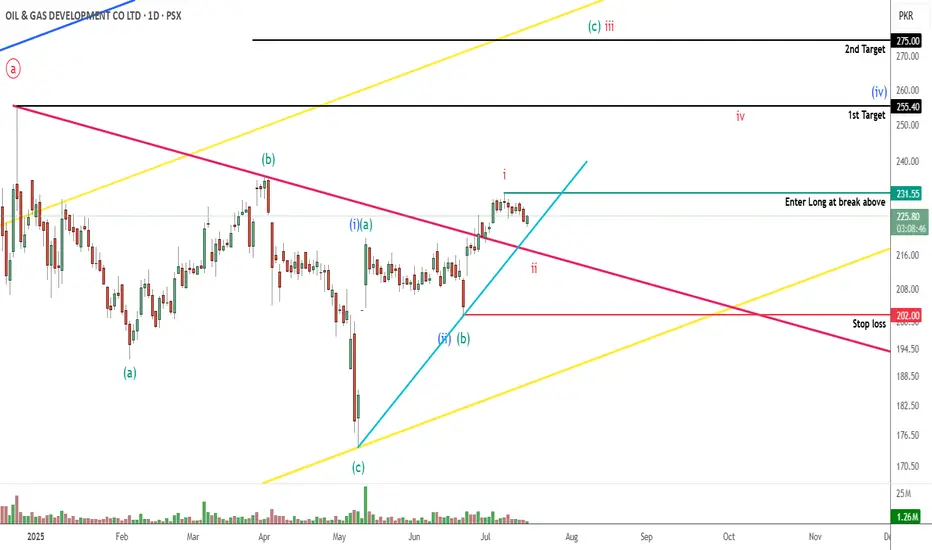
OGDC PROBABLY IN WAVE ' B ' OR ' C ' - LONGThis is in continuation to our ongoing tracking of OGDC wave structure.
If our wave count is correct then prices will take support from the 220-210 levels and will target the upside level of 255 and 275. Our wave count suggest that prices might even go above 300+ but that depends on how strong the bullish move is, if the move stays strong then price will target the upper yellow trendline.
Alternately, if price goes below the 202 level, it will take price well below 174.
We will buy 25% positions at 220-210 levels (ideally 218-216) and 75% at the break above 231.56
Trade Setup:
Entry level: 217 & 231.56
Stop loss: 202
Targets:
T1: 255
T2: 275
T3: Yellow trendline
Let see how this plays, Good Luck!
Disclaimer: The information presented in this wave analysis is intended solely for educational and informational purposes. It does not constitute financial or trading advice, nor should it be interpreted as a recommendation to buy or sell any securities.
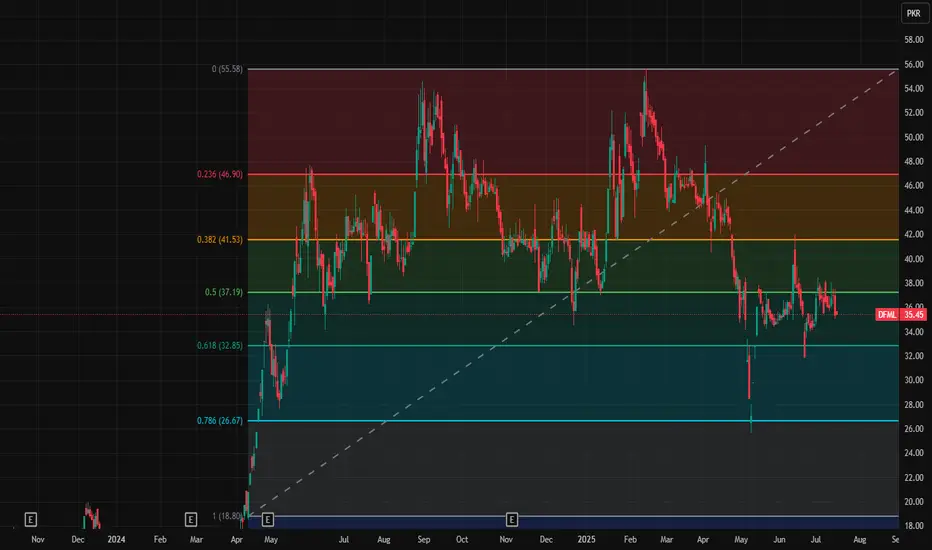
DFML Key LevelsThese are key levels of DFML
26.67, 32.85, 37.18, 41.53, 46.9 and 55.08
Note: This is not a buy/sell trade call, it is an analysis.
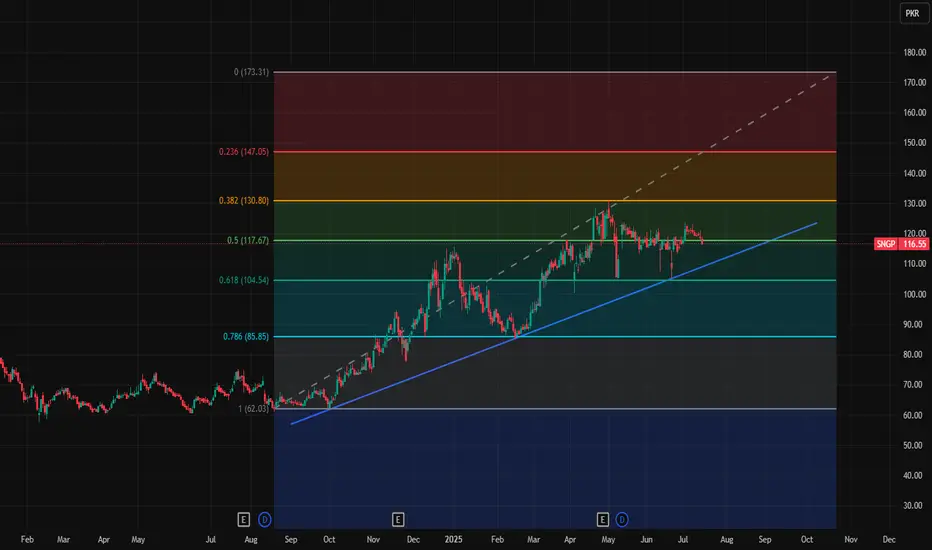
SNGP in long runThis is SNGP daily chart and blue trend line shows its positive movement and it is maintaining sustainable growth.
These are key levels 117.67, 130.8, 147.05 and 173.31
Note: This is not a buy/sell trade call, it is an analysis.
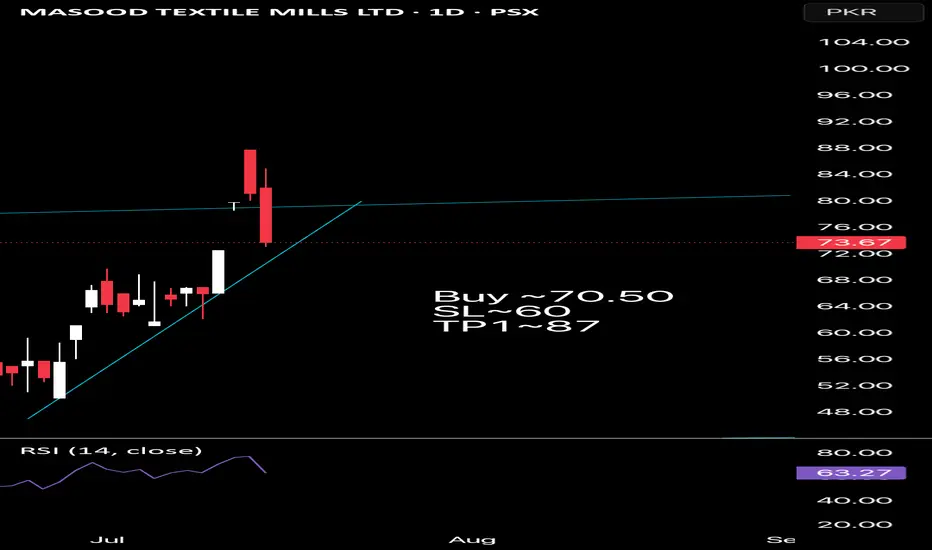
MSOT-Buy at current discounted priceSo seems it has broken the trendline and retraced...Filled the gap..So Buy~70.5, SL~60.50 TP1~87...And from thereon it can easily cross recent high

PPL PROBABLY IN WAVE '' C '' - LONGThis is in continuation to our ongoing tracking of PPL wave structure
PPL is most probably in wave C of a Y or B wave which will target areas of 200 and further up 230 - 250 level. Our ideal buy zone is at 165 - 160, however looking at the market momentum we might not get to our buy zone and prices will rise directly.
We will enter long positions once market breaks above 178 level (keep eye on the volume), although entering market at 178 will significantly effect our risk/reward ratio compared to entering at the buy zone of 165 - 160, either ways we will take long positions.
Alternately, if the prices decline below 151.30 then this trade setup will get void, 151.25 can be used as stop loss.
Trade setup:
Entry price: 165 - 160 (Ideal) or 178
Stop loss: We are bullish on PPL long term therefore we will hold these positions
Targets:
T1: 198 - 200
T2: 230 - 250
Let see how this plays, Good Luck!
Disclaimer: The information presented in this wave analysis is intended solely for educational and informational purposes. It does not constitute financial or trading advice, nor should it be interpreted as a recommendation to buy or sell any securities.

LOTCHEM PROBABLY IN WAVE ' X ' OR ' Y ' OF A CORRECTIONAs per our preferred wave count LOTCHEM is in wave Y which should take prices further down toward the 13 level and if bearish trend stays strong then even 9.50 is on the cards, however prices need to break below 15.53 level first.
Alternately prices can still be in X wave and will take prices further up towards 25.40 - 27.40 range and if the bullish trend stays strong 31 level is also at hand, however prices will have to break above 20.20 level first.
As the overall momentum of the PSX is bearish and our preferred wave count is bearish, We will activate short sell trade once price close below the red trendline on the daily chart.
Incase prices never close below the red trendline and starts rising, We will enter long position at 20.20 targeting 25.40 range. I will share stop loss for the trade setup once our trade gets actived
Let see how this plays, Good Luck!
Disclaimer: The information presented in this wave analysis is intended solely for educational and informational purposes. It does not constitute financial or trading advice, nor should it be interpreted as a recommendation to buy or sell any securities.

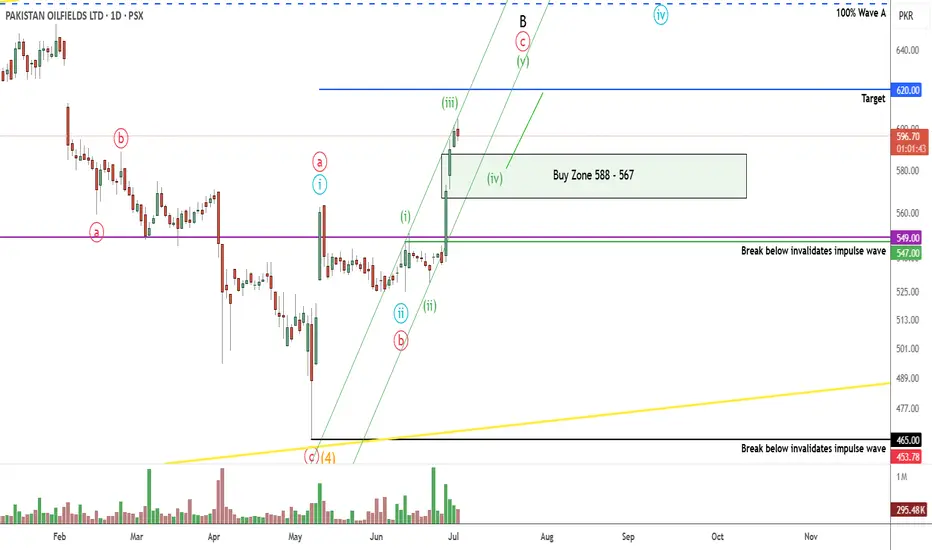
POL PROBABLY IN WAVE '' C '' OR " 3 " - LONGThis is in continuation of our ongoing tracking of POL wave structure.
POL is currently in C or 3 which will target the 620-623 or 680 level. Our preferred wave count is C and we will target the 620 level. If our wave count is correct then prices will decline to our buy zone of 588-567 range as wave 4.
Alternately prices will never go to our buy zone and will reach the 620 - 623 level directly making this trade setup as void.
We will buy in portions at 588 > 580 > 576 level
Trade setup:
Entry price: 588 - 567
Stop loss: 547
Targets: 620 - 623
Let see how this plays, Good Luck!
Disclaimer: The information presented in this wave analysis is intended solely for educational and informational purposes. It does not constitute financial or trading advice, nor should it be interpreted as a recommendation to buy or sell any securities.
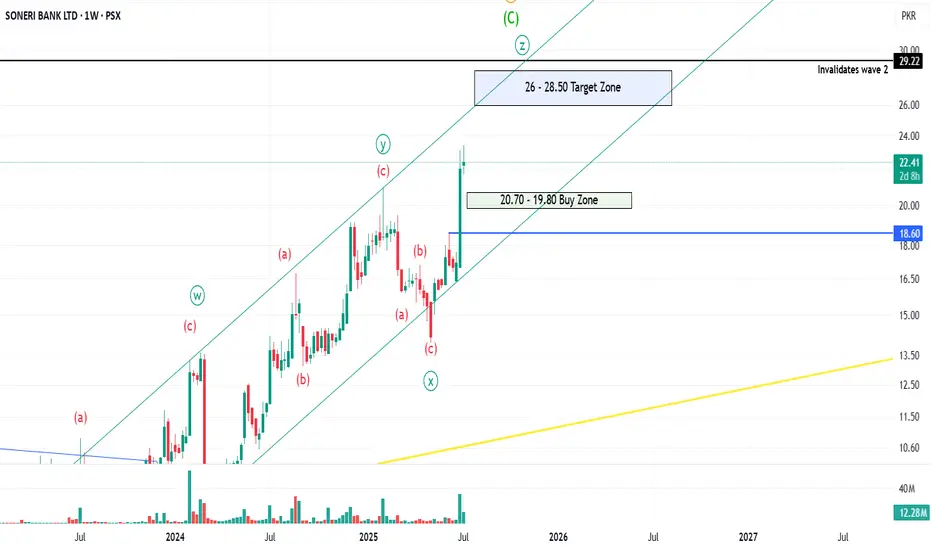
SNBL PROBABLY IN WAVE ' Z ' OF B or CThis is in continuation of our ongoing tracking of SNBL wave structure, prices have broken above the 22.50 level indicating one more leg upwards.
Currently the price is unfolding as wave Z which will target 26 - 28.50 zone, however the prices should decline towards the 20.70 - 19.80 level (buy zone) before rising again.
If the prices go below the 18.60 level, it will significantly weaken this wave count. we will only activate this trade if price reach our buy zone.
If the wave count is correct then this trade will provide us minimum 25.60% gross gain.
Trade Setup:
Entry level: 20.70 - 19.80
Stop loss: 18.59
Target: 26 - 28.50
Let see how this plays, Good Luck!
Disclaimer: The information presented in this wave analysis is intended solely for educational and informational purposes. It does not constitute financial or trading advice, nor should it be interpreted as a recommendation to buy or sell any securities.
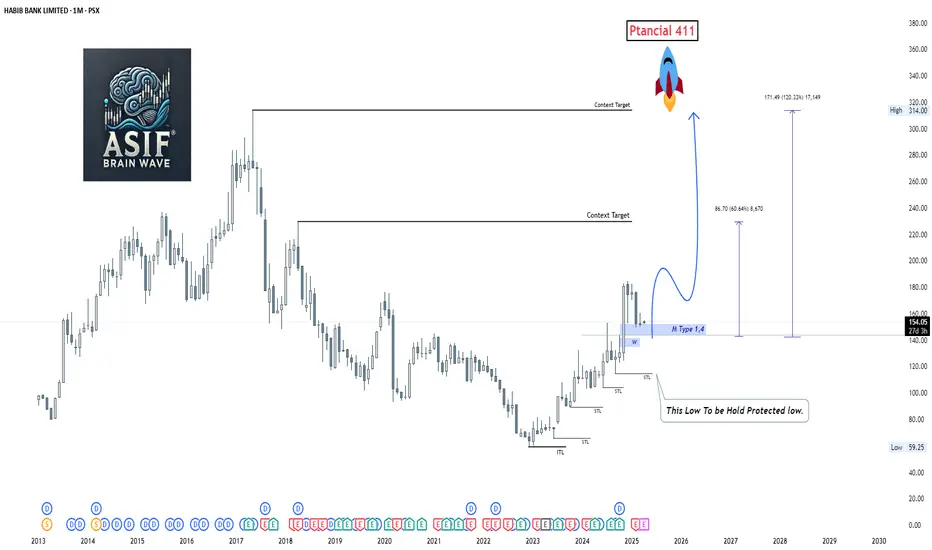
Buy Idea: Habib Bank Limited (HBL)📘 Buy Idea: Habib Bank Limited (HBL)
🔹 Timeframe: Monthly | Strategy: Structure + Type 1.4 + Context Targets
✅ Entry Zone:
Buy between 145 – 155 PKR (near the marked "M Type 1.4" level).
📉 Stop Loss (SL):
Below 92 PKR
("This low to be held as protected low" – the ITL zone).
🎯 Take-Profit Targets (TP):
Target Price (PKR) Gain % Description
TP1 240 ~60% First context target
TP2 314 ~120% Previous major high
TP3 411 ~165% Final potential rocket move 🚀
📌 Context & Narrative:
Price broke key structure levels and is forming a bullish base.
Multiple STL levels swept – shows smart money accumulation.
"M Type 1.4" indicates institutional interest.
Targets are based on historical price action and FVG-based projection.
💡 Position Strategy:
Buy 50% at current price (150–155)
Add 25% on a pullback to 140
Add 25% if price dips toward 130
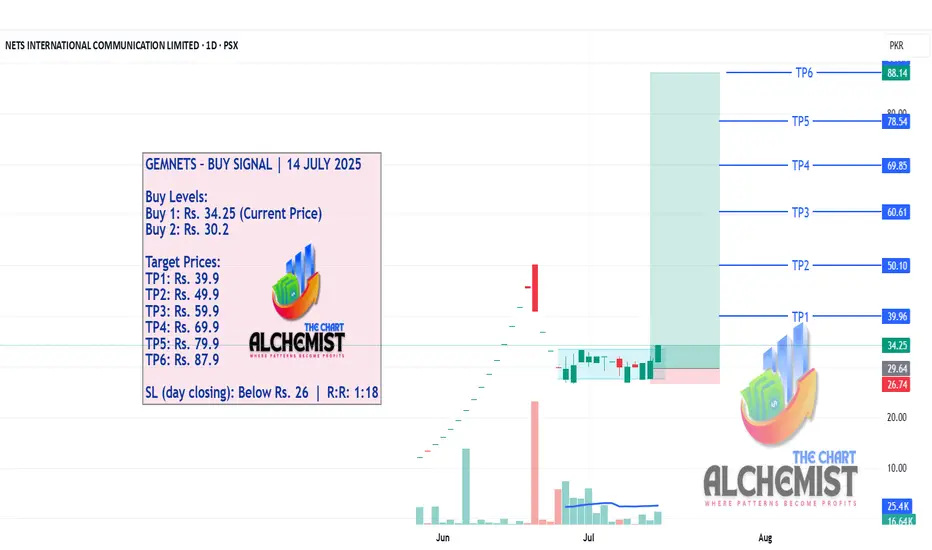
GEMNETS – BUY SIGNAL | 14 JULY 2025GEMNETS – BUY SIGNAL | 14 JULY 2025
After a strong move from Rs. 12 to Rs. 20, GEMNETS entered a pullback phase, which has now transformed into a bullish flag and reaccumulation zone — a powerful structure setting up for another leg higher.
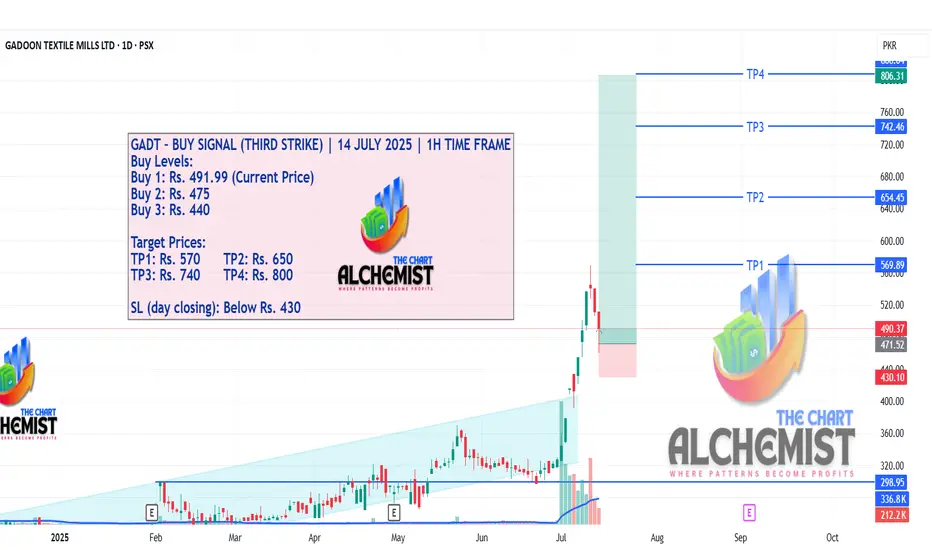
GADT – BUY SIGNAL (THIRD STRIKE) | 14 JULY 2025 | 1H TIME FRAMEGADT – BUY SIGNAL (THIRD STRIKE) | 14 JULY 2025 | 1H TIME FRAME
After breaking out of a slightly upsloping trading range (marked in light blue) and achieving a high of Rs. 570, GADT pulled back. With the pullback nearly complete, we expect a bounce and a run toward multiple quantified displacement targets.
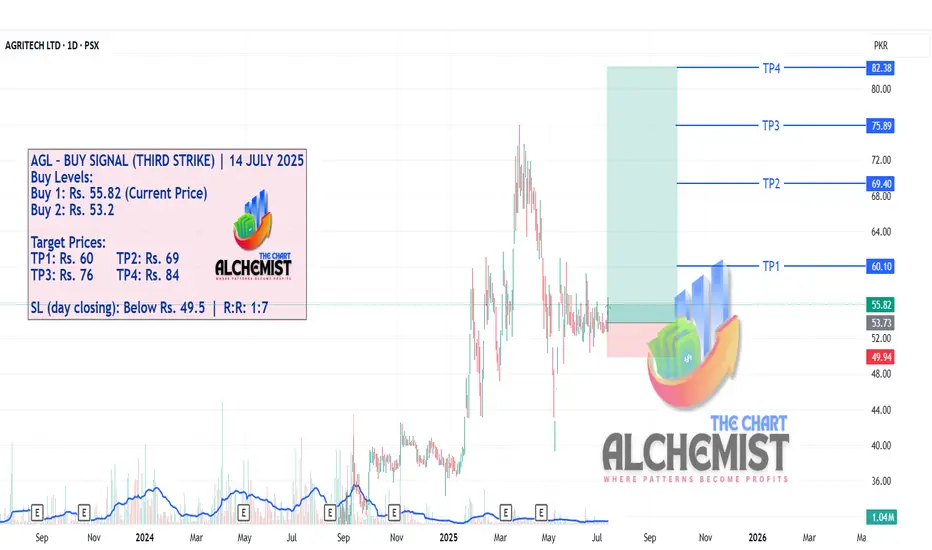
AGL – BUY SIGNAL (THIRD STRIKE) | 14 JULY 2025AGL – BUY SIGNAL (THIRD STRIKE) | 14 JULY 2025
After achieving a high of Rs. 75 and correcting into a selling climax, AGL reversed sharply and entered a sideways accumulation. Recent price action now suggests the stock is poised to move upward.
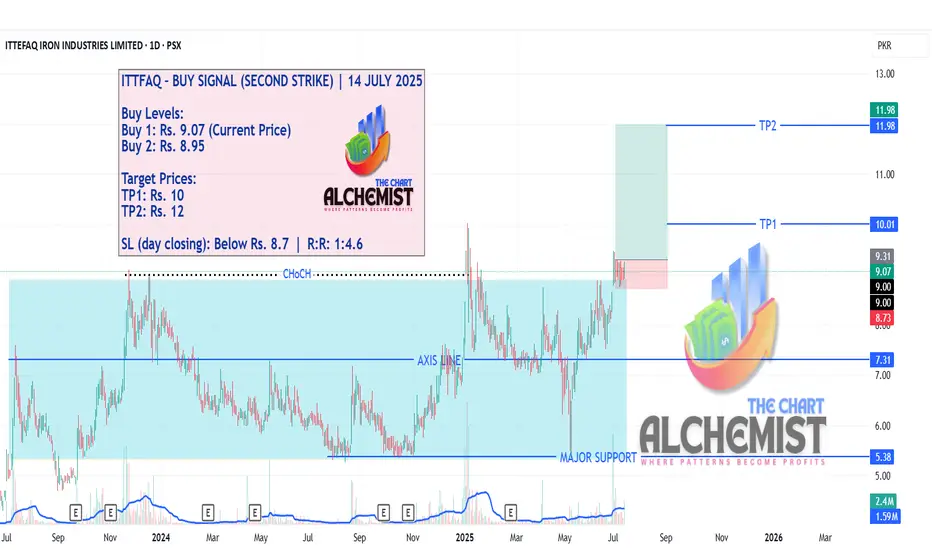
ITTFAQ – BUY SIGNAL (SECOND STRIKE) | 14 JULY 2025ITTFAQ – BUY SIGNAL (SECOND STRIKE) | 14 JULY 2025
Given the recent formation of a bullish structure, we're revising both buy and stop loss levels to reflect the current opportunity.
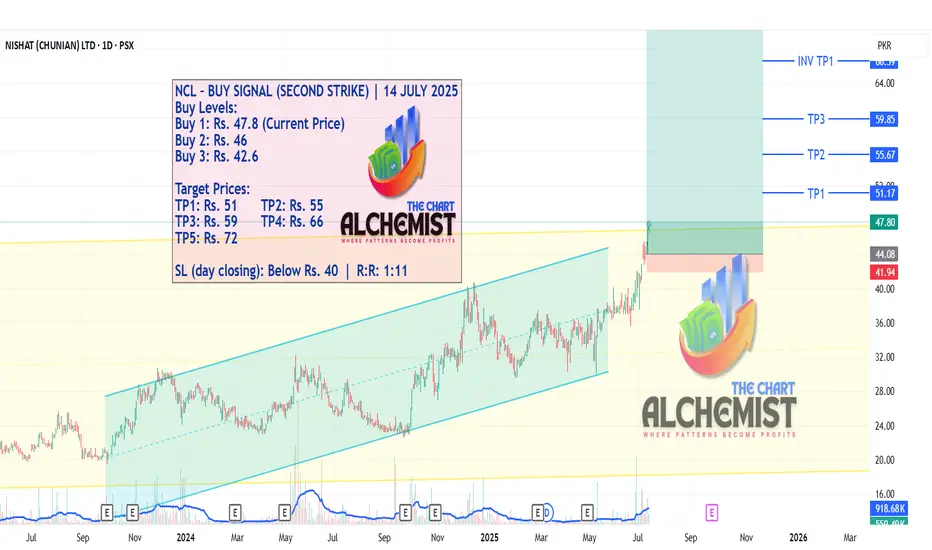
NCL – BUY SIGNAL (SECOND STRIKE) | 14 JULY 2025NCL – BUY SIGNAL (SECOND STRIKE) | 14 JULY 2025
After a successful first strike that achieved all targets, NCL has now broken out of consolidation zones on both higher (yellow) and shorter (light blue) time frames. This setup presents a strong second strike opportunity.
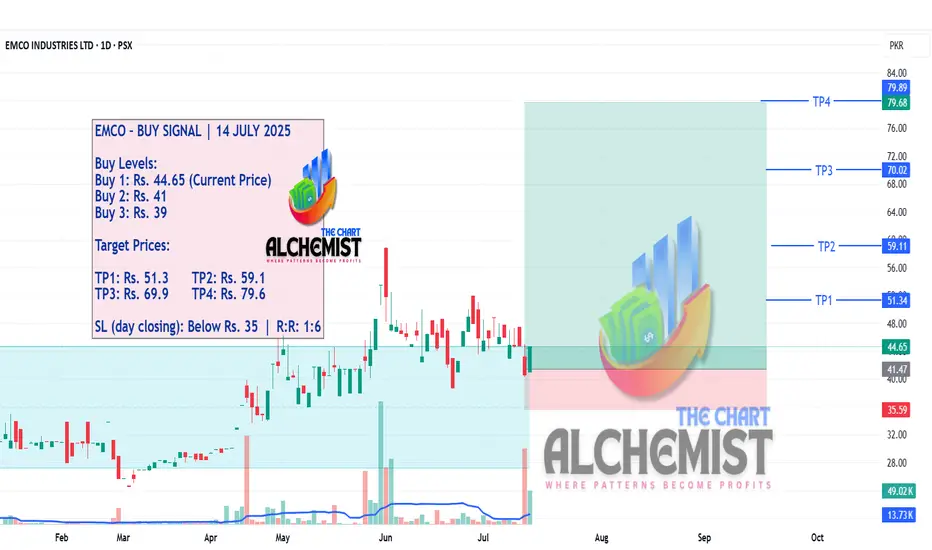
EMCO – BUY SIGNAL | 14 JULY 2025EMCO – BUY SIGNAL | 14 JULY 2025
After breaking out of a trading range (light blue channel) and achieving a high of Rs. 59, EMCO completed its pullback and retest phase, positioning itself for upward movement.
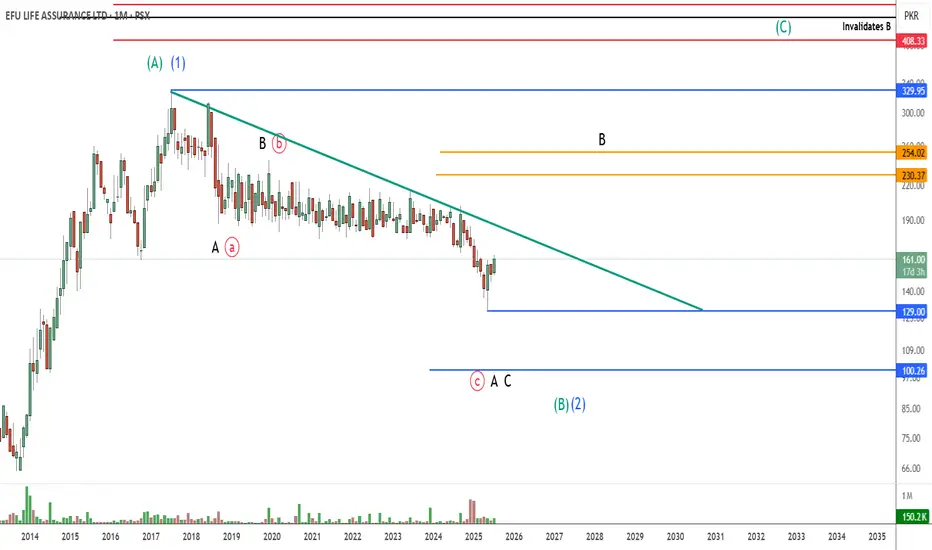
EFUL PROBABLY IN WAVE ' C ' OR ' 3 ' - LONGEFUL is most probably in wave C or 3
We are long term investor on this trade as the overall fundamentals are strong and the long term risk/reward ratio for this trade is very attractive.
Currently the price is in a lesser degree wave C which is almost finished or will finish soon starting an upside rally. If our wave count is correct then the lesser degree wave C is over and the bigger wave C or 3 has just started which will take prices toward 450 levels or even further up above 550 levels but this trade can take years to complete.
There's also a possibility that the lesser degree wave C is still in progress and will take prices further down towards 120 - 100 levels which will make this a more attractive buy trade.
Alternate wave count suggest of a wave B which will also take prices upward, however the target levels will change significantly i.e. 230 - 250 levels
We are already active in this trade and will accumulate more positions in EFUL if prices go below toward 120-100 levels
Let see how this plays, Good Luck!
Disclaimer: The information presented in this wave analysis is intended solely for educational and informational purposes. It does not constitute financial or trading advice, nor should it be interpreted as a recommendation to buy or sell any securities.
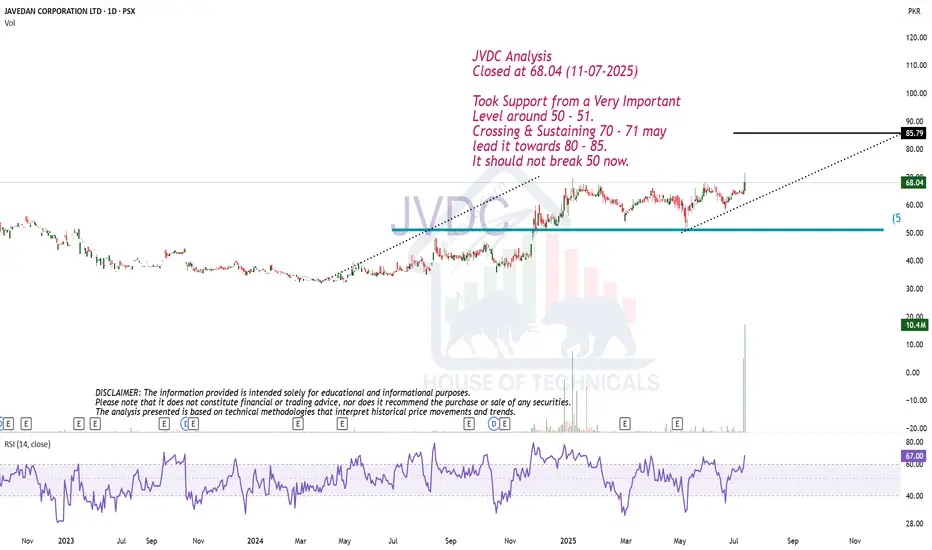
ABCD Possible.JVDC Analysis
Closed at 68.04 (11-07-2025)
Took Support from a Very Important
Level around 50 - 51.
Crossing & Sustaining 70 - 71 may
lead it towards 80 - 85.
It should not break 50 now.
EPQL - Swing Trade SetupThe current price action is testing the support of an ascending parallel channel. A potential pullback from the 26 level, which aligns with the channel's support, is anticipated. If the price rebounds from this level, a swing trade setup could be confirmed, with a possible target of 38.
However, the MACD indicator has recently crossed over to the downside on weekly time frame, with red histograms forming. To confirm a more reliable entry point, we will await a reversal signal from the MACD indicator.

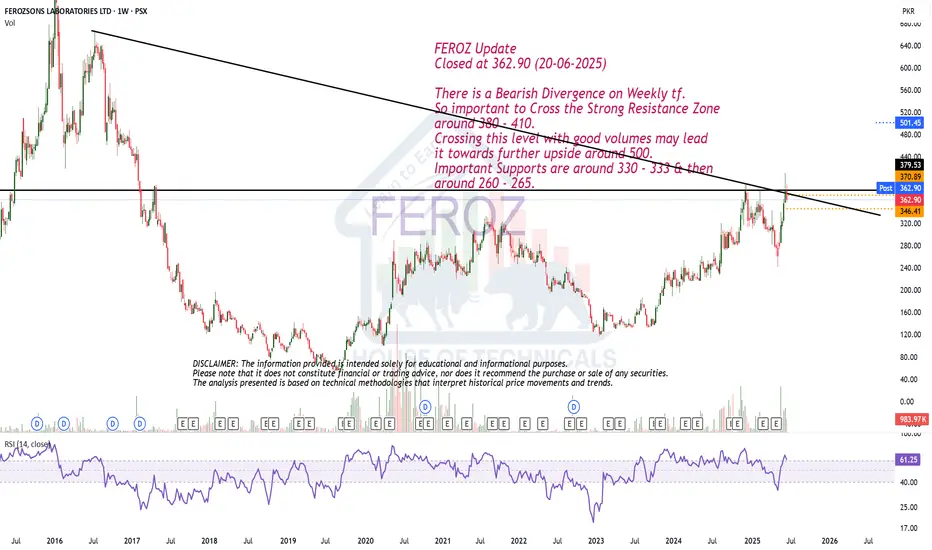
Bearish Divergence on Weekly tf.FEROZ Update
Closed at 362.90 (20-06-2025)
There is a Bearish Divergence on Weekly tf.
So important to Cross the Strong Resistance Zone
around 380 - 410.
Crossing this level with good volumes may lead
it towards further upside around 500.
Important Supports are around 330 - 333 & then
around 260 - 265.
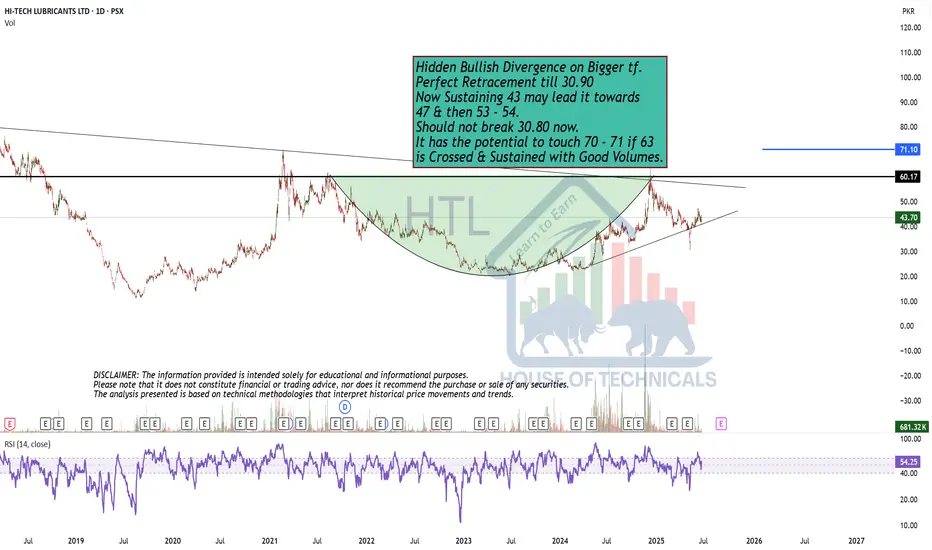
Perfect Retracement till 30.90Hidden Bullish Divergence on Bigger tf.
Perfect Retracement till 30.90
Now Sustaining 43 may lead it towards
47 & then 53 - 54.
Should not break 30.80 now.
It has the potential to touch 70 - 71 if 63
is Crossed & Sustained with Good Volumes.
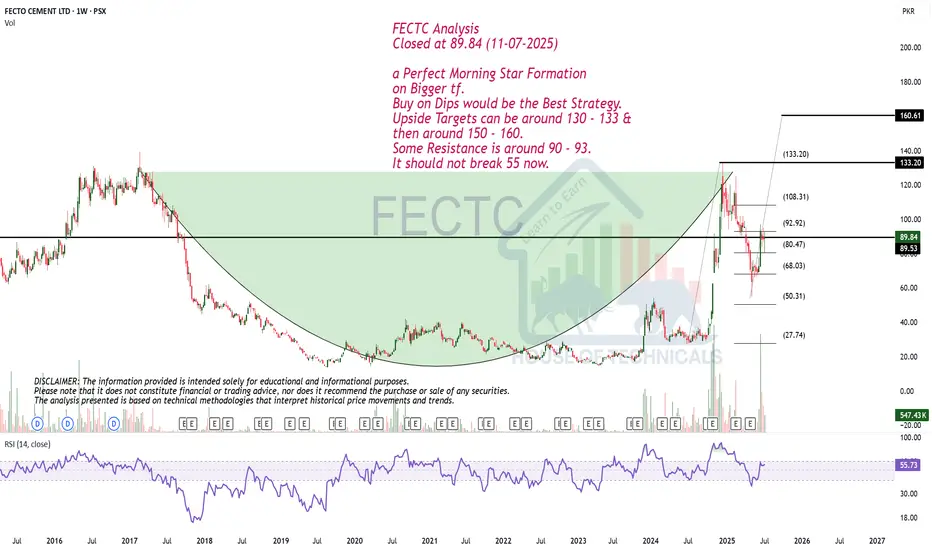
a Perfect Morning Star Formation on Bigger tf.FECTC Analysis
Closed at 89.84 (11-07-2025)
a Perfect Morning Star Formation
on Bigger tf.
Buy on Dips would be the Best Strategy.
Upside Targets can be around 130 - 133 &
then around 150 - 160.
Some Resistance is around 90 - 93.
It should not break 55 now.
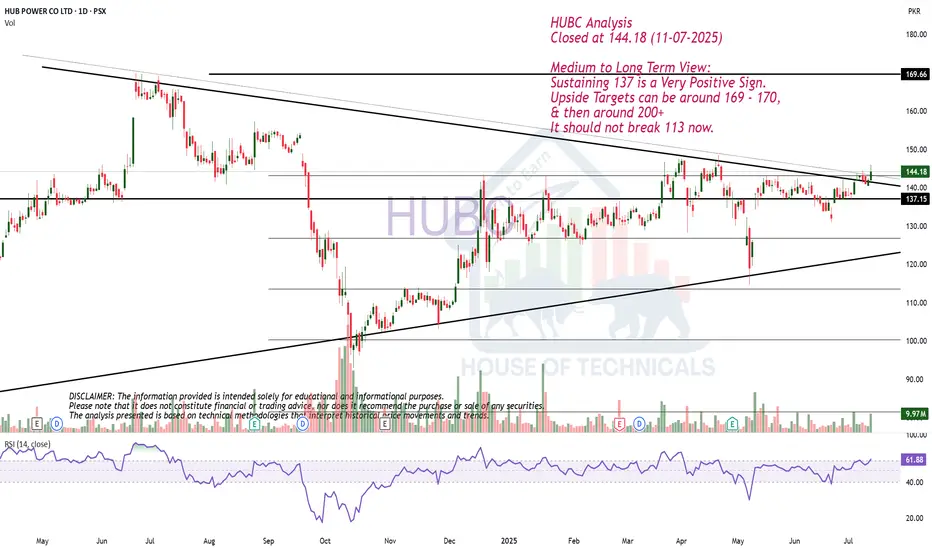
Medium to Long Term View.HUBC Analysis
Closed at 144.18 (11-07-2025)
Medium to Long Term View:
Sustaining 137 is a Very Positive Sign.
Upside Targets can be around 169 - 170,
& then around 200+
It should not break 113 now.