Still Positive
Immediate Resistance is around 149 - 150.
Sustaining this level will move it towards
170.

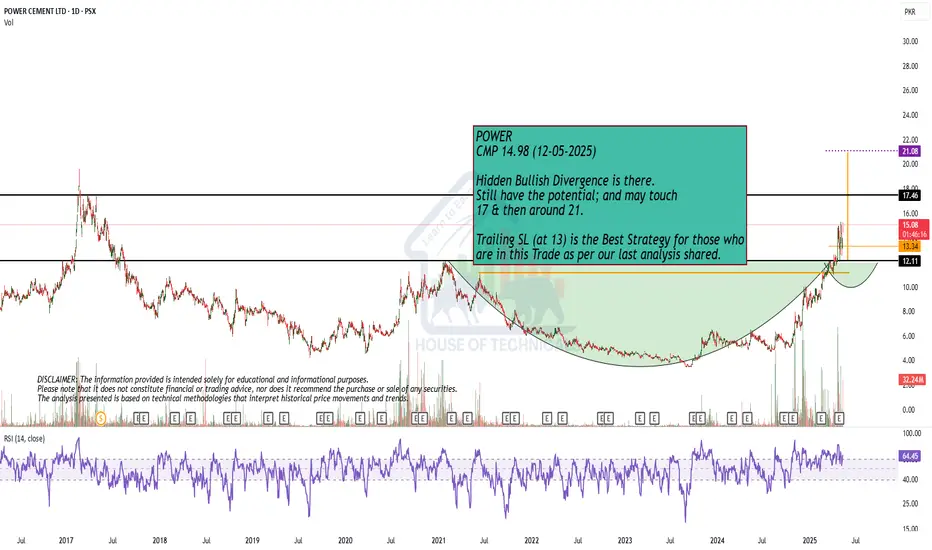
Hidden Bullish Divergence
Hidden Bullish Divergence is there.
Still have the potential; and may touch
17 & then around 21.
Trailing SL (at 13) is the Best Strategy for those who
are in this Trade as per our last analysis shared.
LONG INILLonged INIL. Bought spot shares. Broken out of range. Should take a while to play out as I am trading mostly on weekly and monthly charts. Entry, Stop Loss and Exit all there. Worth a punt!
Will update in due time as we go forward.
Manage your risk! #DYOR

AKBL PROBABLY IN WAVE " B " or " C/3 " SHORTAKBL is most probably in wave C or 3 which has started or is still in wave B.
As per our preferred wave count AKBL is in wave C or 3 which has started to unfold and will take the price down towards 26 - 24 range. We are already active in this trade aggressively, however the cautious way to trade this setup is to wait for a break below 33.40.
Alternately, there is a possibility that we are still in wave B which can unfold with sideward movement or a break above 44.99.
This setup will get invalidated once price break above 42.72.
Trade setup:
Entry price: 38.01
Stop loss: 42.72
Targets:
T1: 26 - 25.80 range
T2: 24.30 - 22.90 range
Let see how this plays, Good Luck!
Disclaimer: The information presented in this wave analysis is intended solely for educational and informational purposes. It does not constitute financial or trading advice, nor should it be interpreted as a recommendation to buy or sell any securities.

EFERTTrend is Bulish price retrace at fib level 0.618% with Bulish divergence
target price last High
Buy 162
Stop Loss 134
TP 246
RRR 1:3

AVNbuy 41
Stop Loss 35
TP 53
Buy at stronge support with Bulish Divergence at RSI also Green candle close.

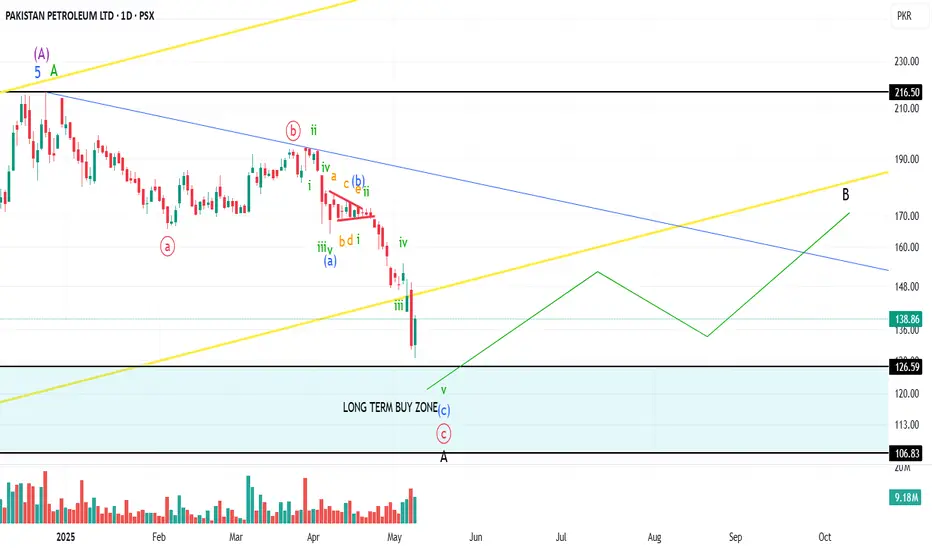
PPL PROBABLY IN WAVE '' A '' OR " B " - LONGThis is in continuation to our previous published idea in which we decided not to take buy positions due to developing geopolitical tensions which luckily was a wise decision. Now since the tensions have eased up and the bail out have been approved, the bullish scenarios have opened up again.
PPL is most probably in wave C of an A or B wave which is about to get completed. Our preferred wave count suggest that we should get one more leg down towards 124-106 range marking the end of the downtrend.
Alternately, if the prices start to rise and do not go below 128.56 and takes out 155, we will mark this C wave as completed.
Trade setup:
Entry price: 124-106
Stop loss: We are bullish on PPL long term therefore we will hold these positions
Targets: will update later once price reach our buy zone
Let see how this plays, Good Luck!
Disclaimer: The information presented in this wave analysis is intended solely for educational and informational purposes. It does not constitute financial or trading advice, nor should it be interpreted as a recommendation to buy or sell any securities.
TRG LONG TRADETRG was in BULL RUN since March 2020 to April 21, it is trending in bullish channel since 2020, it has now bottomed out in this channel as seen in 1W chart at bottom.
As seen in 1D chart it has given bullish reversal on heavy volumes on upward leg and much lighter volume on downward pullback, furthermore it has successfully created an Spring or Bear Trap which is precursor to up move.
Price Action also suggests an impending uptrend since the pullback is in the form of Bear wedge which is in fact a Bull Flag that has completed its three pushes on downside. It also confirms the take off to upside
BUY TRG 56-60
TP1 69.5
TP2 82.5
SL 51.1
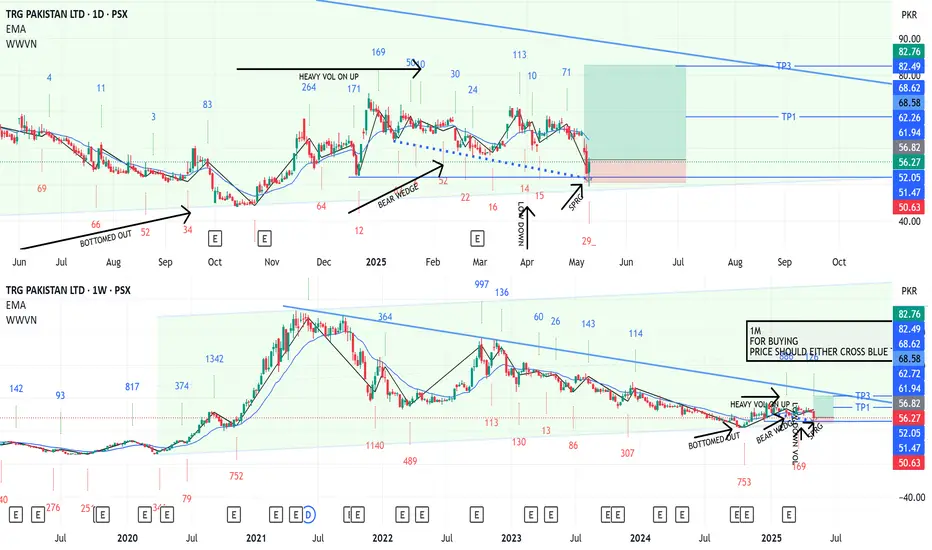
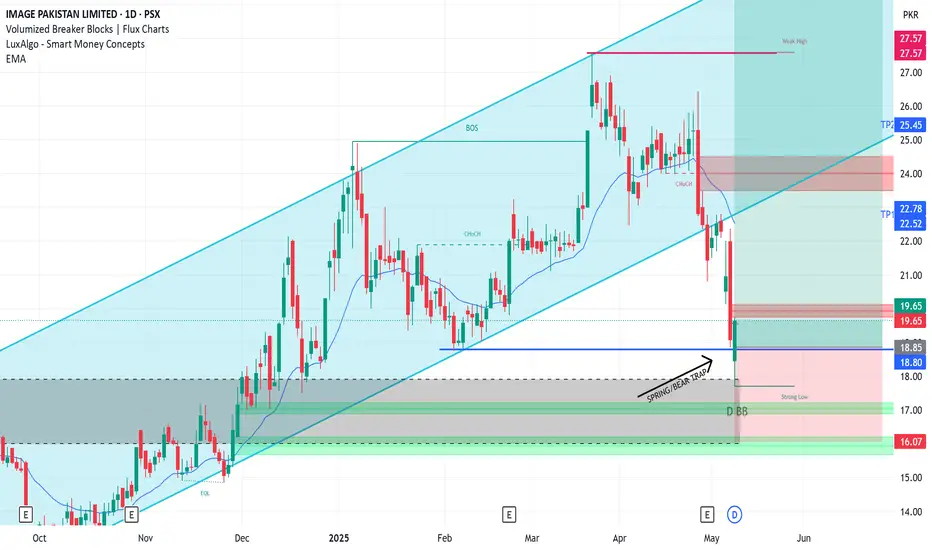
IMAGE LONG TRADEIMAGE is in upward trend, it has completed ABC corrective move and a Bear Trap on 9/5/25.
This bear trap/spring highly suggests start of final upward leg of the scrip before major correction after testing/exceeding recent highs
BUY IMAGE 18-20
TP1 22.8
TP2 25.5
TP3 29.5
SL 16
SAZEW LONG TRADESAZEW is in re-accumulation phase which is evident from its VOLUME WAVES. It is expected to test and exceed recent highs.
BUY SAZEW 1130-1210
TP1 1360
TP2 1400
TP3 1500
SL 1060

BFAGROBFAGRO previously broke of structure at 30 as marked on chart, it is consolidation phase after that BO. It is expected to test recent highs and then continue its upward trajectory even above 35
BUY BFAGRO 24-27
TP1 29
TP2 34.7
TP3 trail SL till stopped out
SL 22.5

CSAP LONG TRADECSAP went through re-accumulation phase as per Wyckoff Methodology from 21/04/24 to 21/4/25. It, then broke out of this zone and is now re-resting the Order Block which caused the Break Out.
Buy CSAP 100-110
TP1 139
TP2 159
SL 88

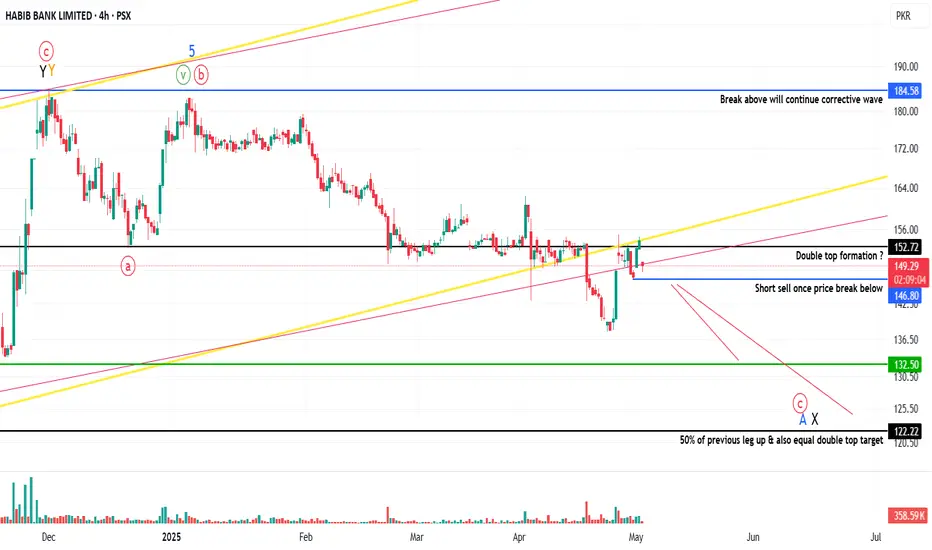
HBL PROBABLY IN WAVE '' C '' OR " X " - SHORTThis is in continuation of our HBL wave count/idea shared earlier.
HBL is most probably in wave C or X which will take price down towards 127-122 range area,
prices are currently at a resistance level which has acted as a strong support previously therefore we are confident that it should hold and keep prices from climbing up.
We will short sell HBL once price break below 146.80 level and will target 133-130 range and further down 124-122 range, however prices might reach 160 before starting its decline. Alternately if prices break above 163 then this trade setup will get invalidated.
Although the risk/reward ratio is not that impressive but looking at the overall stock market momentum and geopolitical unrest, we have a little more confidence in this trade.
Trade setup:
Entry price: 146.80
Stop loss: 163
Targets:
T1: 133-130
T2: 124-122
Let see how this plays, Good Luck!
Disclaimer: The information presented in this wave analysis is intended solely for educational and informational purposes. It does not constitute financial or trading advice, nor should it be interpreted as a recommendation to buy or sell any securities.
Play on Levels
Plan1
Buy around 118 - 121
Sell around 130 - 132
Stoploss 110
Plan2
Buy above 142
Sell around 149-150
Stoploss 136

LONG MUGHALLonged MUGHAL. Bought spot shares, no leverage. Resting above weekly support, broken down trend. Entry, Stop Loss and Exit all there. Will take a while to play out. Patience is always rewarded. Worth a punt!
Will update in due time.
Manage your risk! #DYOR

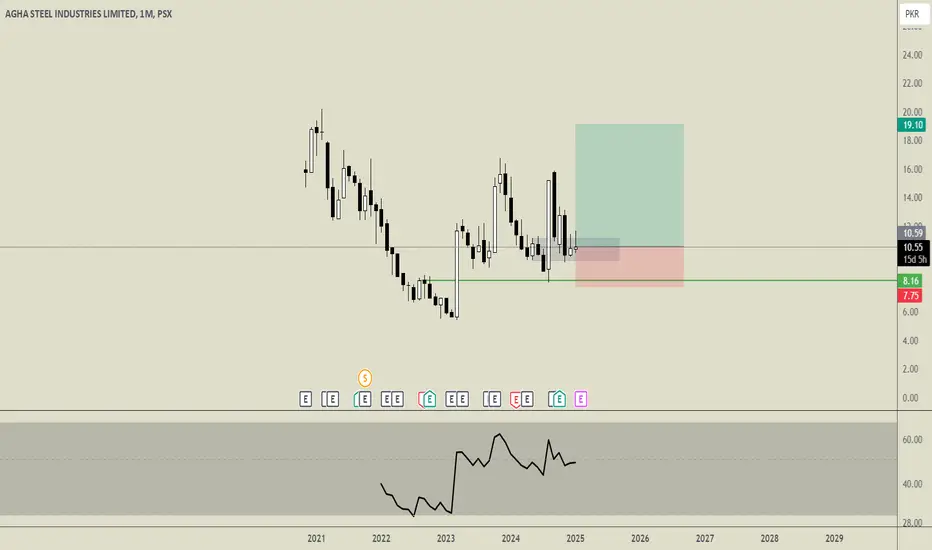
LONG AGHALonged AGHA. Bought spot shares, no leverage. Resting above monthly support. Entry, Stop Loss and Exit all there. Will take a while to play out. Nice reaction in august of that monthly support. Should hold for uptrend to continue. Patience is always rewarded. Worth a punt!
Will update in due time.
Manage your risk! #DYOR
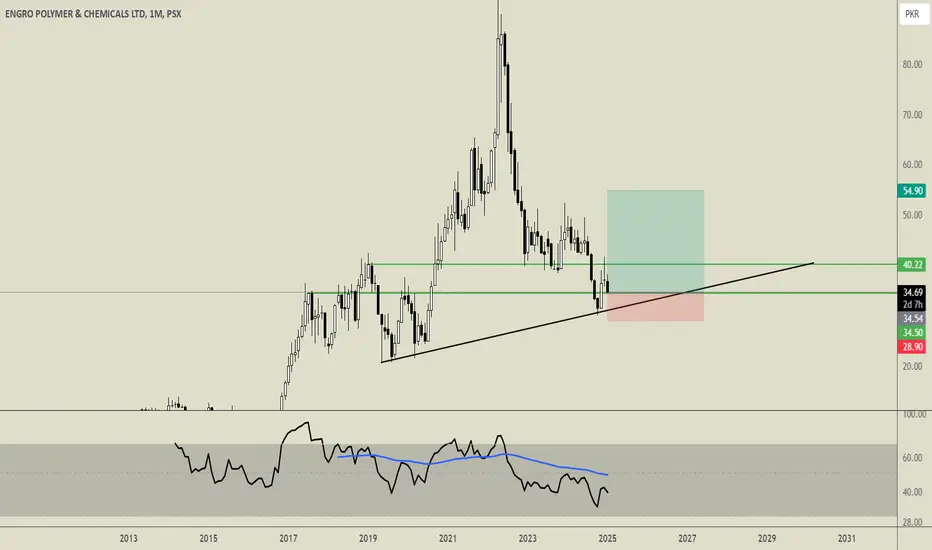
LONG EPCLLonged EPCL. Bought spot shares, no leverage. Resting above monthly support. Entry, Stop Loss and Exit all there. If it claims back above 40, it should be the new support and it should run then imo. Will take a while to play out. Patience is always rewarded. Worth a punt!
Will update in due time.
Manage your risk! #DYOR
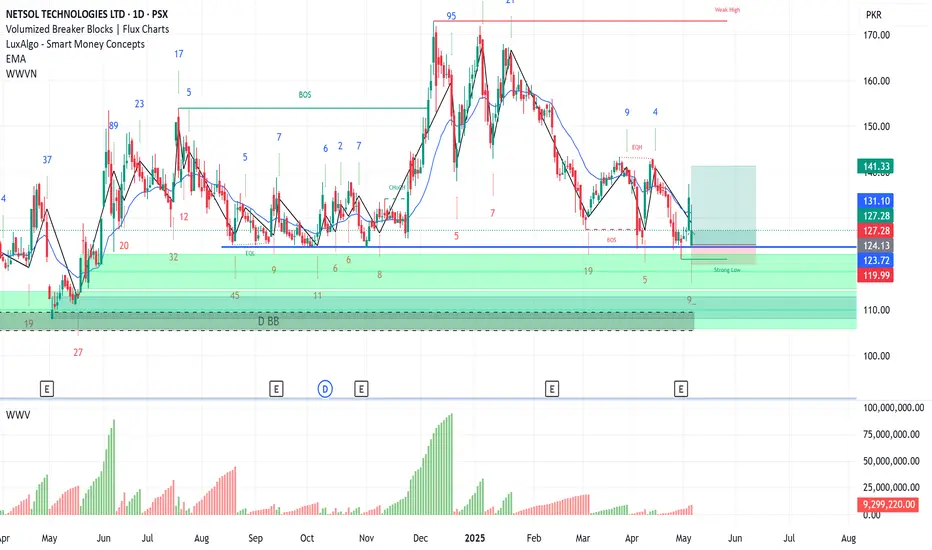
NETSOL LONG TRADENETSOL is rebounding from its strong support after liquidity sweep, Weis Wave Volumes show positive shift of volumes to bullish side
BUY NETSOL 124-128
TP 142
SL 119
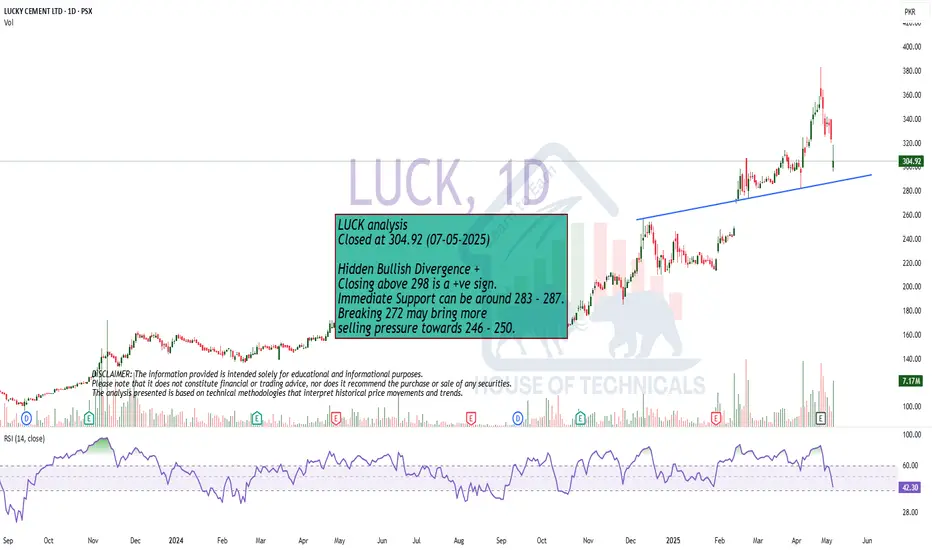
Hidden Bullish Divergence +Hidden Bullish Divergence +
Closing above 298 is a +ve sign.
Immediate Support can be around 283 - 287.
Breaking 272 may bring more
selling pressure towards 246 - 250.
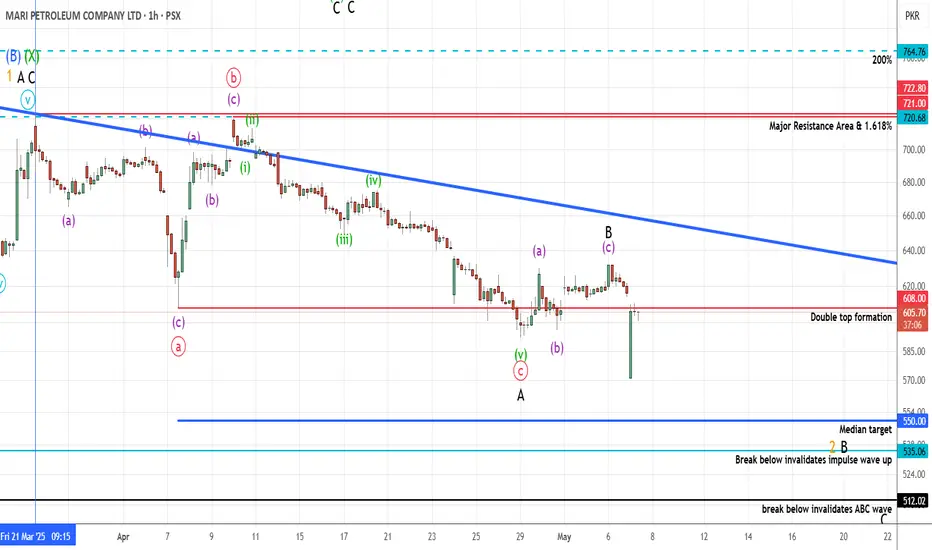
MARI PROBABLY IN WAVE '' C '' OF CORRECTION - SHORTThis is in continuation to our ongoing tracking of MARI.
MARI is most probably in wave C of an ABC correction and since prices moved down giving confidence to our bearish wave count, we are taking a small position by short selling.
Due to market volatility we will trade this setup with cautious using trailing stop loss until we reach our target. We only recommend small positions at the beginning and once prices starts to unfold in our favor we will add more to our positions on bounce backs
Alternately prices can move up toward 650-660 level which is highly unlikely now but not out of question
If our wave count is correct then we can make around 8.50% or 15.50% on this trade.
Trade setup:
Entry price: 604
Stop loss: 632
Targets:
T1: 535-550
T2: 515-500
Let see how this plays, Good Luck!
Disclaimer: The information presented in this wave analysis is intended solely for educational and informational purposes. It does not constitute financial or trading advice, nor should it be interpreted as a recommendation to buy or sell any securities.
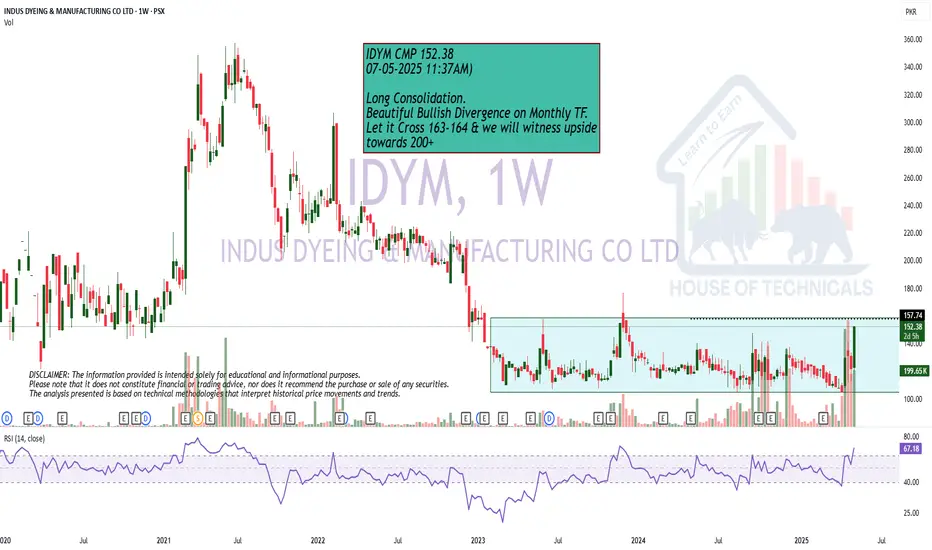
Near BreakoutLong Consolidation.
Beautiful Bullish Divergence on Monthly TF.
Let it Cross 163-164 & we will witness upside
towards 200+