PPL PROBABLY IN WAVE '' A '' OR " B " - LONGPPL is most probably in wave C of an A or B wave which is almost completed or about to get completed. our preferred wave count suggest that we should get one more leg down towards 144-140 range which will touch the long term yellow trendline and prices should bounce from there, the other possibility is that price will not go below 147 and will keep on climbing toward 173-183 range or towards the blue trendline.
Alternate wave count suggest that wave C might get extended and will keep on declining reaching our long term buy zone of 124 - 106 range.
So this is how we will trade this setup:
Scenario 1:
If 147 is not taken out and prices keep on rising then we will not take any trade because our confirmation level is 164.11 and target is 173-183 which does not give us a good risk/reward ratio
Scenario 2:
If prices do decline below 147 and reach 144-140 level, we will buy a small portion at that level and will wait for a bounce from the yellow trendline, if prices unfolds as predicted then we will add more to our long positions using swing trade. However, if prices keep on declining towards our long term buy zone then we will add positions at 120-110 levels. PPL has strong fundamentals therefore we are quite comfortable holding it for long term.
Trade setup:
Entry price: 144-140
Stop loss: We are bullish on PPL long term therefore we will hold these positions
Targets: 173-183 (Ideal is upper blue trendline)
If our wave count is correct then we might make 20.97% or 25.87% of gross profit on this trade
Let see how this plays, Good Luck!
Disclaimer: The information presented in this wave analysis is intended solely for educational and informational purposes. It does not constitute financial or trading advice, nor should it be interpreted as a recommendation to buy or sell any securities.

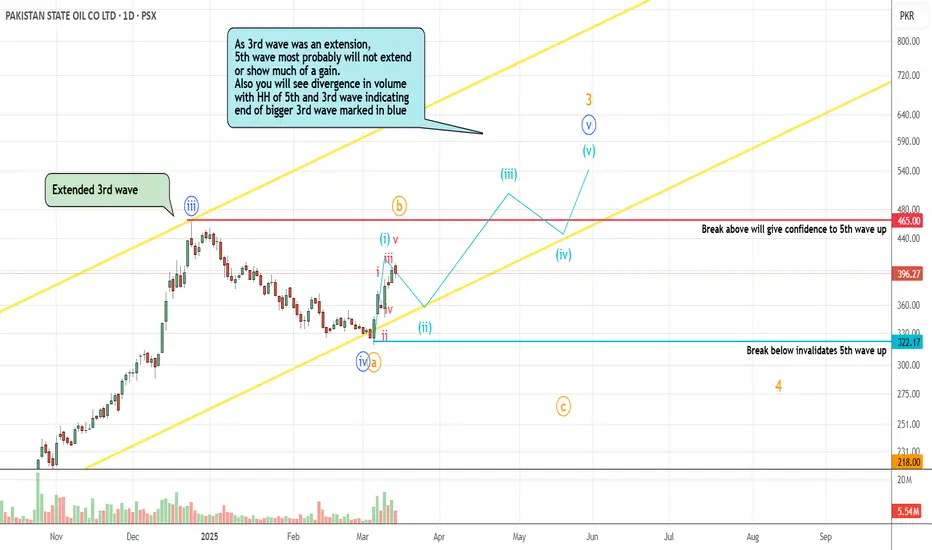
PSO PROBABLY IN WAVE '5' or '4' - LONGPSO is most probably in wave 5 of 3rd wave which can be an ending diagonal or impulse wave.
As the 3rd wave was a big extended wave, 5th wave should not extend and will not make a significant move up.
Volume divergence should also appear between 3rd and 5th wave, further breakup of wave 5 of 3rd: if the count is correct then wave 1 is completed and prices will retrace back to trendline marking wave 2 and only then move forward up.
Alternate count is that we are still in 4th wave, as 4th waves can be any corrective pattern it is not wise to mark them as completed until we see further confirmations. In 4th wave we are in wave B which also can be any corrective pattern.
Our preferred wave count is 5th wave up which will provide a buy opportunity once price retrace back.
Note: We are not trading this move because we already have MARI and POL moves at our hand which are showing more promising returns and have better fundamentals then PSO at the moment.
Feel free to comment and share your thoughts if you like.
Let see how this plays, Good Luck !
Disclaimer: The information presented in this wave analysis is intended solely for educational and informational purposes. It does not constitute financial or trading advice, nor should it be interpreted as a recommendation to buy or sell any securities.
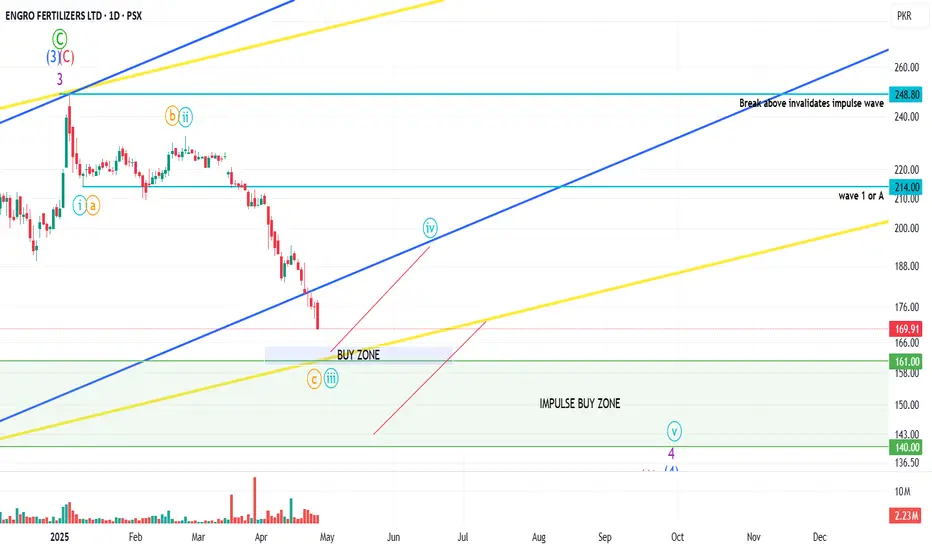
EFERT PROBABLY IN WAVE '' 3 '' OR " C " - LONGEFERT is most probably in wave 3 or C of a higher degree wave 4 or A, if our wave count is correct then wave 3 or C is almost ending and prices should take support from 165-160 range level.
Alternately prices can go toward our main buy zone directly i.e. 160-140 range in which the prices might reach 145-140 level easily but our preferred setup suggests that prices will take support around 165-160 range bouncing of the yellow trendline.
We will take a small position at 165-160 level and if prices goes further down we will add more at 145-140 level, based upon our little knowledge we find EFERT fundamentally strong and reasonable at prices around 160-140 but of course cheaper is always better.
If our wave count is correct then we can make around 12% to 21% on this trade.
Trade setup:
Entry price: 165-160
Stop loss: we will update stop loss once prices start to rise from our buy zone
Targets:
T1: 185-195
Let see how this plays, Good Luck!
Disclaimer: The information presented in this wave analysis is intended solely for educational and informational purposes. It does not constitute financial or trading advice, nor should it be interpreted as a recommendation to buy or sell any securities.
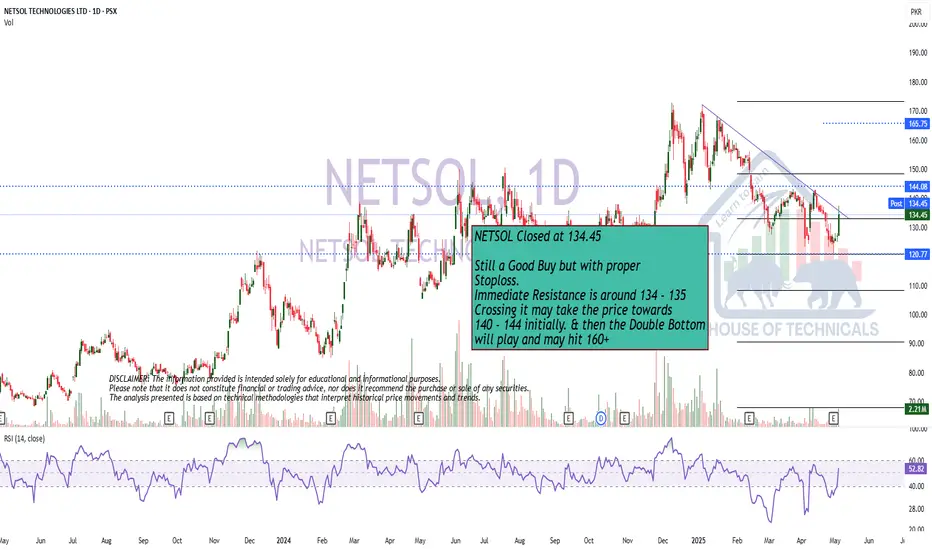
Still a Good Buy but with proper Stoploss.Still a Good Buy but with proper
Stoploss.
Immediate Resistance is around 134 - 135
Crossing it may take the price towards
140 - 144 initially. & then the Double Bottom
will play and may hit 160+
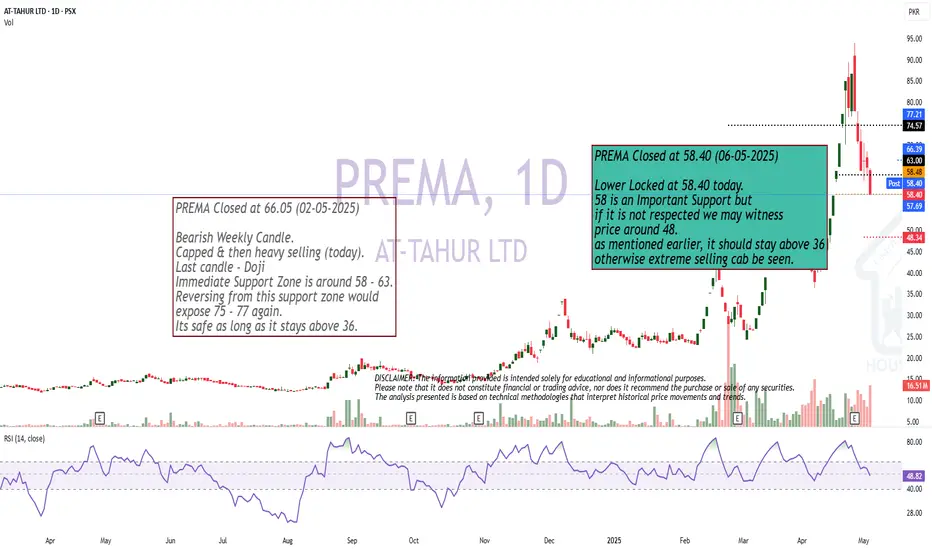
Lower Locked at 58.40 today.
Lower Locked at 58.40 today.
58 is an Important Support but
if it is not respected we may witness
price around 48.
as mentioned earlier, it should stay above 36
otherwise extreme selling cab be seen.

Hidden Bullish Divergence will play?as mentioned during market
timings, 36.50 was important to
sustain. It could not and hit the
Lower Lock at 36.03
Next Support is around 34.50 - 34.62
Now it is Important to Sustain 36.50 - 36.70
on Weekly basis.
Monthly Support is around 35.
One +ve sign: Hidden bullish divergence has
also appeared.

AVN is BullishPrice was in a downtrend consistently printing lower highs and lower lows. However, a bullish divergence on daily timeframe hints the return of bulls, and if previous lower high is broken with good volume then we can expect a bullish breakout as per Dow theory. Targets are mentioned on the chart.

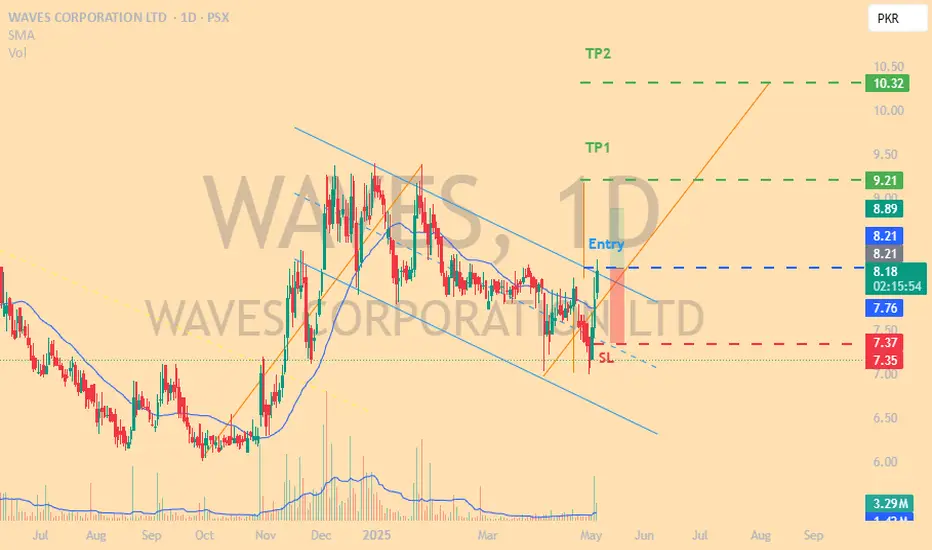
Waves - Bull FlagPSX:WAVES forming Double Bottom on Daily TF and breaking out of Bull Flag accumulation. AL and Targets mentioned.
Play on LevelsImmediate Resistance is around 360 - 361
Weekly Closing above this level would be
a +ve sign & may move the price towards 385 - 387

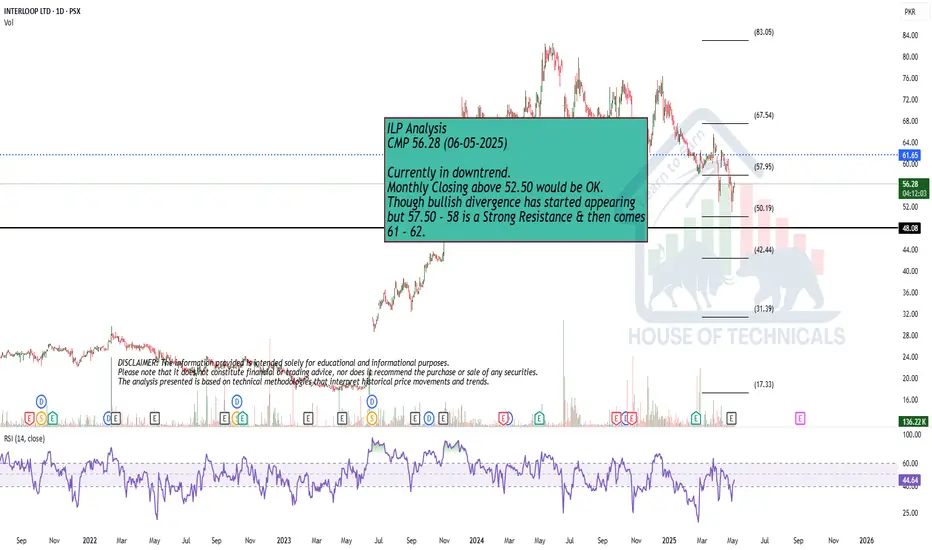
Currently in downtrend.Currently in downtrend.
Monthly Closing above 52.50 would be OK.
Though bullish divergence has started appearing
but 57.50 - 58 is a Strong Resistance & then comes
61 - 62.
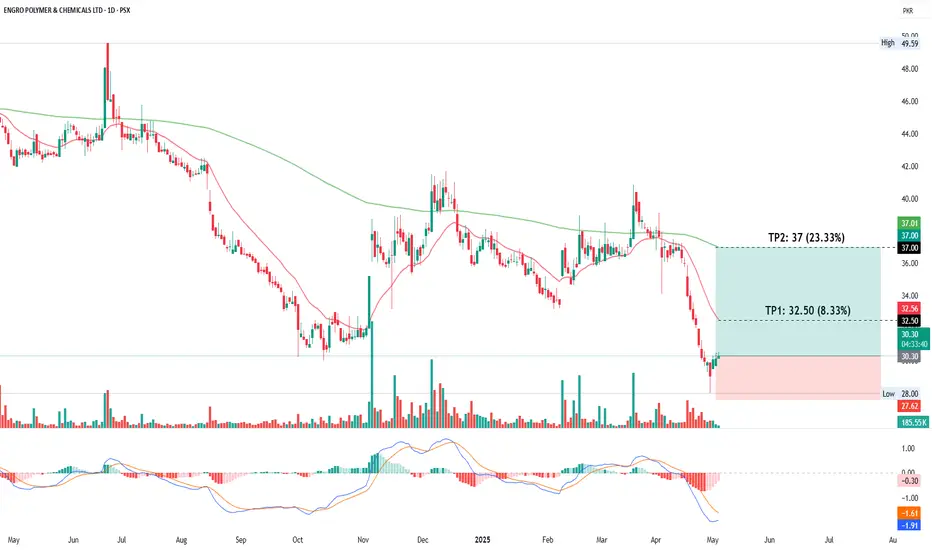
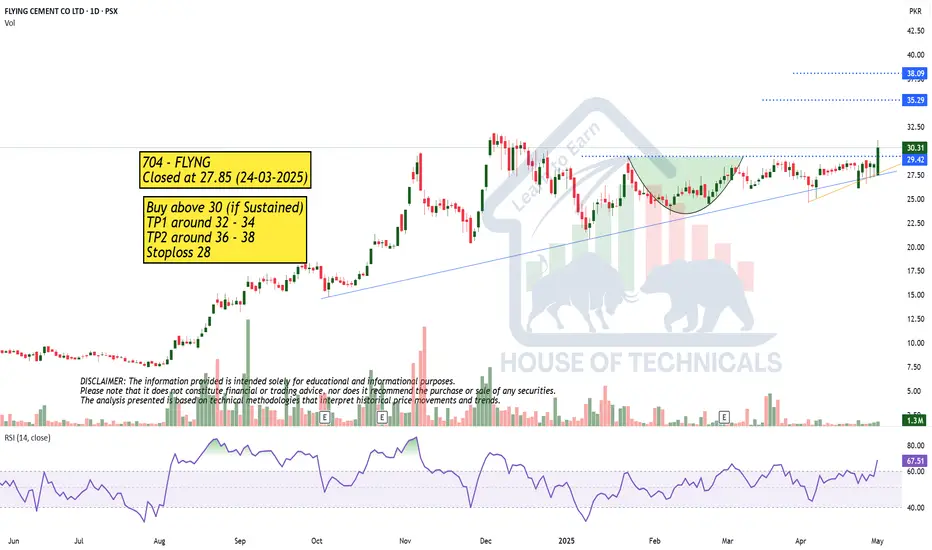
EPCL Shows Bullish Reversal Potential with MACD Crossover & EMAThe daily chart of EPCL indicates a potential bullish reversal. The price recently rebounded from a low near 28 and is now trading at 30.50, showing signs of recovery. The MACD indicator is on the verge of a bullish crossover, suggesting increasing upward momentum. The immediate target (TP1) is 32.50, which aligns with the 20-day EMA, while the second target (TP2) is set at 37.00, corresponding to the 200-day EMA. These levels represent 8.33% and 23.33% potential gains, respectively, and may serve as key resistance levels in the short to medium term.
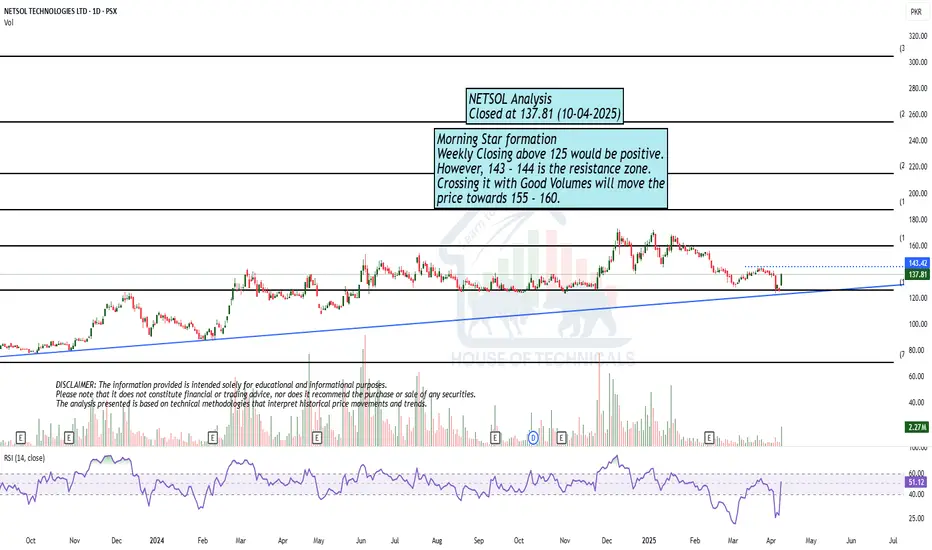
Morning Star formationMorning Star formation
Weekly Closing above 125 would be positive.
However, 143 - 144 is the resistance zone.
Crossing it with Good Volumes will move the
price towards 155 - 160.
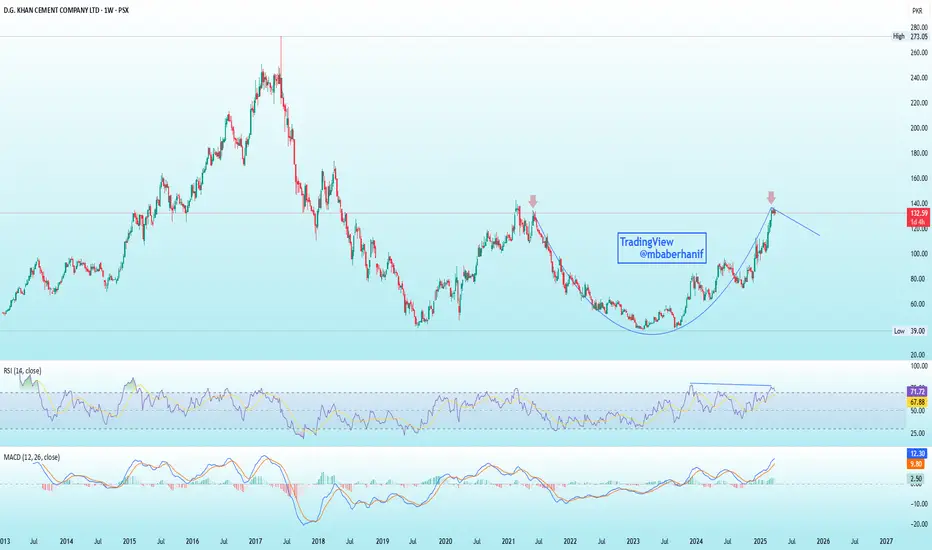
DGKC | Is This Cup & Handle Pattern?Here we have a classic pattern and price dynamics. A major high leads to a low and then a recovery wave. The recovery wave peaks before reaching the previous high and this reveals that a new drop is approaching.
Trading volume is low on the current rise and the latter part of it goes into a parabola. A parabola can only end in a retrace.
DGKC is now set to produce a correction, this correction is set to develop in the short- to mid-term.
RSI indicator if at over bought level while MACD is line is above the signal line, and can show a cross over which establish some negative stance on the price.
Fibonacci levels for the support are PkR123 (0.382 level) and PkR119 (0.5 level) from where a pull back can be expected
On the flip side, if the price gives a break out and closed above PkR137 level then only new bullish wave is expected.
PRL LONG TRADEPRL has confirmed its bounce from bottom of upward channel and Breaker Block
It's short term high probability trade
Buy PRL 27.5-29.5
TP 32.8
SL 26.6

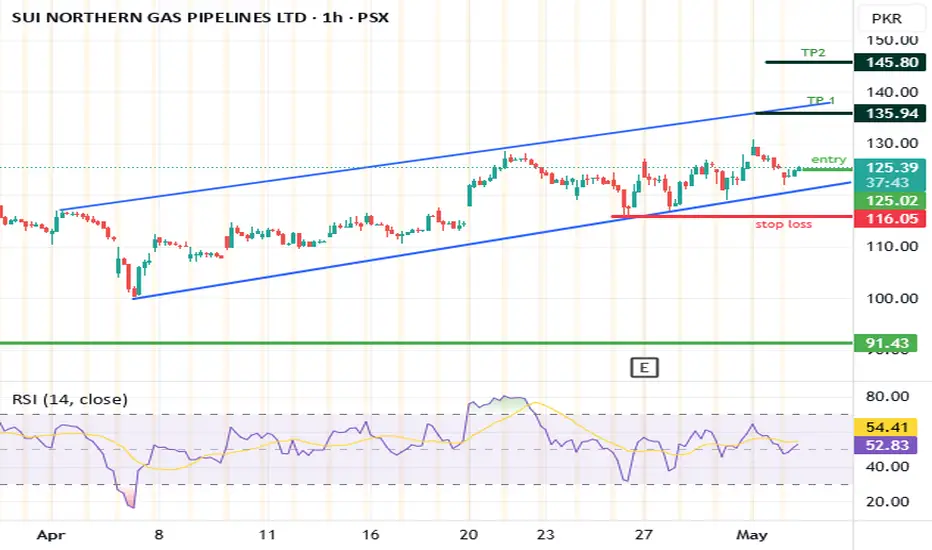
SNGP buying StrategyBuy Recommendation:
- Current Price: Rs. 124.94
- Suggested Buy Range: Rs. 123-118 (on dip)
- Stop Loss: Rs. 116
- Target Price: Rs. 135
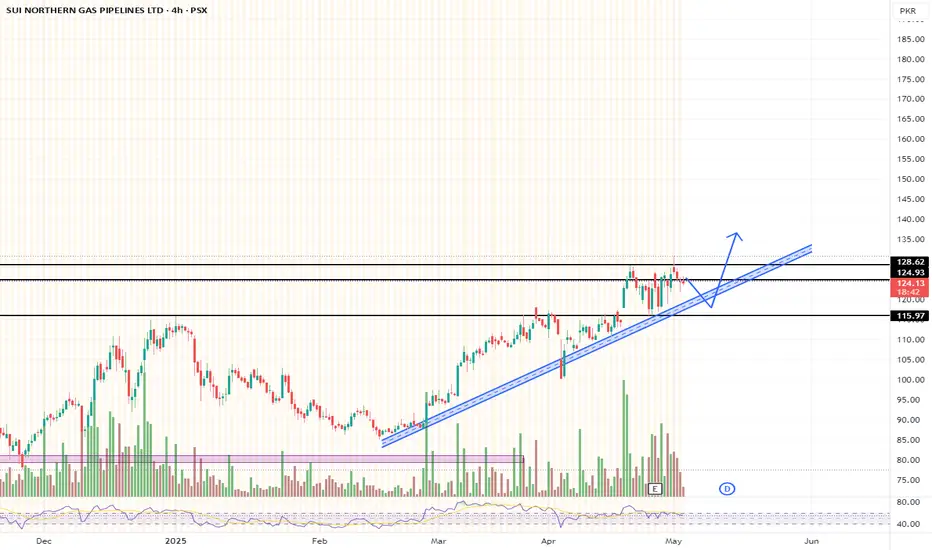
SNGP IS ON THE RISESNGP is rising despite of the fact that market is in pressure, price has taken a good correction and now showing bullish signs, buying is a good option at current price.
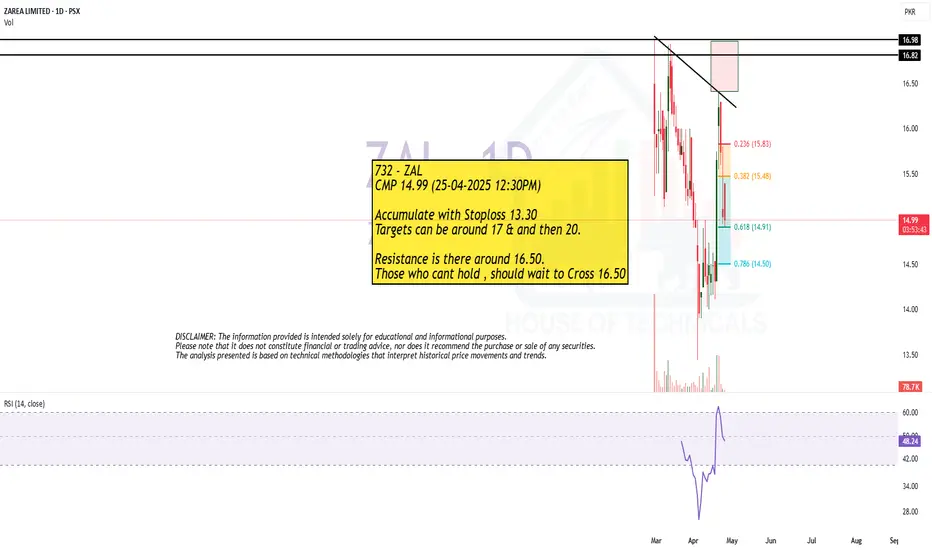
Should wait for Resistance Breakout.
Accumulate with Stoploss 13.30
Targets can be around 17 & and then 20.
Resistance is there around 16.50.
Those who cant hold , should wait to Cross 16.50
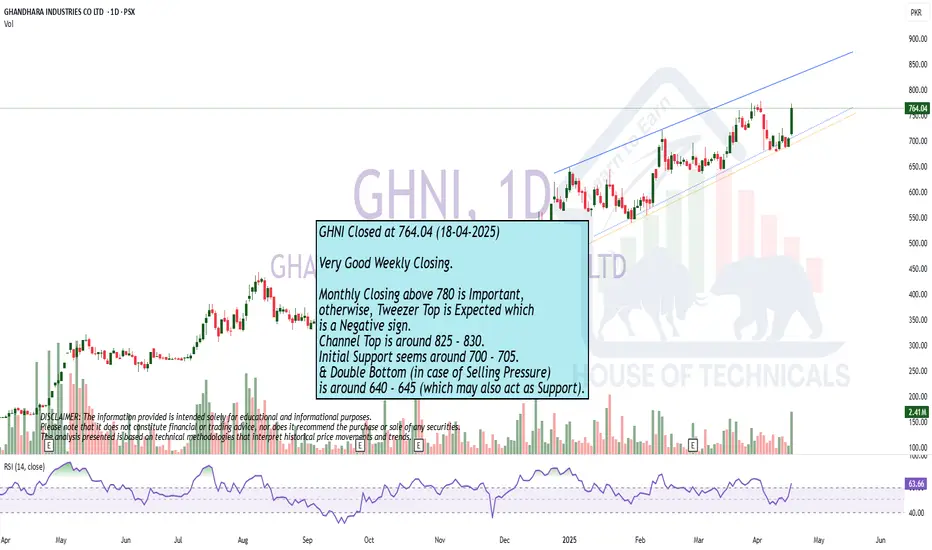
Very Good Weekly Closing.
Very Good Weekly Closing.
Monthly Closing above 780 is Important,
otherwise, Tweezer Top is Expected which
is a Negative sign.
Channel Top is around 825 - 830.
Initial Support seems around 700 - 705.
& Double Bottom (in case of Selling Pressure)
is around 640 - 645 (which may also act as Support).
Kosm is in ideal buying zoneKosm is in ideal Buying zone of 5.2 to 4.6. Selling Zone is above 6 to 8 and above.
Note: This is not a buy/sell trade call. Trade at your own will.

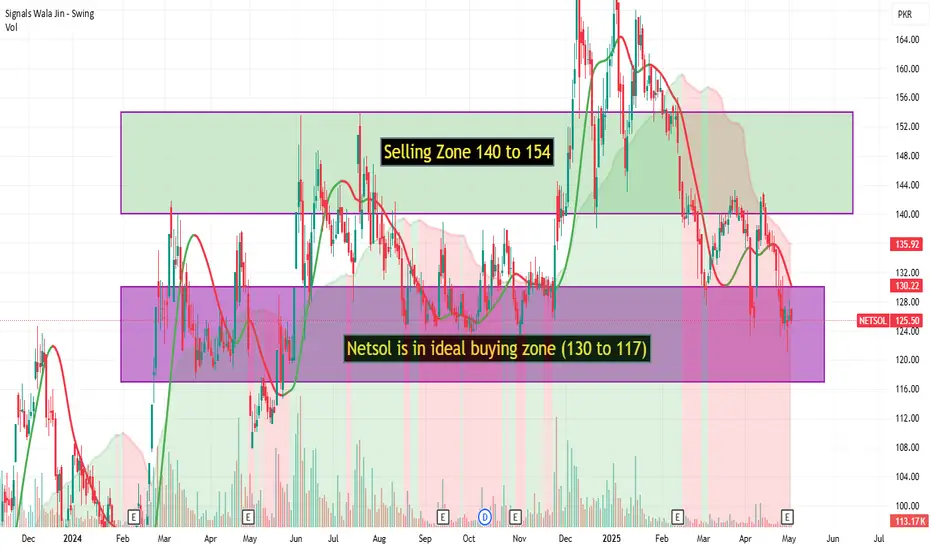
Netsol is in ideal buying zoneNetsol is in ideal buying zone of 130 and 117. Its selling zone is 140 to 154.
Note: This is not a buy sell trade call, trade at your own analysis and will.
Pace is in ideal buying zonePace is near to 4.88 a strong support level. it is ideal zone for buy it. Currently at 5.02 level and it could reach its strong resistance level of 5.62 and 6.36 level.
Note: This is not a buy/sell trade call. trade at your own will and analysis.
