Mari Swing trading targetsMari is entered into bullish trend and entry is possible, TP1 is 660 and TP2 is 700. SL is 593.
Note: This is not a buy/sell trade call. trade at your own will and analysis. This is for education purpose.

Play on Levels
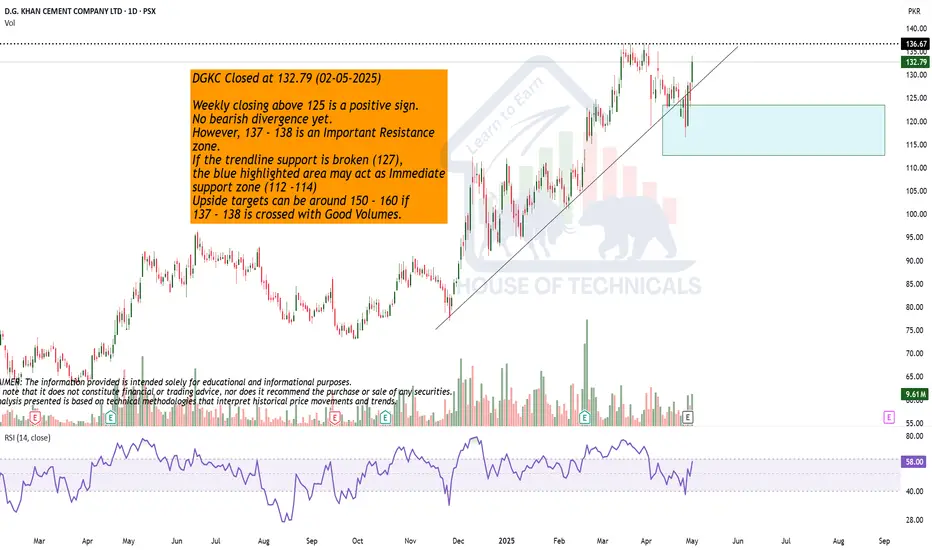
Weekly closing above 125 is a positive sign.
No bearish divergence yet.
However, 137 - 138 is an Important Resistance
zone.
If the trendline support is broken (127),
the blue highlighted area may act as Immediate
support zone (112 -114)
Upside targets can be around 150 - 160 if
137 - 138 is crossed with Good Volumes.
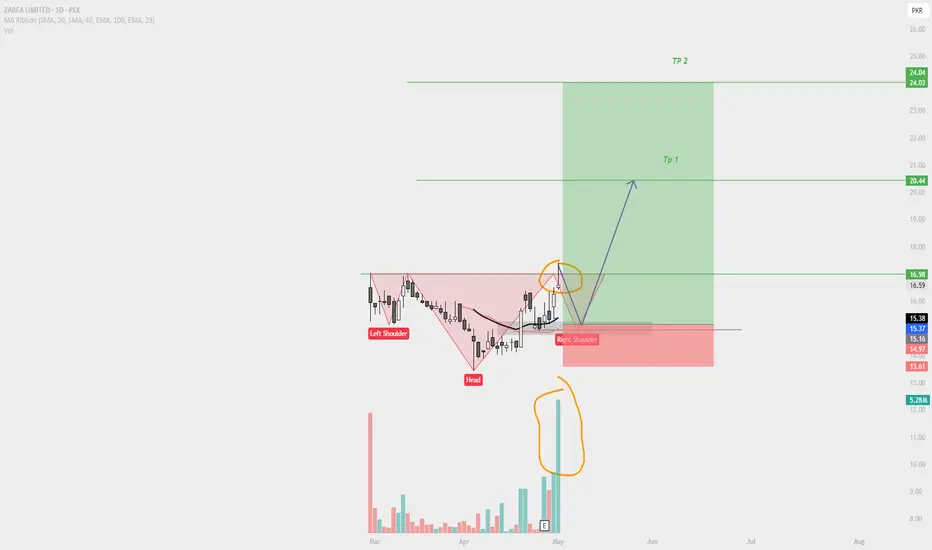
ZAL Trade Plan – Strong Fundamentals & High Growth PotentialCompany Overview:
ZAL is fundamentally one of the strongest companies in the market, showcasing impressive growth driven by increasing sales and expanding profit margins. The company is actively scaling its operations, which sets the stage for even greater future earnings. Given its solid financials and business expansion, ZAL holds significant potential for capital appreciation.
Growth Outlook:
With a strong earnings trajectory and business development initiatives, the stock price has the potential to generate gains of 40–70%, depending on the size of the upcoming rally.
✅ Trade Setup
Entry Options:
Breakout Entry: Buy on a confirmed breakout with closing above Rs. 17
Dip Entry: Buy between Rs. 15.20 – 14.50 (ideal accumulation zone) , CZ it will form the right Shoulder of Head and shoulder Pattern
Risk Management:
Stop-Loss: Rs. 13 (to manage downside risk)
Take-Profit Levels:
TP1: Rs. 16.50
TP2: Rs. 19.00
TP3: Rs. 22.00
TP4: Rs. 24.00
📌 Note: Follow proper risk management and position sizing based on your portfolio. Monitor price action and volume closely around the breakout level for confirmation.
BAFL LONG TRADEBAFL has been in uptrend channel since long
It has touched its bottom and given positive rebound yesterday
It just needs one more green candle confirmation above 73
Buy BAFL if it crosses 73.5
TP 84
SL 68

SSGC LONG TRADESSGC has rebound from trendline, it's continuously in uptrend
Buy SSGC 39-41
TP 44.5
SL 37.9

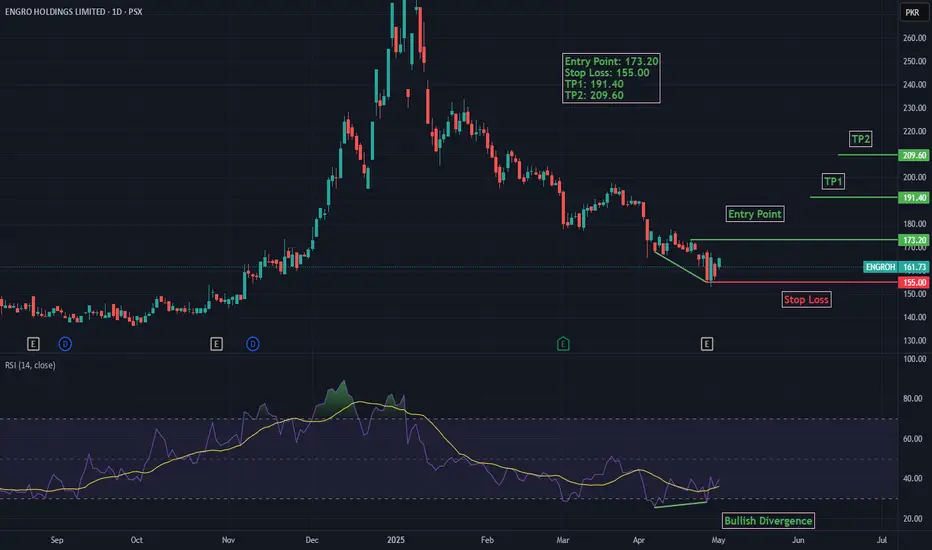
Bullish divergence in ENGROHBullish divergence is observed in the daily timeframe for ENGROH. The current downtrend is expected to reverse after the bullish divergence. The current downtrend is likely to reverse into an uptrend and reach levels indicated on the chart. When the trend starts to reverse and breaks the entry point level indicated on the chart, it will be considered a confirmation of the trend reverse and a good point to take a long position.
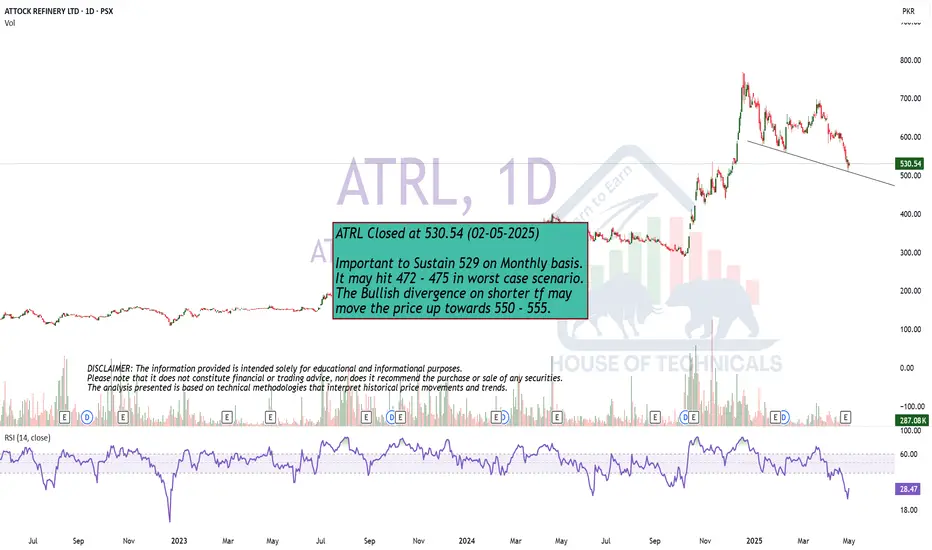
Monthly Support.Important to Sustain 529 on Monthly basis.
It may hit 472 - 475 in worst case scenario.
The Bullish divergence on shorter tf may
move the price up towards 550 - 555.
Make it or Break it Situation.
Make it or Break it Situation.
Either it will reverse from the current
leve or it may touch 1235 - 1240.

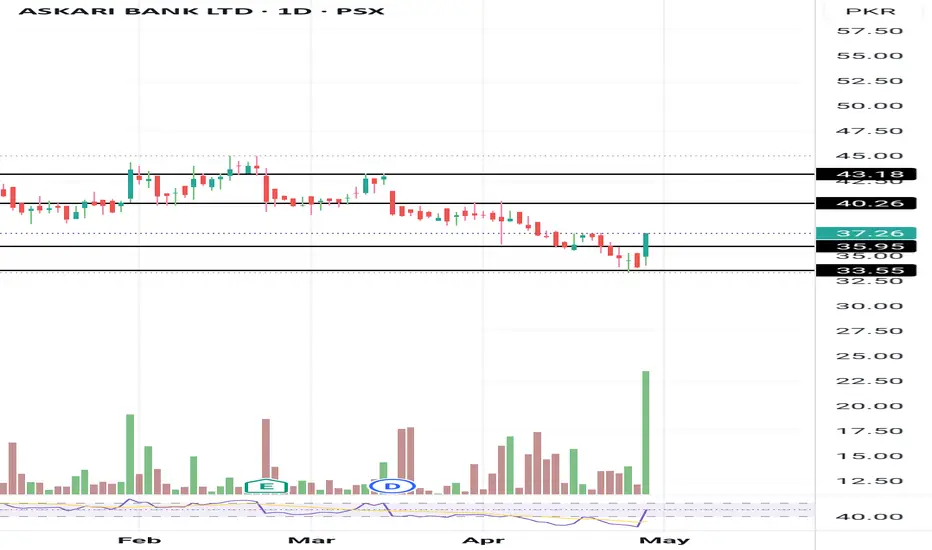
Bearish Divergence has appeared.
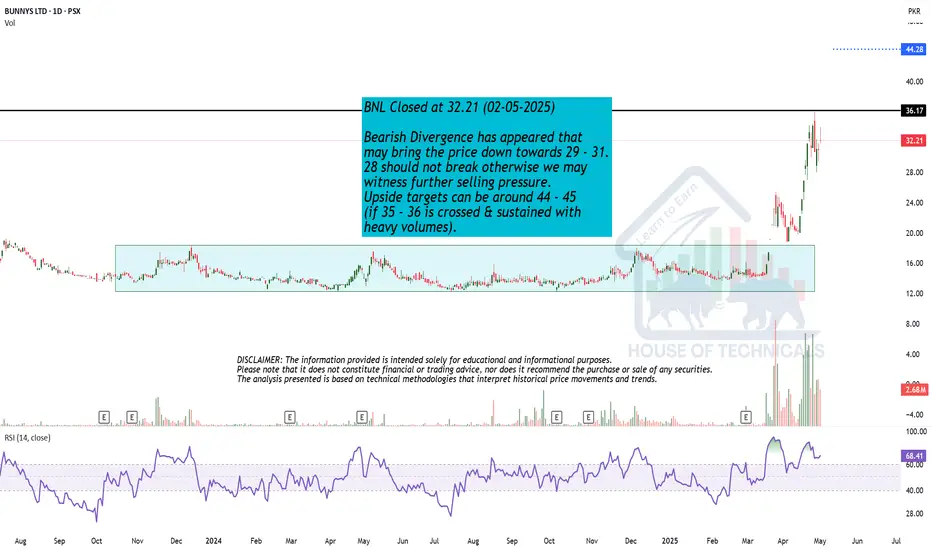
Bearish Divergence has appeared that
may bring the price down towards 31 - 32.
28 should not break otherwise we may
witness further selling pressure.
Upside targets can be around 44 - 45
(if 35 - 36 is crossed & sustained with
heavy volumes).
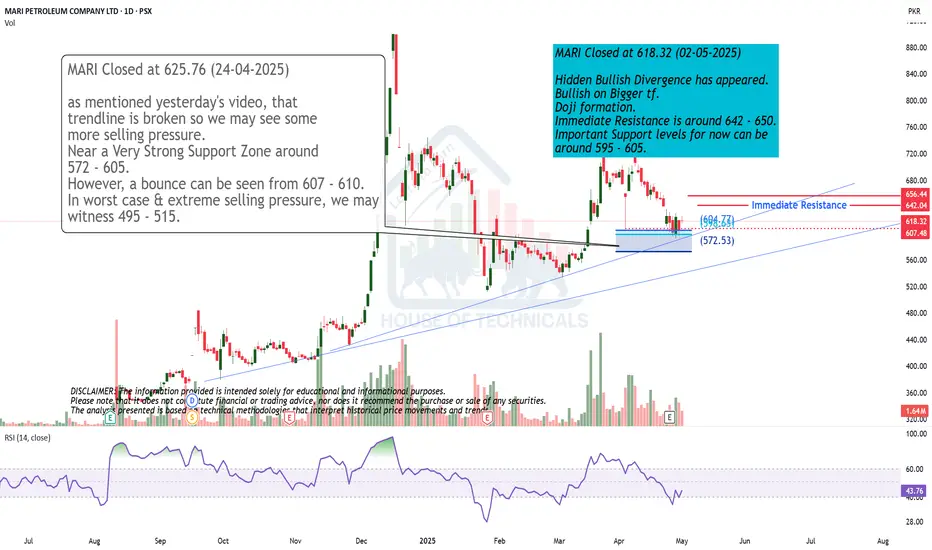
Hidden Bullish Divergence
Hidden Bullish Divergence has appeared.
Bullish on Bigger tf.
Doji formation.
Immediate Resistance is around 642 - 650.
Important Support levels for now can be
around 595 - 605.
H&S Pattern
Though H&S Pattern has formed but
Currently at an Important Support around
200 - 202.
Next Support lies around 193 - 196.
Though there is Bullish Divergence on
shorter time frame but its resistance is
around 226 - 231

Bearish Weekly Candle.Bearish Weekly Candle.
Capped & then heavy selling (today).
Last candle - Doji
Immediate Support Zone is around 58 - 63.
Reversing from this support zone would
expose 75 - 77 again.
Its safe as long as it stays above 36.

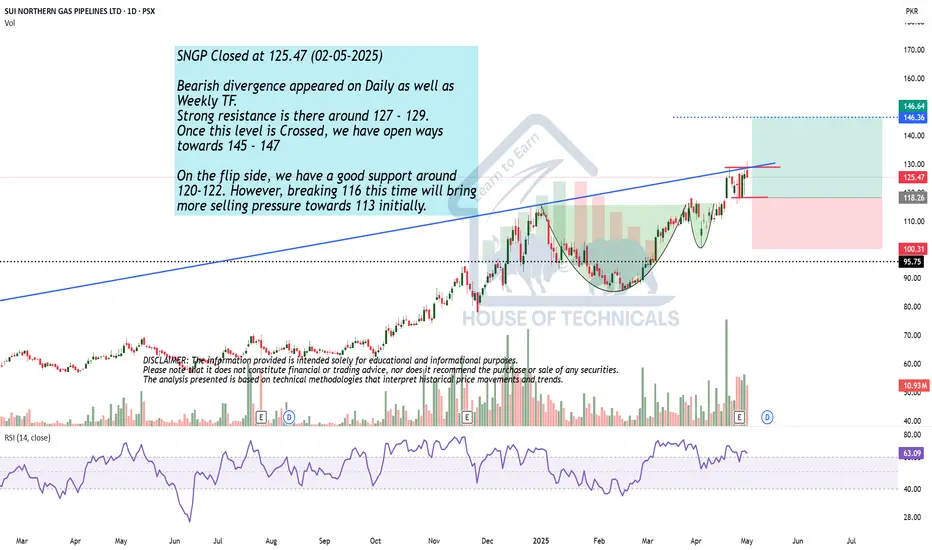
Bearish Divergence appeared.Bearish divergence appeared on Daily as well as
Weekly TF.
Strong resistance is there around 127 - 129.
Once this level is Crossed, we have open ways
towards 145 - 147
On the flip side, we have a good support around
120-122. However, breaking 116 this time will bring
more selling pressure towards 113 initially.
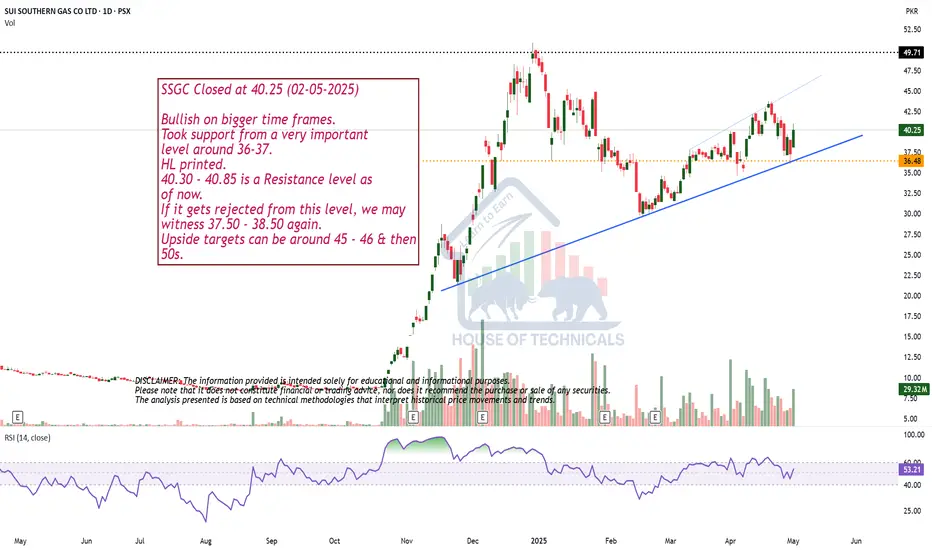
Bullish on bigger time frames.
Bullish on bigger time frames.
Took support from a very important
level around 36-37.
HL printed.
40.30 - 40.85 is a Resistance level as
of now.
If it gets rejected from this level, we may
witness 37.50 - 38.50 again.
Upside targets can be around 45 - 46 & then
50s.
BFBIO is entered into Bullish ZoneBFBIO is entered into bullish zone and may be it will cross 150 and 200 levels in few days. Stop loss is 118.
Note: This is not a buy/sell trade call. Trade at your own will.

Searl entered into Bullish zoneSearl is entered into Bullish zone and may it cross 90 and 95 levels in few days. Stop loss could be 80 and 78.
Note: This is not a buy/sell trade call. Trade at your own will.

AVN in Bearish trend AVN in Bearish trend about to face a trend reversal RSI diversions can be seen. Entry with a buy stop above the last lower high

DGKC entered into bullish zoneDGKC is entered into bullish zone,
Note: This is not a buy/sell trade call.

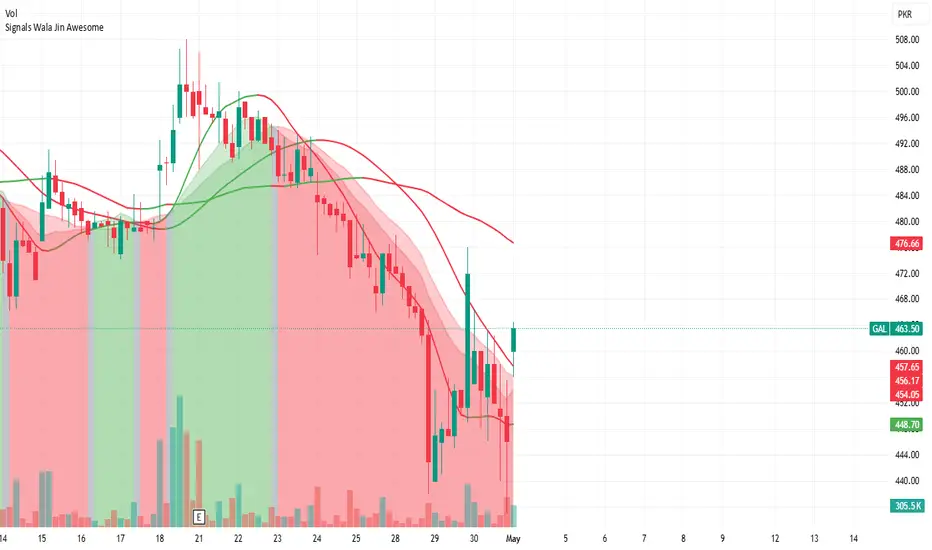
Gal entered into Bullish zoneGal is entered into bullish zone and may gross 500 and 550 level.
Note: This is not a buy/sell trade call, it is for education purpose, use stop loss.
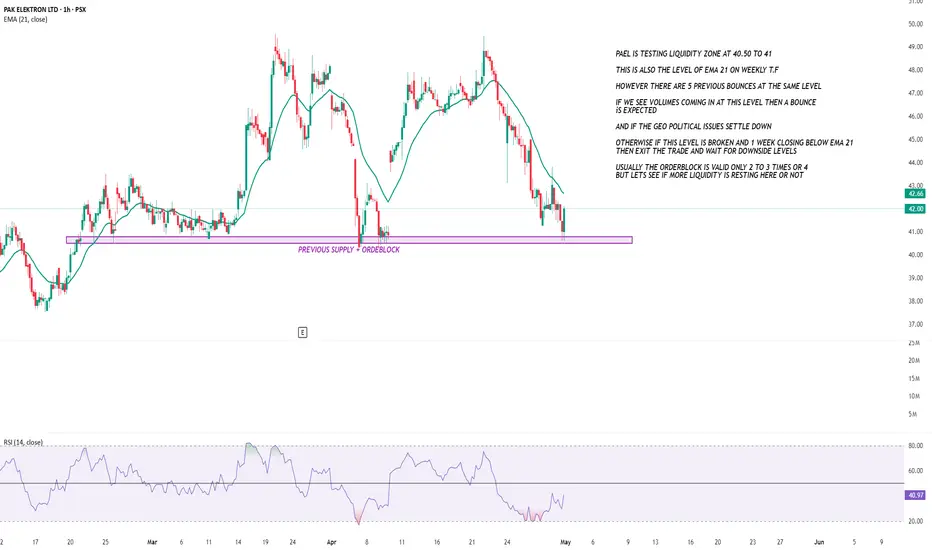
PAEL SETUP ONCE AGAINPAEL is currently at its orderblock zone where the liquidity is resting if volumes come in at this level then we can expect a bounce again if the orderblock fails and there is no liquidity in OB then wait for downside levels and if the weekly ema 21 is broken then i see 30 level coming but still we will look into some more levels for now just focus on this orderblock
the previous supply is completed here
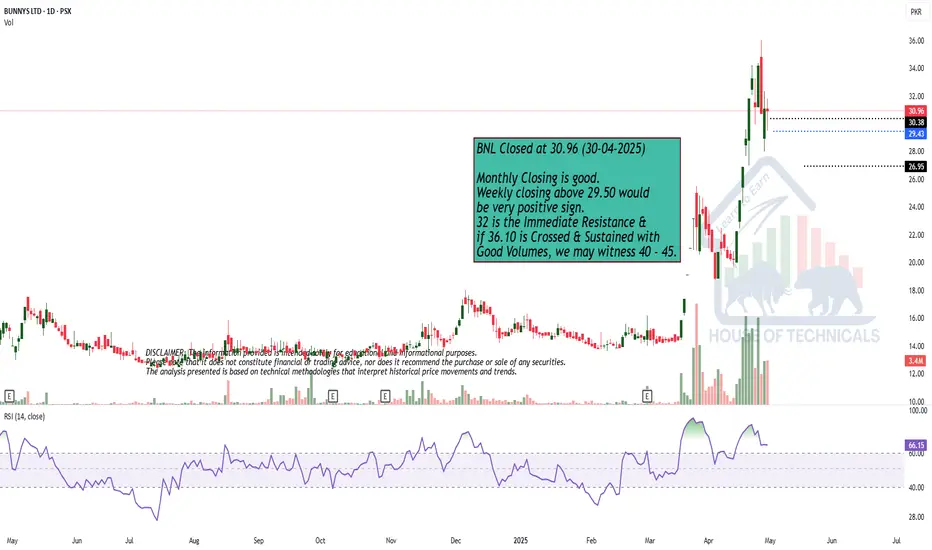
HH HLMonthly Closing is good.
Weekly closing above 29.50 would
be very positive sign.
32 is the Immediate Resistance &
if 36.10 is Crossed & Sustained with
Good Volumes, we may witness 40 - 45.
PSO Facing Trendline Resistance – Possible Retracement AheadMollyRonaldFx Report
The PSO 15-minute chart shows a strong bounce from recent lows, with price currently testing a well-defined descending trendline. Although today’s movement reflects bullish momentum (+2.22%), the resistance at this trendline may trigger a pullback. The projected short-term scenario indicates a potential dip towards the 348 support zone. A failure to break and hold above the trendline could confirm this bearish move. Watch price action closely near the resistance area for confirmation.

AKBL buying opertunity AKBL Buying Opportunity:
Analysis:
1. *Support Level*: AKBL shows strength on support, indicating potential buying interest.
2. *Buying Range*: PKR 37-34 seems like a reasonable entry point.
3. *Stop Loss*: PKR 32 provides a buffer against potential losses.
4. *Target Prices*: PKR 40-42 and PKR 45 offer potential
Next Steps:
1. *Monitor AKBL's Performance*: Keep an eye on AKBL's stock price and adjust strategy as needed.
2. *Stay Informed*: Stay up-to-date with market news and analysis.