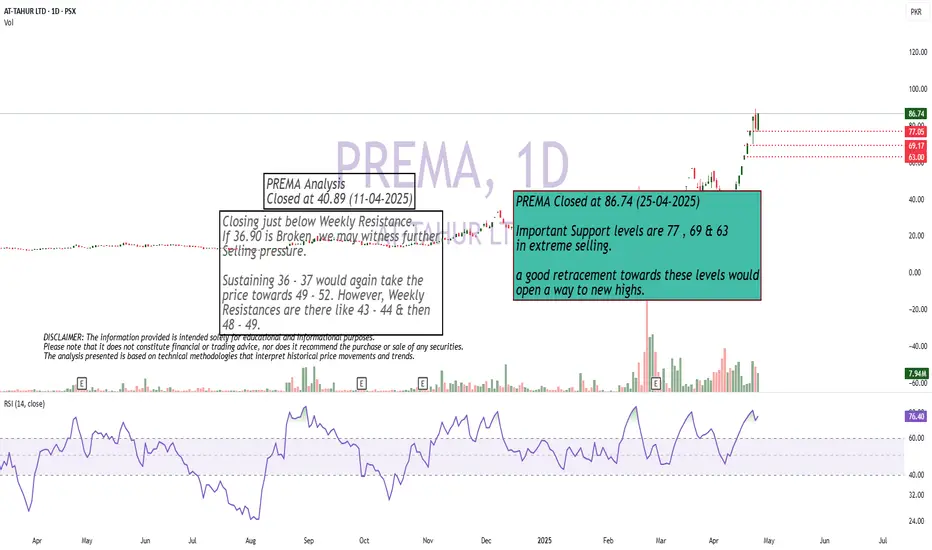
Good Retracement Needed
Important Support levels are 77 , 69 & 63
in extreme selling.
a good retracement towards these levels would
open a way to new highs.
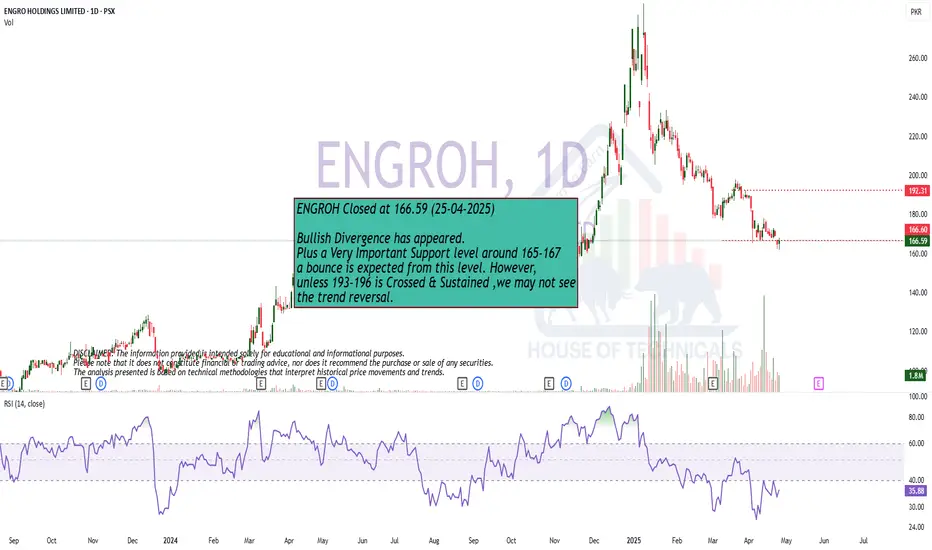
Bullish Divergence has appeared.
Bullish Divergence has appeared.
Plus a Very Important Support level around 165-167
a bounce is expected from this level. However,
unless 193-196 is Crossed & Sustained ,we may not see
the trend reversal.
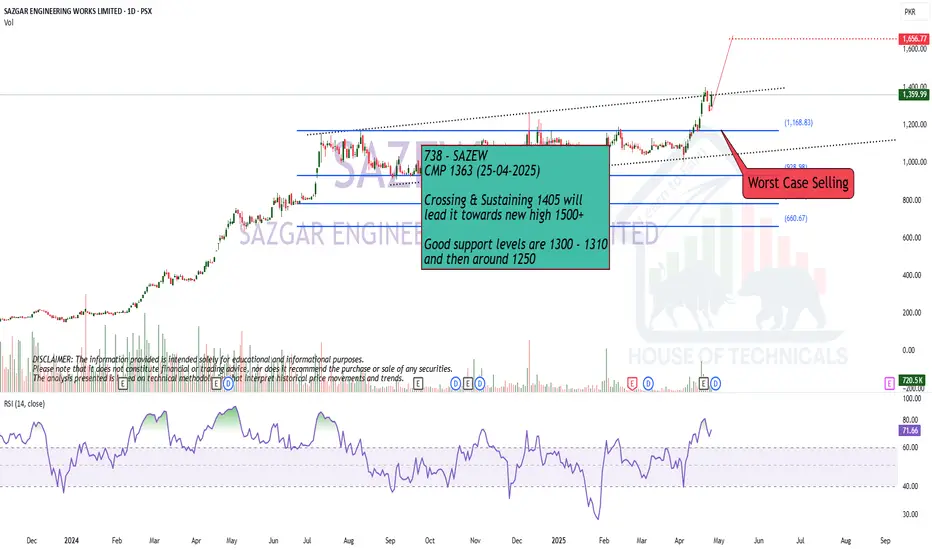
Watchout LevelCrossing & Sustaining 1405 will
lead it towards new high 1500+
Good support levels are 1300 - 1310
and then around 1250
HBL // BUYPump from Support
HBL one of the most successful banks in Pakistan, Good Fundamental + Support from Technicals


Good If it comes to 114 - 106Pleace first buying order at 114 than on 110 and last at 105 good stock to buy.


TGL near trendlineTGL is in uptrend price has taken support from trend line after a good correction, good oportinuity for buying at current levels

GLAXO is in buying ZONEGSK is trading near support area,good trading oportinuity for buying at current price with a define stop loss.
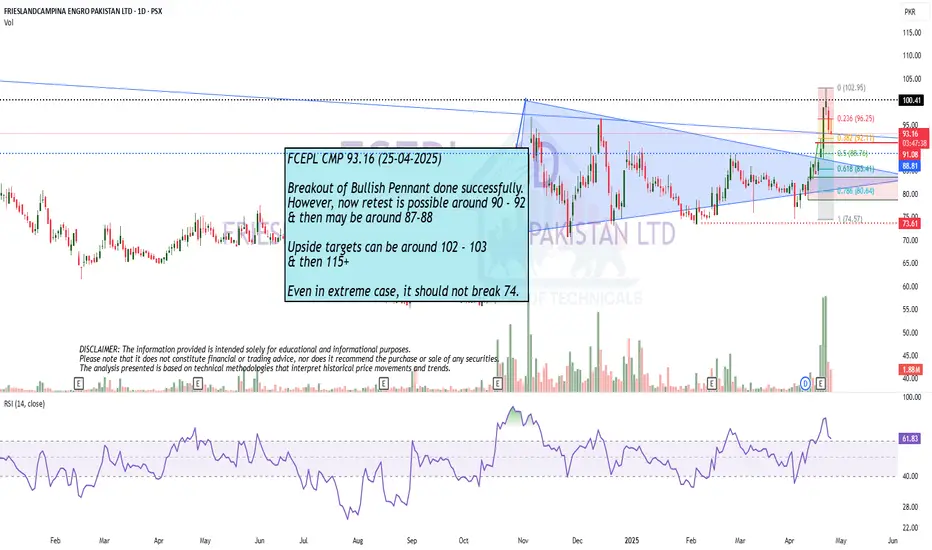
Breakout of Bullish Pennant done successfully.
Breakout of Bullish Pennant done successfully.
However, now retest is possible around 90 - 92
& then may be around 87-88
Upside targets can be around 102 - 103
& then 115+
Even in extreme case, it should not break 74.
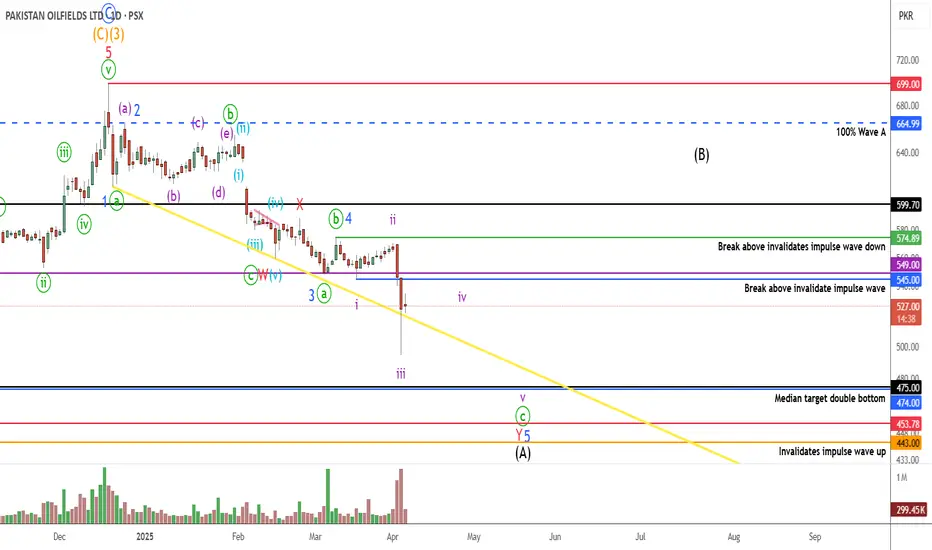
POL PROBABLY IN WAVE 'A' OR '1'This is an update on our POL wave count shared earlier, we have modified the wave count looking at the formations and excluded the possibility of the current wave being a wave C.
If the wave count is correct then we are in 5 or Y of wave 1 or A.
With reference to my last idea of POL in which we got greedy and took a loss on 50% of our positions and are still holding 50% of the long positions for long term. Since are preferred wave count is still showing some downside which can reach 500-475 range and even further, It is not wise to just let our investment sit there and wait for the upward movement which can take months from now. Therefore we have decided to hedge our current position with a small portion of short sell in POL futures.
Will share the short sell trade setup tomorrow morning
Let see how this plays, Good Luck!
Disclaimer: The information presented in this wave analysis is intended solely for educational and informational purposes. It does not constitute financial or trading advice, nor should it be interpreted as a recommendation to buy or sell any securities.
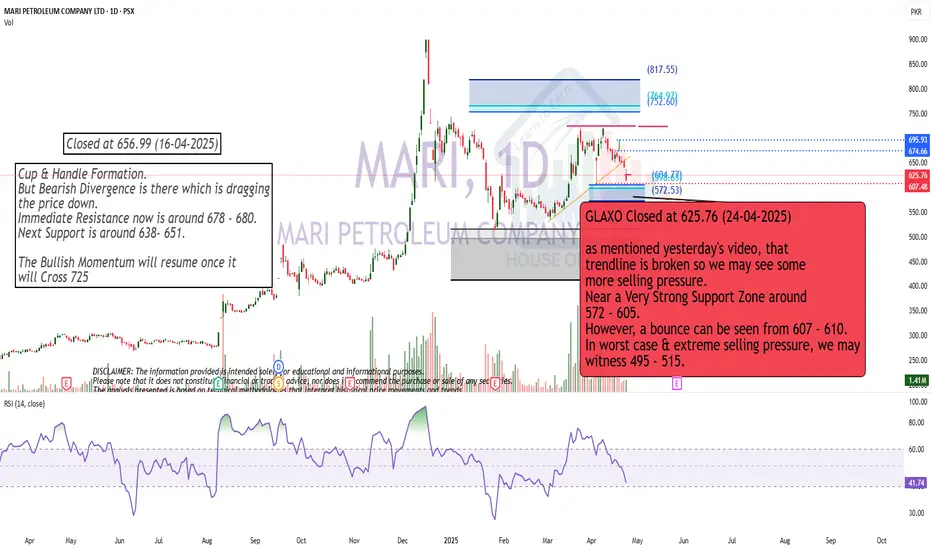
Play on levelsas mentioned yesterday's video, that
trendline is broken so we may see some
more selling pressure.
Near a Very Strong Support Zone around
572 - 605.
However, a bounce can be seen from 607 - 610.
In worst case & extreme selling pressure, we may
witness 495 - 515.
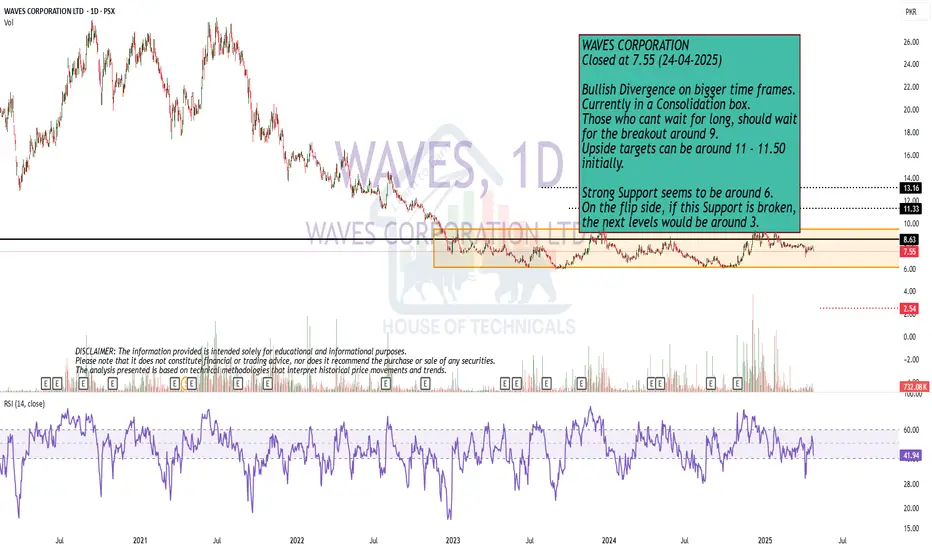
Bullish Divergence on bigger time frames.
Bullish Divergence on bigger time frames.
Currently in a Consolidation box.
Those who cant wait for long, should wait
for the breakout around 9.
Upside targets can be around 11 - 11.50
initially.
Strong Support seems to be around 6.
On the flip side, if this Support is broken,
the next levels would be around 3.
After Making HH, now towards HL.
After Making HH, now towards HL.
Bearish Divergence is there, so dragging
the price down.
115 - 118 can be a Good Support level.
Couple of Green candles may confirm HL
at this area.
However, if 110 is broken, we may
witness further Selling pressure.

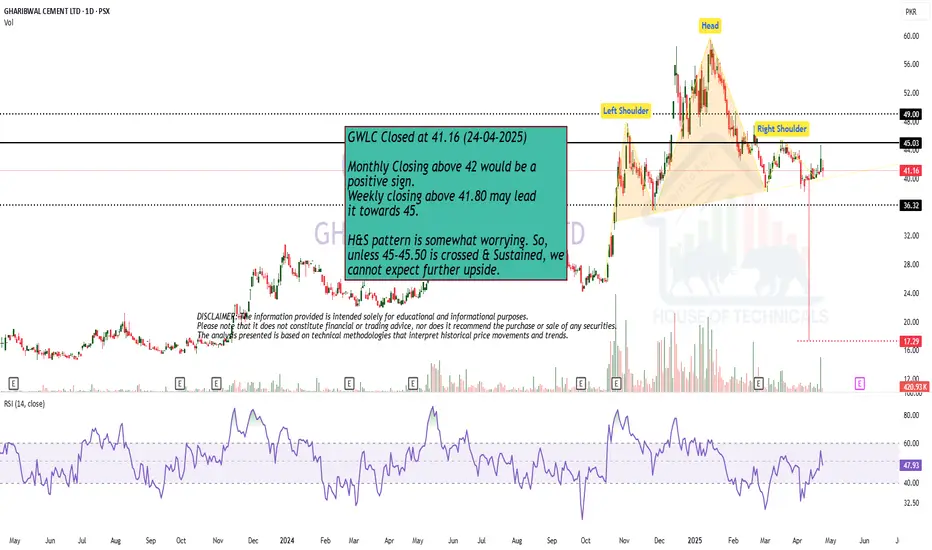
Will Head & Shoulder Pattern play or not?Monthly Closing above 42 would be a
positive sign.
Weekly closing above 41.80 may lead
it towards 45.
H&S pattern is somewhat worrying. So,
unless 45-45.50 is crossed & Sustained, we
cannot expect further upside.
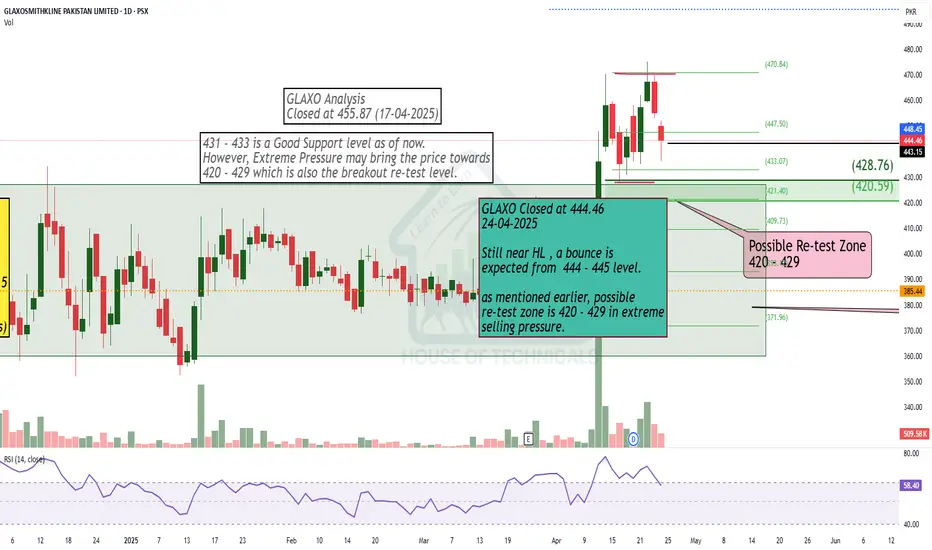
Near HL
Still near HL , a bounce is
expected from 444 - 445 level.
as mentioned earlier, possible
re-test zone is 420 - 429 in extreme
selling pressure.
Continuously Making HH HL on Bigger TF.Continuously Making HH HL on Bigger TF.
It has crossed an Important Resistance around
24.90 - 25 & now it has 2 Important Support Levels;
S1 around 24.30 - 25(this seems a Stronger one)
S2 around 22
Should not Break 18 as of now.
It still has the potential to touch 30 - 31.

NETSOL | Inverse H&SNETSOL is forming inverse head and shoulder pattern on daily time frame, strategy should be buy on dip in between 129 – 131 for the upside target of 136 – 137 level followed by 140 – 142 level. Use stop loss below 127 on closing basis

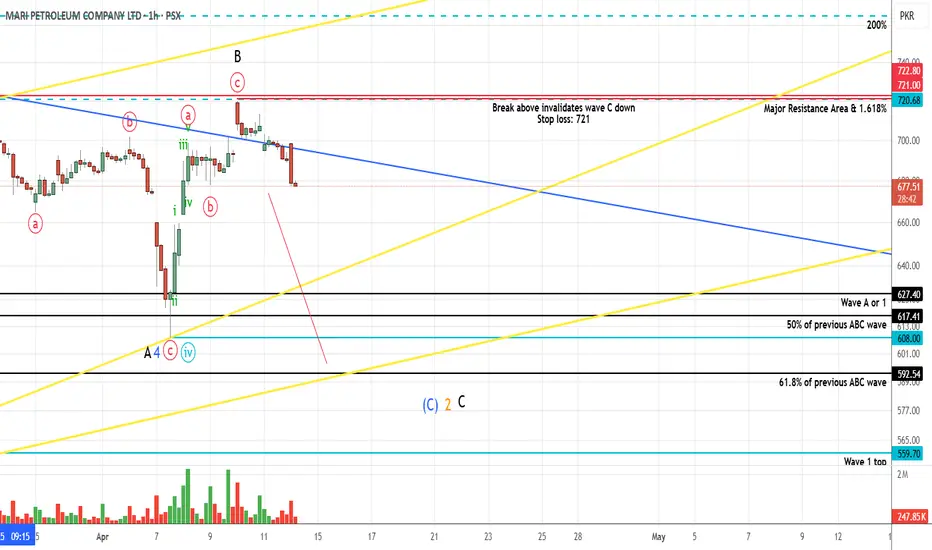
MARI PROBABLY IN WAVE '' C '' OF CORRECTION - SHORTThis is in continuation to our ongoing tracking of MARI.
Since prices moved down giving confidence to our bearish wave count, we are taking a small position by short selling. They are several possibilities at hand therefore we will trade this setup with cautious using trailing stop loss until we reach our target.
We only recommend small portions while short selling due to the fact that futures have less liquidity/volume.
If our wave count is correct then we can make around 10.85% or 13.04% on this trade.
Trade setup:
Entry price: 682
Stop loss: 721
Targets:
T1: 608
T2: 593-578
Let see how this plays, Good Luck!
Disclaimer: The information presented in this wave analysis is intended solely for educational and informational purposes. It does not constitute financial or trading advice, nor should it be interpreted as a recommendation to buy or sell any securities.
UBL Share StrategyUBL Buying Strategy:
To determine if the proposed buying strategy for United Bank Limited (UBL) shares is viable, let's break down the plan:
- Buy Price: PKR 500-480
- Stop Loss: PKR 470
- Target Price: PKR 580
Analysis:
1. Risk Management: The stop loss is set at PKR 470, which is PKR 10-30 below the buy price range. This seems like a reasonable risk management strategy.
2. Potential Return: The target price of PKR 580 offers a potential upside of PKR 80-100, which translates to approximately 16-20% return.
3. Market Conditions: It's essential to consider current market conditions, trends, and any potential catalysts that may impact UBL's stock performance.
Recommendations:
1. Monitor Market Trends: Keep a close eye on market trends and adjust the strategy accordingly.
2. Set Realistic Targets: Ensure the target price is realistic based on UBL's financial performance and market outlook.
3. Diversification: Consider diversifying your portfolio to minimize risk.

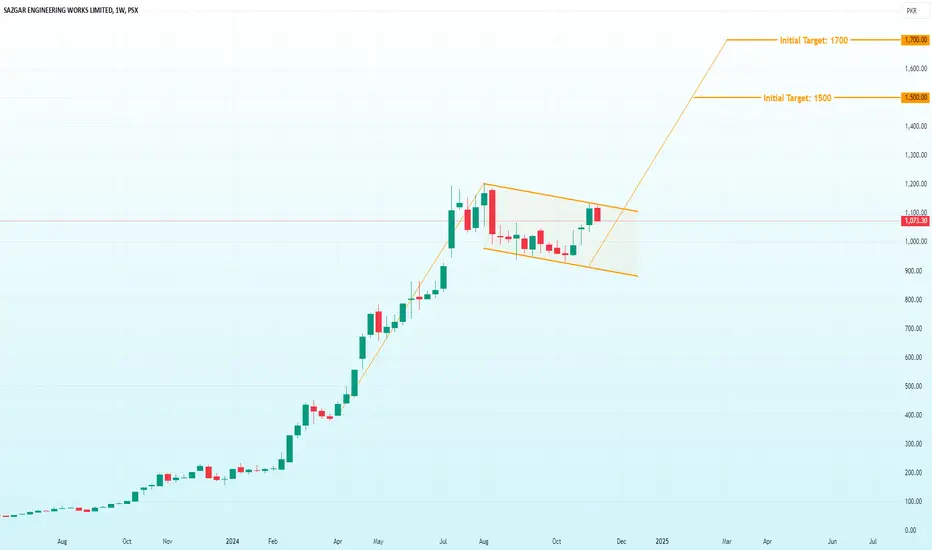
SAZEW | Bullish Flag PatternBack with SAZEW trading idea once again!!!
SAZEW printed a bullish flag pattern with no sign of divergence. A bullish trend continuation is expected, entry is suggested at 1,070 with the stop loss below previous lower high level at 780. Previous top of 1,202 considered as TP1 and after the break out it can leads towards the completion of the pattern, the price can projected towards 1,500 and then 1,700.
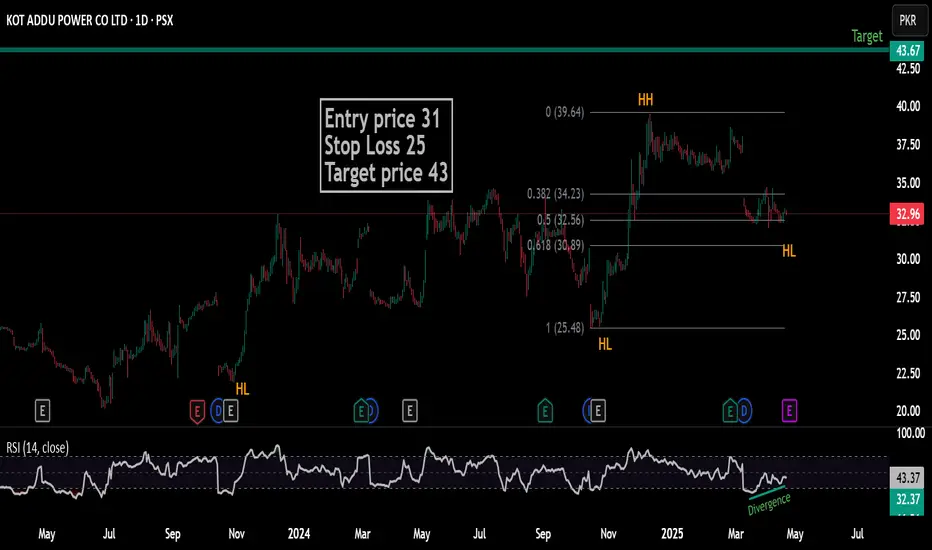
KAPCOTrend is Bulish price retracment at 0.618% Buying entry.
Entry price 31
Stop Loss 25
Target price 43
BBFL BUYING OPPORTUNITYBBFL is in Phase C of Wyckoff Accumulation Range
It is making Higher Lows and Higher Highs on 1H TF
It's expected to breakout of this accumulation zone soon
Buy1 51
Buy2 49
TP1 57
TP2 66
SL 47
