SLGL LONG TRADESLGL has recently completed its 61% correction and has now confirmed its reversal with a Spring in Golden Zone which lies exactly on FVG. It is considered High Probability Trade
Buy SLGL @ 15.1 and 14.2
TP 17.9
SL 12.8

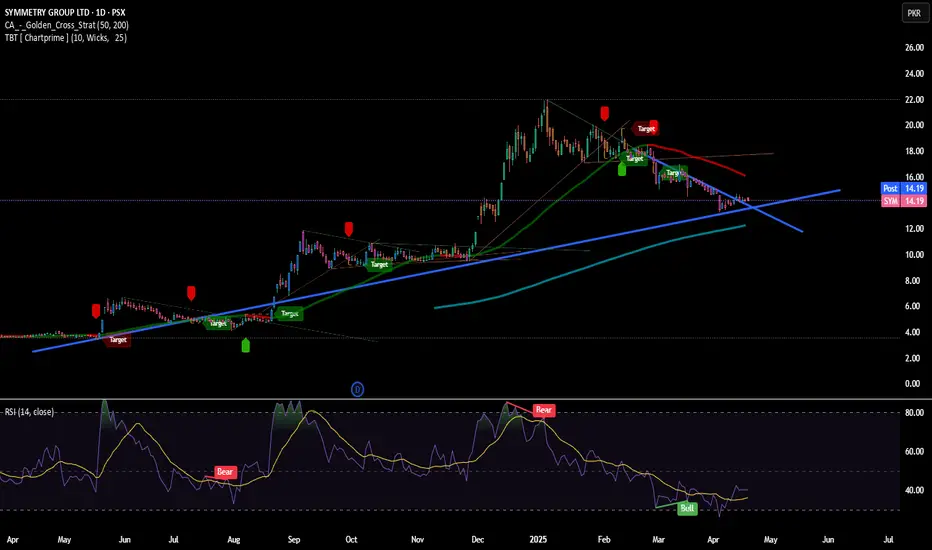
SYMMETRY GROUP LTD LONG IDEAGolden Cross Strategy (50, 200 MA)
Two moving averages are plotted: a 50-day (likely the green line) and a 200-day (likely the blue line).
The current price ₨14.19 is below the 50-day moving average (₨16.11) and the 200-day moving average (₨12.24). This suggests the stock is trading in a weak zone relative to its medium-term trend.
Support & Resistance
Price recently broke below a key upward trendline, shown as a blue diagonal line sloping upwards.
The stock seems to be testing this broken trendline as resistance.
Trade Markers
Several "Target" labels (green and red) appear on the chart, showing past trading signals.
Green icons indicate successful bullish targets; red icons indicate bearish signals or failure to sustain levels.
RSI (Relative Strength Index)
RSI is shown at 40.23, slightly below the neutral 50 level.
There’s also a yellow moving average line for RSI, currently at 36.19.
The RSI has been in a bearish phase since early 2025, with occasional “Bear” and “Bull” signals marked on the indicator. Recently, the RSI made a small uptick, but still stays below the 50 mark, which hints at weak buying strength.
⚡ Insights
Trend Weakness: The price has broken below a long-standing ascending trendline and is struggling to regain that line as support, which is a bearish technical signal.
Bearish Momentum: The RSI is under 50, showing weak bullish momentum and limited buying interest.
Resistance Overhead: The 50-day moving average around ₨16.11 and the downward-sloping trendline are likely to act as resistance in the near term.
Possible Bottom Formation: If the RSI holds above 36 and starts climbing, combined with price stabilizing around ₨14.19-₨12.50, a short-term reversal could happen — but confirmation is needed.
✅ Actionable Takeaways
For Traders: Avoid long positions until the stock breaks above ₨16.11 (50 MA) or shows a clear bullish RSI crossover.
For Investors: If you’re looking for value, watch for a base formation near the ₨12.24 (200 MA) region.
For Short Sellers: As long as the price remains below the 50-day MA and the RSI doesn't cross 50, bearish setups remain favorable.
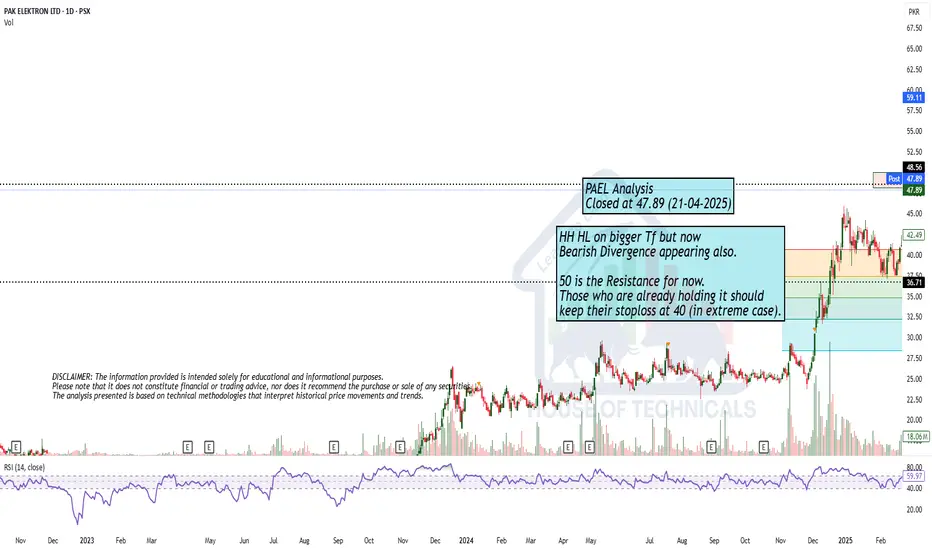
HH HL on bigger Tf but now..HH HL on bigger Tf but now
Bearish Divergence appearing also.
50 is the Resistance for now.
Those who are already holding it should
keep their stoploss at 40 (in extreme case).
Wahn is near to brakout level. Wahn is near to breakout level of 248 and if it crosses 256, it could be a major breakout for flying again.
Use stop loss and this is not a buy sell call, trade at your own will.

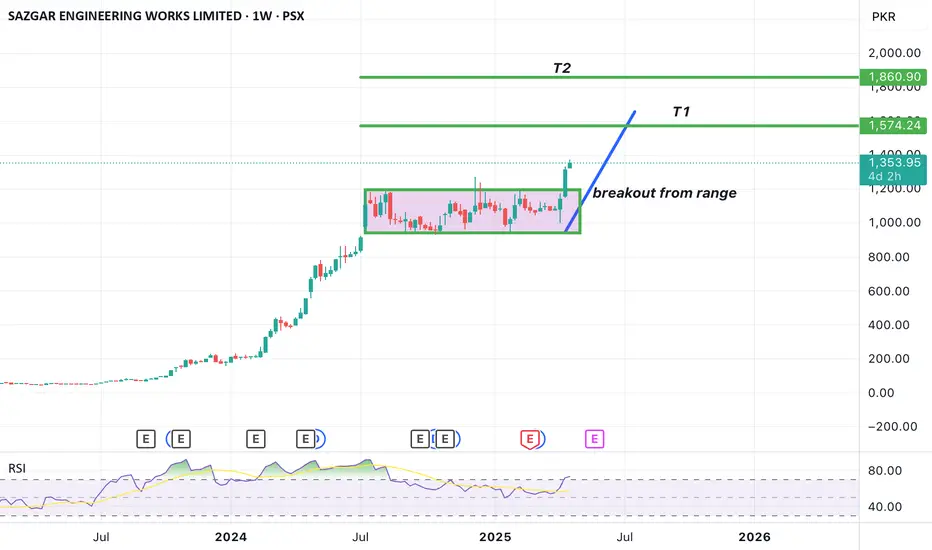
SAZEW SAZGAR PSXSazew has breakout after today strong financial result for Q32025 which is more than 100% and dividend is announced too, due to which it shows great potential for next targets.
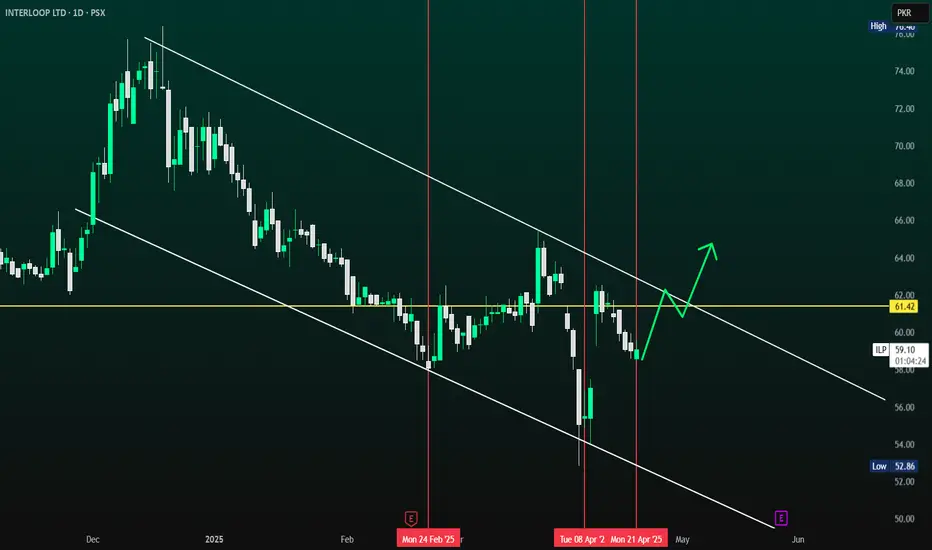
Interloop - ILP: Potential Bullish The chart for Interloop Limited (ILP) shows the stock currently trading within a downward-sloping channel, with clear support at 59.14 (marked by the yellow line) and resistance at 61.42. The price has been consistently testing the lower boundary of this channel, and the support level at 59.14 has held in the past, indicating it could offer a potential bounce. If the stock manages to hold above this support, it could initiate an upward move.
A breakout above 61.42 would be a strong bullish signal, suggesting the stock could continue to rise towards the next resistance levels around 64.00 or higher. However, if the price fails to maintain support at 59.14, it could slide further down to 52.86, marking the next significant support level.
Overall, the stock is in a downtrend, but the current setup provides an opportunity for a potential reversal if it successfully breaks the resistance and holds above support.
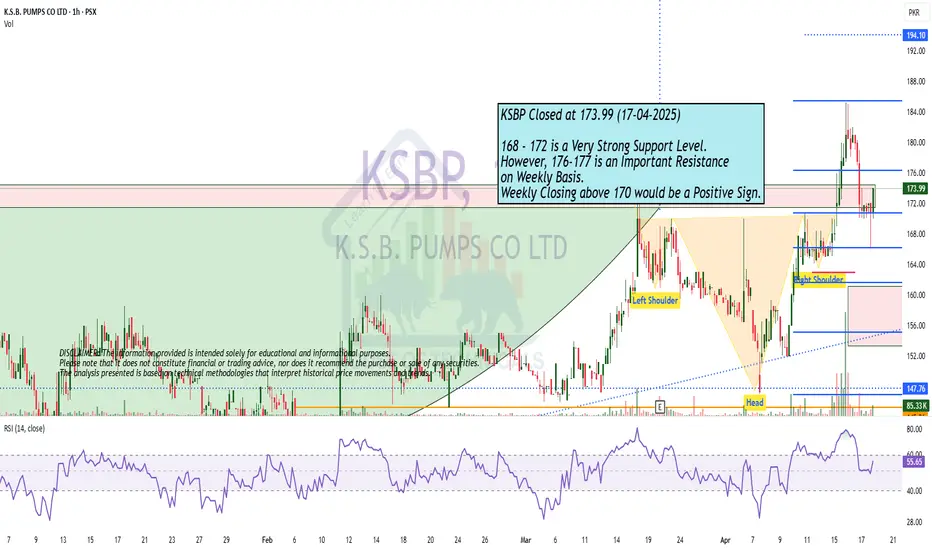
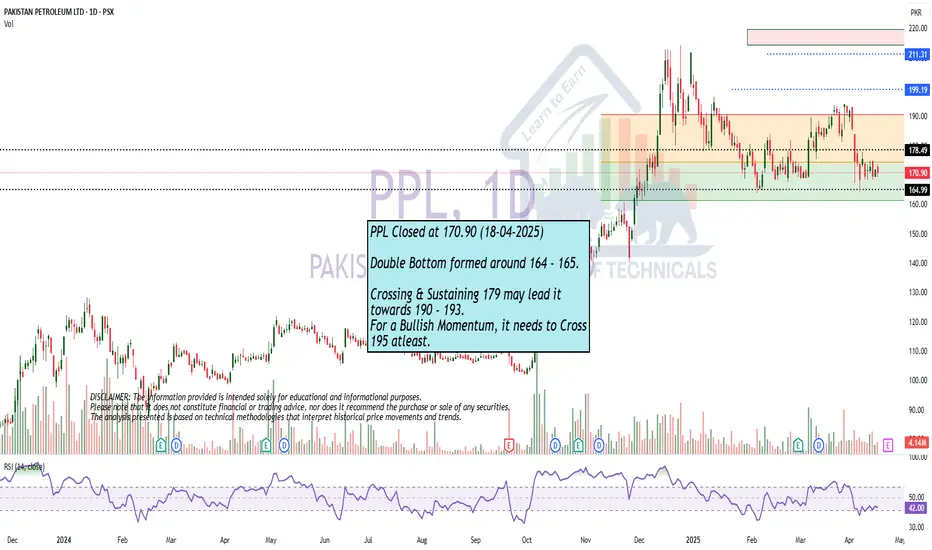
Good Support168 - 172 is a Very Strong Support Level.
However, 176-177 is an Important Resistance
on Weekly Basis.
Weekly Closing above 170 would be a Positive Sign.
Bullish on All Time Frames; butBullish on All Time Frames; but
Strong Resistance lies around 12 - 12.20
Those who are Holding, Must Trail their
Stoploss to 10.30 (at least)
Though there is Hidden Bullish Divergence, but
Strong Resistance is lying ahead.
Those who want to Take Fresh Entry, should
wait for 12.20 to Sustain.
One thing to note is a Bearish Divergence on
Daily TF. But since this is on Daily TF, so slight
Pressure may bring buying Opportunity (as long as
it stays above 8.)

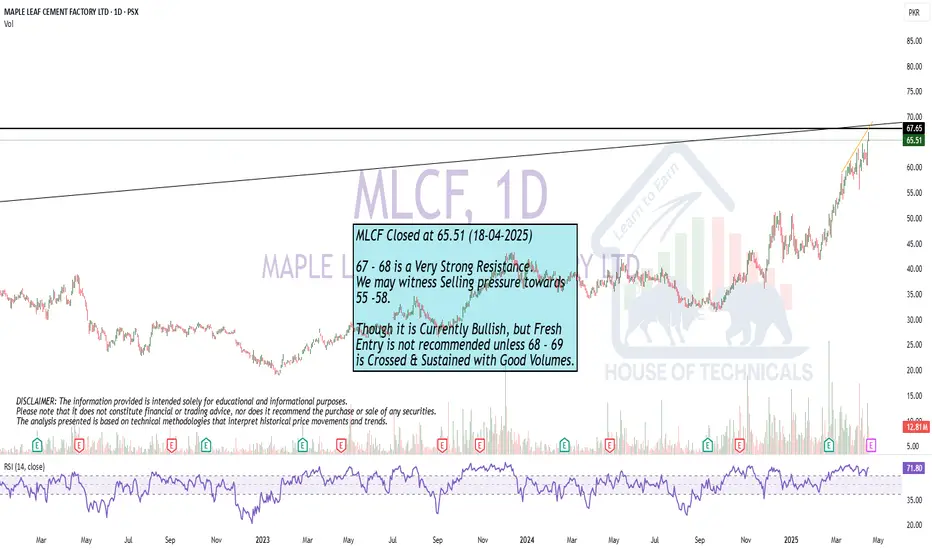
Currently Near Resistance.67 - 68 is a Very Strong Resistance.
We may witness Selling pressure towards
55 -58.
Though it is Currently Bullish, but Fresh
Entry is not recommended unless 68 - 69
is Crossed & Sustained with Good Volumes.
Cyan is above breakout level of 33.27Cyan is above breakout level of 33.27 and expected to cross 45 and 50 levels.
Note: This is not a buy/sell trade call. Trade at your own will. Use stop loss too.

Berg is above breakout level of 102.62Berg is above breakout level of 102.62 and may cross 120 and 140 levels.
Note: This is not a buy sell trade call. Trade at your own will. Use stop loss.

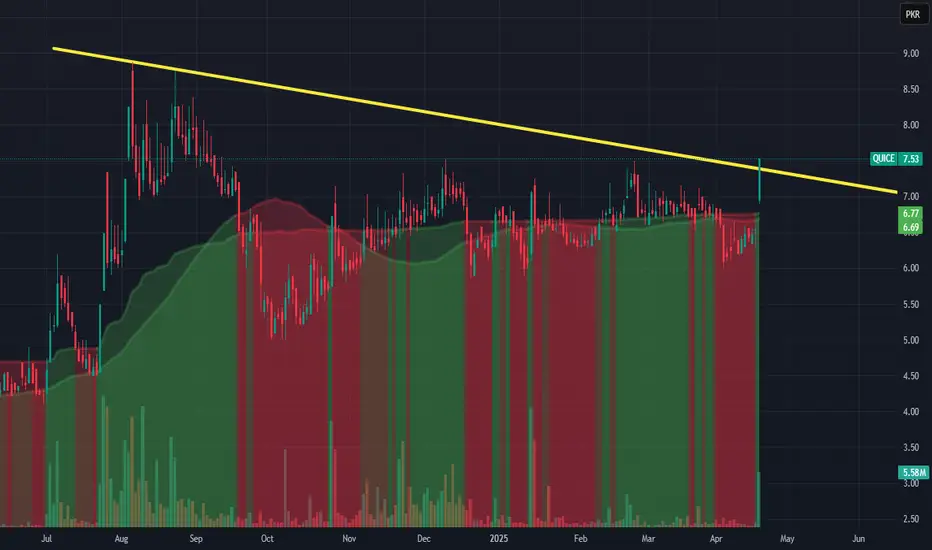
Quice is above breakout level of 6.73Quice is above its breakout level of 6.73 and it crosses trendline too. It can cross level of 8 and 10.
Note: This is not a buy sell call. Use stop loss too.
Mtl is above breakout level of 624Mtl is above breakout level of 624, and it is expected to cross 650 and 700 level.
Note: this is not a buy sell trade call. Trade at your own will and use stop loss.

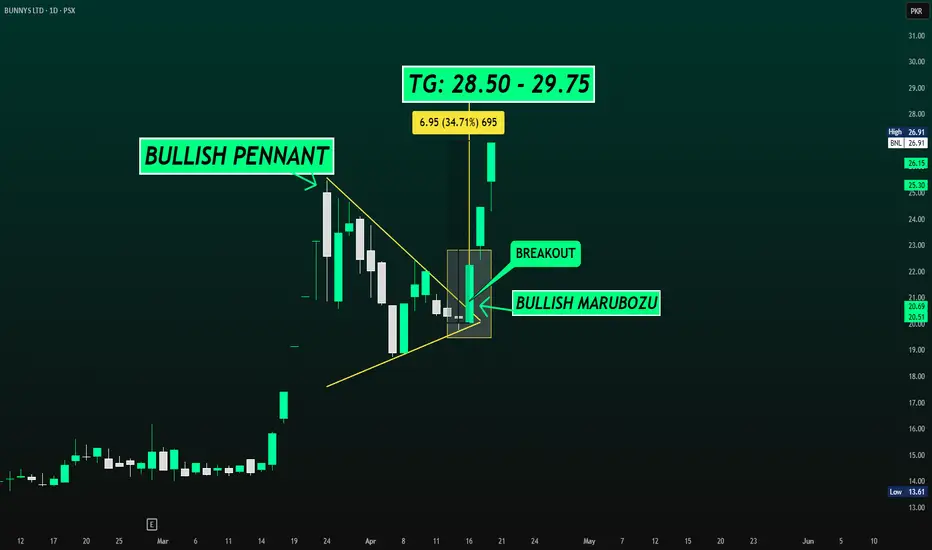
BNL - MULTIBAGGER ??
Current Price: 22.24
Chart Setup: Bullish Pennant and Breakout Pattern
BNL (Bunny's Ltd.) is currently showing a bullish pennant pattern, which is a continuation chart pattern that suggests a potential breakout to the upside. The price has been consolidating after a strong rally, forming a symmetrical triangle or pennant shape, with the upper boundary acting as resistance and the lower boundary as support. The breakout from this pattern is typically a sign of further upward momentum.
First Target (50% Extension): Once the breakout happens, the first target range for BNL could be around 25.48, followed by a potential move toward 28.50 in the medium term.
Extended Target: If the breakout holds and the bullish momentum continues, BNL could test higher resistance zones around 30.00–32.00 in the long term.
BNL OUR FIRST CALL INITIATED @ 14 LEVELS IN MARCH
GHNI - CONTINUES TO B UPWARD, IS IT HEADING FOR 1000+ ???
Current Price: 764.04
Chart Setup: Uptrend within an Ascending Channel
Ghandhara Industries Ltd. (GHNI) has been experiencing a strong bullish trend, moving within an ascending channel over the past year. The stock has shown significant upward momentum, consistently bouncing between the support and resistance levels of the channel. Currently, it is nearing the upper resistance line, suggesting that further upside could be expected if the trend continues.

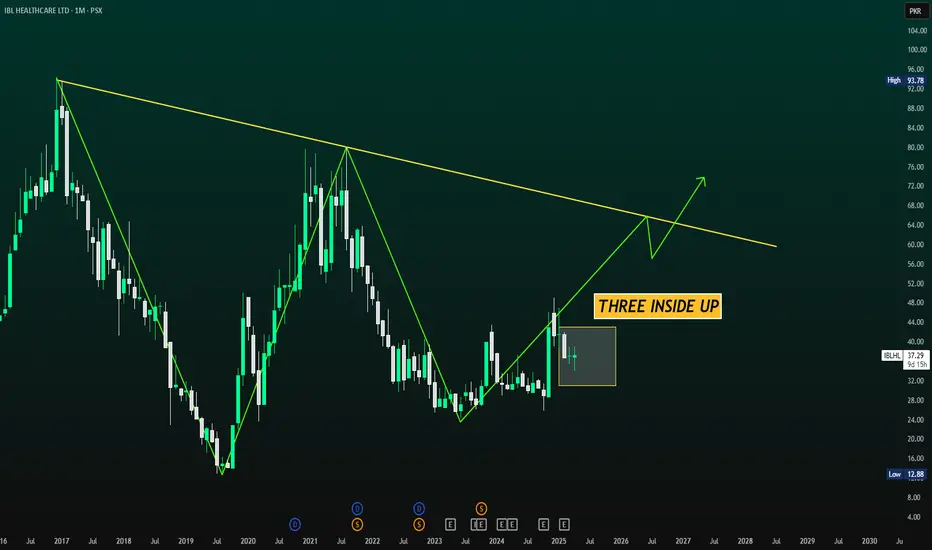
IBLHL (MONTHLY) - THREE INSIDE UP IBL Healthcare Ltd. (IBLHL) is showing significant bullish potential after a long downtrend, with a "Three Inside Up" candlestick pattern forming at the bottom of the trend. This pattern suggests a potential reversal to the upside after a prolonged period of decline, and it signals strength as the buyers are beginning to take control.
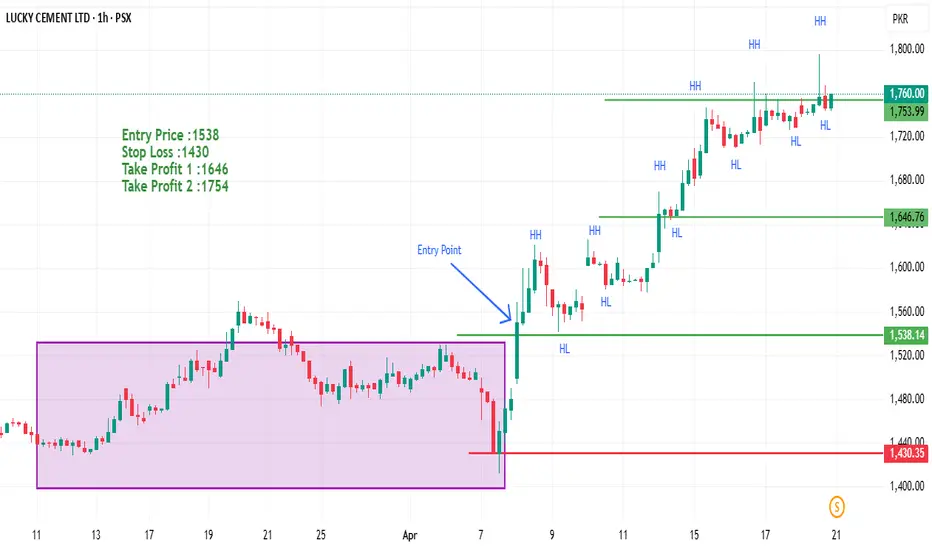
LUCKY cement Lucky cement gave break out and started making a bullish trend as per the principles of Dow theory.It is making new higher highs and higher lows while sustaining a good upward movement.
PSX: INIL Outlook INIL about the complete the consolidation phase and breakout confirm will start from channel breakout by sustaining above 164 level then breakout with strong candle 172 level for further confirmation.
Entry : 172
TP1: 190
TP2: 208
TP3: 226

LOADS--- a Short Term Yet Powerful Trade Loads is offering a powerful Buy Set-up with following confluences:
1. Pirce has broken out range and re-tested it.
2. Re-test of Breakout range with healthy price action (Pin-Bar)
3. Surge in Volume after a bounce-off price from breakout zone.
4. MACD & RSI have generated a Buy Signal.
5. Rejection of Price at lower boundary of BB.
Target Prices are 19, 21 & 25.

DGKC Long positionI shared the graph earlier where DGKC achieved all my targets from 82 to 107.
Now it has retraced at a very good rate, getting a 30% to 40% gain.
Stop Loss is 89 and targets are 126 and 133.

Double Bottom formed around 164 - 165.
Double Bottom formed around 164 - 165.
Crossing & Sustaining 179 may lead it
towards 190 - 193.
For a Bullish Momentum, it needs to Cross
195 atleast.
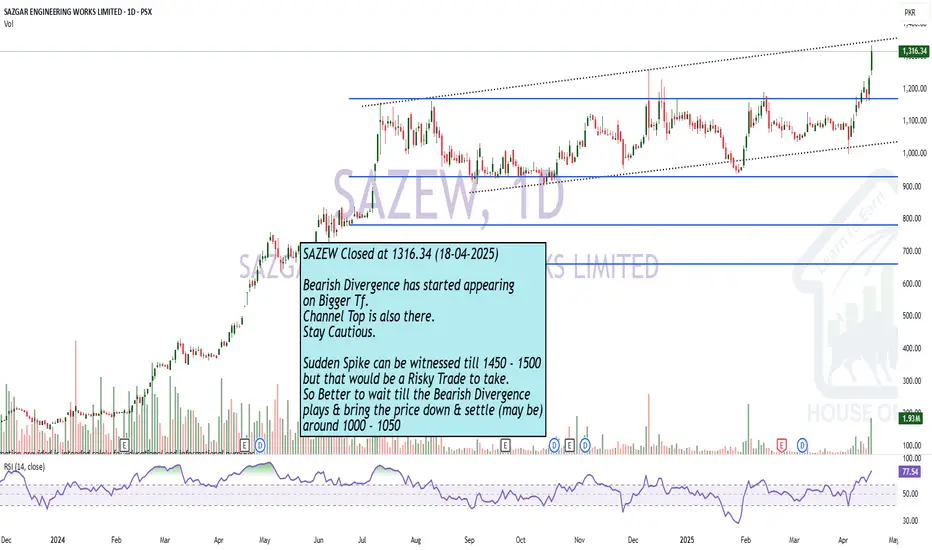
Bearish Divergence has started appearing
Bearish Divergence has started appearing
on Bigger Tf.
Channel Top is also there.
Stay Cautious.
Sudden Spike can be witnessed till 1450 - 1500
but that would be a Risky Trade to take.
So Better to wait till the Bearish Divergence
plays & bring the price down & settle (may be)
around 1000 - 1050
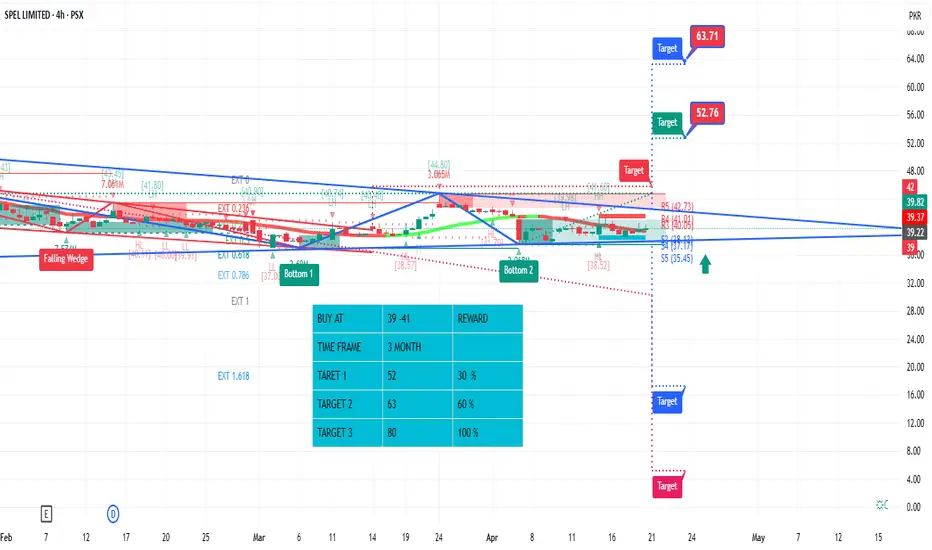
SPEL-LONGAfter a long consolidation now the time is pull up towards new High in time purchase and hold with patience then take rewards is the key of success.