TRG LONGTERM ANALYSIS AND NEW ALL TIME HIGH COMINGTRG has been in Pullback since May 2021 when it posted its ATH of Rs 186.
It has reached 78% level of retracement and is rebounding from !M FVG(Fair Value Gap).
It is very much likely to start a long term bullish move after it crosses Rs74 level to make new high of Rs 230 In Sha Allah

HASCOL LONG TRADEHASCOL has given breakout of previous channel ( blue ) and has now switched to new channel (yellow). It has completed 50% retracement of the breakout. I t is expected to rebound from current level or nearby FVG (Fair Value Gap) after going through spring/bear trap. It'll be a good buy only after some bullish confirmation. For now it is wait and watch strategy

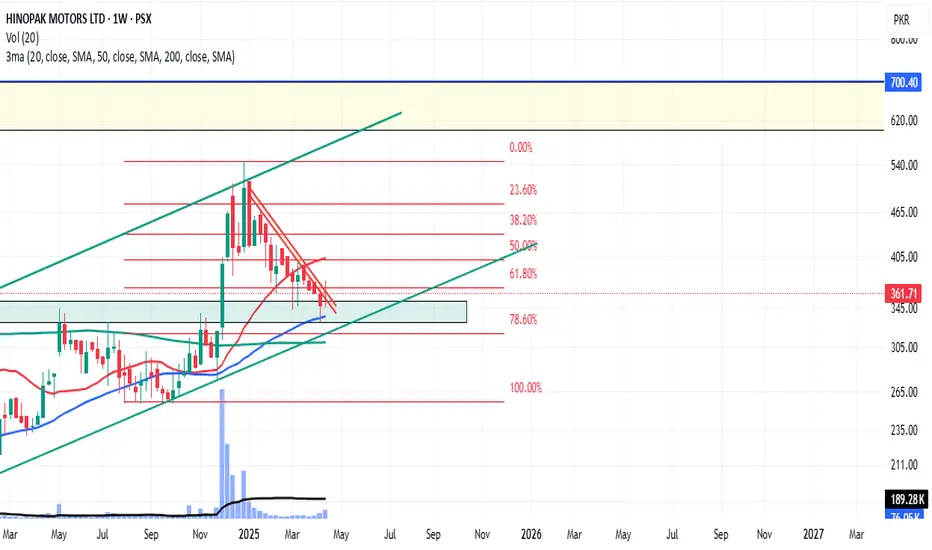
HINO--- A High Probability BUY SwingTradePrice is currently at a High Probability Buy Zone with Target at 544 & 600. Confluences include:
1. BB-50 (Base line Retest and Rejection) on weekly TF.
2. RBS Zone overlapping with 61.80% to 78.6% Fib. zone.
3.Strong MACD Signal.
4. Surge in Volume on Daily TF at a key support area.
5. SL below 322
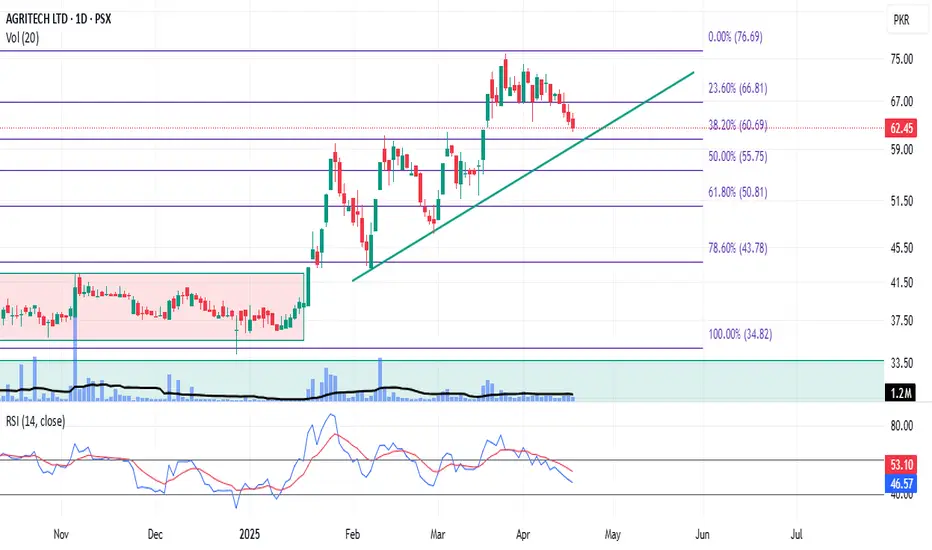
AGL -----Buy on the dip is coming up!Price is currently testing TL of daily TF for 3rd time.
There is possibility of fake breakout of this TL with price forming a pin-bar at TL on daily TF.
Once Price gets a bounce, a Buy around 56 to 60 with Target @ 76 is expecteed.
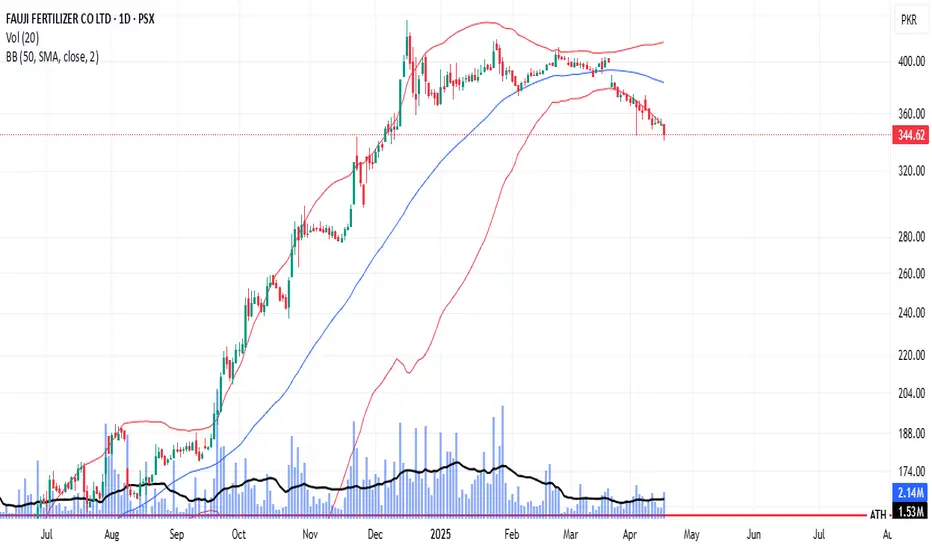
FFC- Deeper Retracement is Expected !Reasons for Deeper Retracements are :
1. 20, 50 & 200 SMAs are converging.
2. RSI on daily TF is below 30 which signifies Bearish Trend
3. Weaker Price Action at Recent Swing High is signalling Profit Taking activity is taking place.
Way Forward:
1. Observe Price Action once price tests 200 SMA and 78.6%% Fib. Level.
2.If a Bullish signal (Engulfing, Pin-Bar with surge in Volume) is observed, a good probability trade is on the cards.
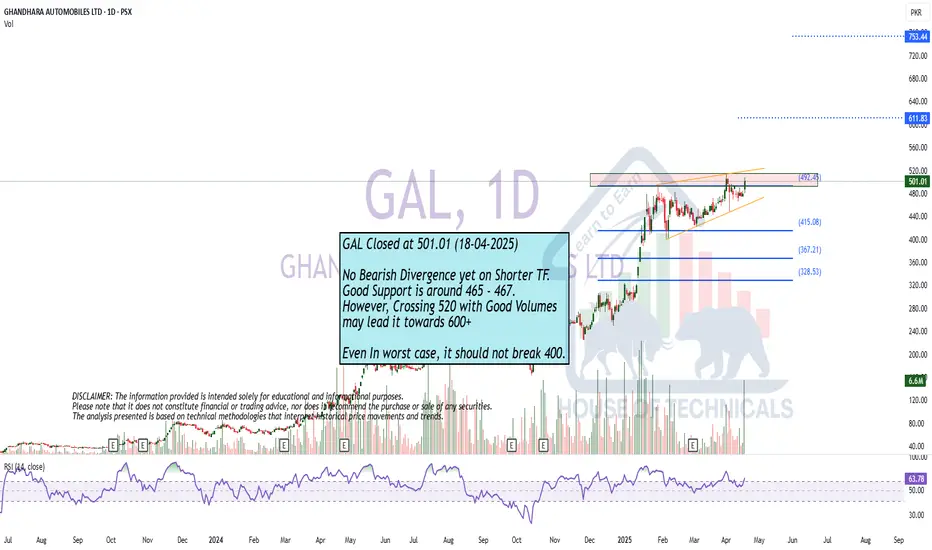
No Bearish Divergence yet on Shorter TF.
No Bearish Divergence yet on Shorter TF.
Good Support is around 465 - 467.
However, Crossing 520 with Good Volumes
may lead it towards 600+
Even In worst case, it should not break 400.
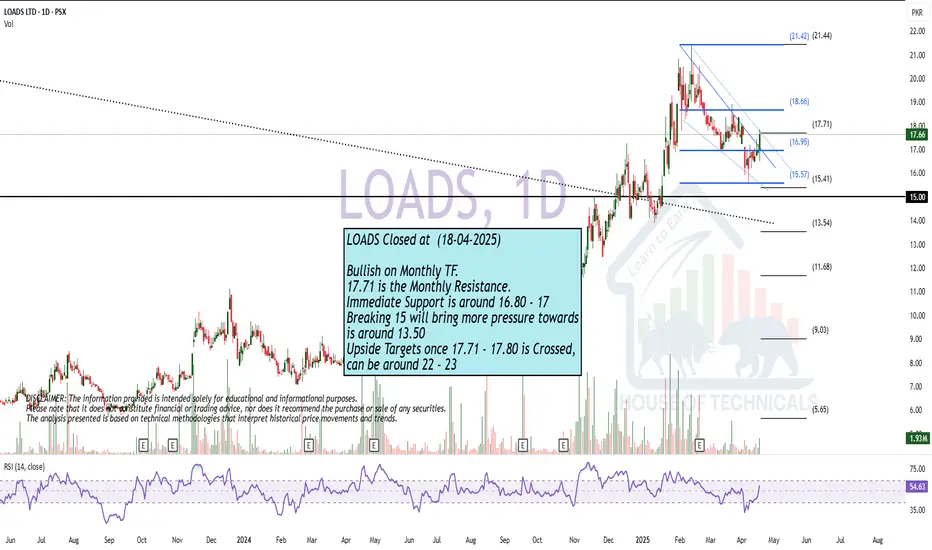
Bullish on Monthly TF.
Bullish on Monthly TF.
17.71 is the Monthly Resistance.
Immediate Support is around 16.80 - 17
Breaking 15 will bring more pressure towards
is around 13.50
Upside Targets once 17.71 - 17.80 is Crossed,
can be around 22 - 23
Hidden Bullish Divergence on Weekly TF.Hidden Bullish Divergence on Weekly TF.
Crossing & Sustaining 44.20 may lead it
towards 55 initially & then towards 65 -70 -80
if there wont be any Bearish Divergence.
But if it closes below 30, more Selling Pressure
can be seen.

No Bearish Divergence on Monthly Tf.No Bearish Divergence on Monthly Tf.
But 39-40 is a Very Strong Resistance
that needs to Cross & Sustain with Good Volumes to
reach 45 - 46 & then 50+
We should not ignore that it has taken Support
from a Very Important Fib level around 32.40
Monthly Closing above 33.60 would be a Very Healthy sign.
So any dip towards 32.50 - 33.50 can be a Buying Opportunity.
However, it should not break 31.80 otherwise we
may witness further Selling Pressure towards 28.50 - 28.70

Play Wisely
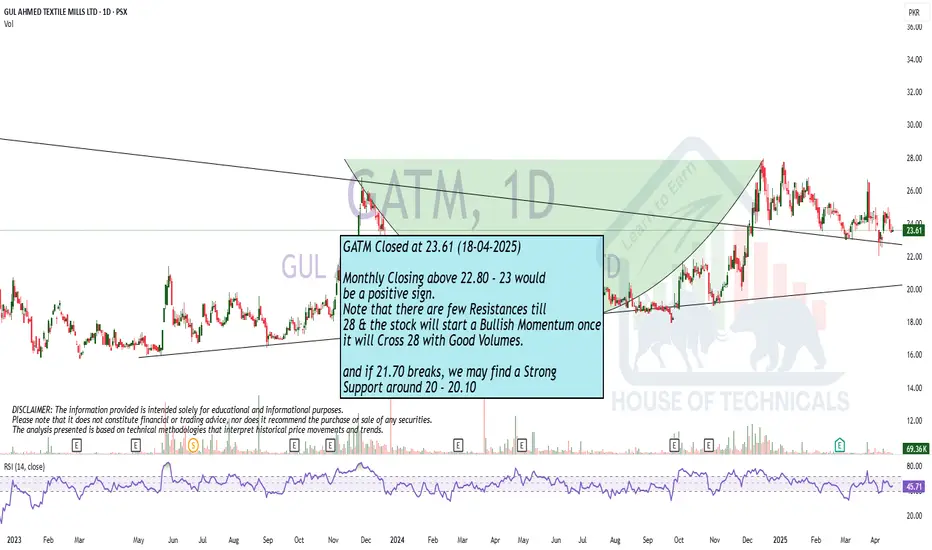
Monthly Closing above 22.80 - 23 would
be a positive sign.
Note that there are few Resistances till
28 & the stock will start a Bullish Momentum once
it will Cross 28 with Good Volumes.
and if 21.70 breaks, we may find a Strong
Support around 20 - 20.10
Defined Resistance Zone465 - 502 is a Resistance Zone.
Those who are already holding it, should keep
the Stoploss of 339.
Fresh Entrants may wait for 502 to Cross & Sustain
targeting 545 - 550 & then 600 - 650.

Monthly Closing MattersCurrently at a Good Support. Monthly Closing
above 10.85 would be a Positive Sign.
However, 11.25 is also a Double Top.
So, in my view, let it Cross & Sustain 11.25
for further Upside towards 12.50 - 13 initially.

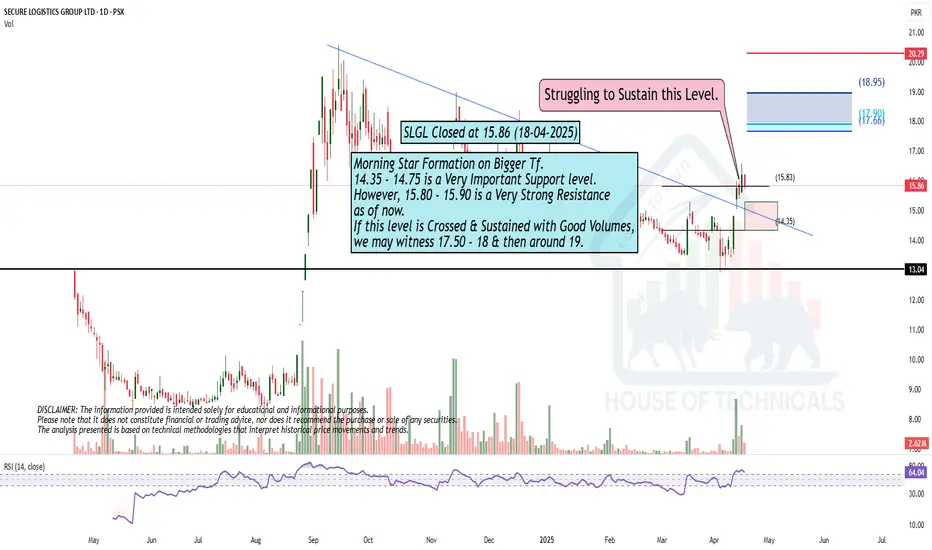
Morning Star Formation on Bigger Tf.Morning Star Formation on Bigger Tf.
14.35 - 14.75 is a Very Important Support level.
However, 15.80 - 15.90 is a Very Strong Resistance
as of now.
If this level is Crossed & Sustained with Good Volumes,
we may witness 17.50 - 18 & then around 19.
ASL Setup Elliot WaveASL elliot wave setup is forming 3 top pattern and in triangle if we buy we can turn profit for PSX.
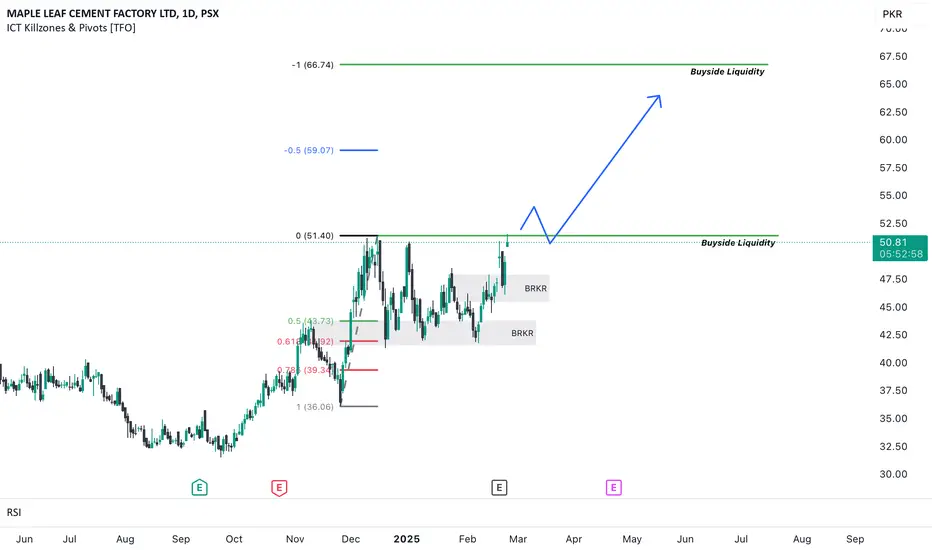
MLCF Bullish ideaMLCF pullback from OTE & breakers 2 time.
Bull flag created as well.
Targetting -1 fib.

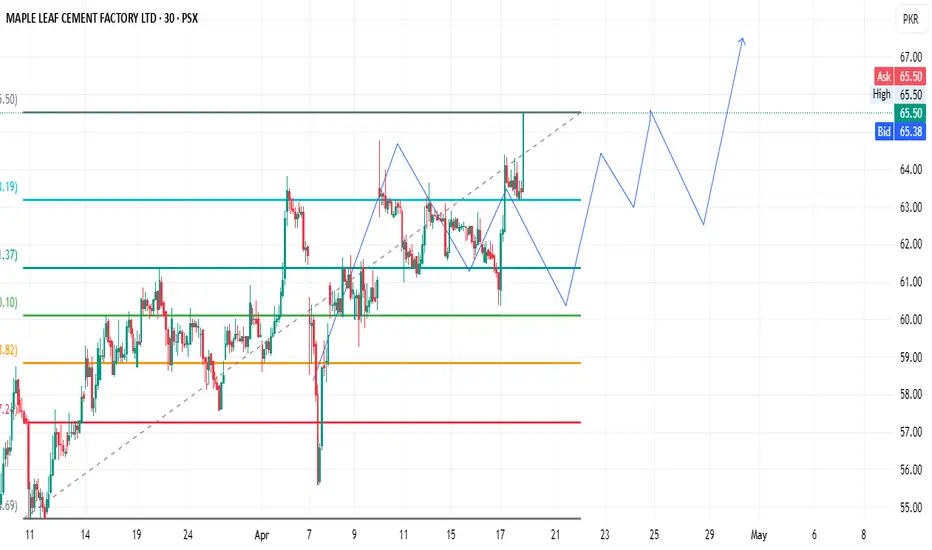
Trade Item MLCF 18/04/2025 Analysis Time 03:47 AM📈 MLCF (PSX) – Strong Buy Alert!
🗓️ 18/04/2025 | ⏱️ 30-Min Timeframe
MLCF is looking bullish with solid momentum on the 30-min chart. Great opportunity for short-term traders!
💸 Buy Range: 62.50
🎯 Target: 67.40
🛑 Stop Loss: No Stop Loss (High-risk, high-reward strategy)
Technical indicators are showing strength, and volume is backing the move. Watch closely for confirmation and breakout continuation.
🚀 Trade at your own risk. This is not financial advice.
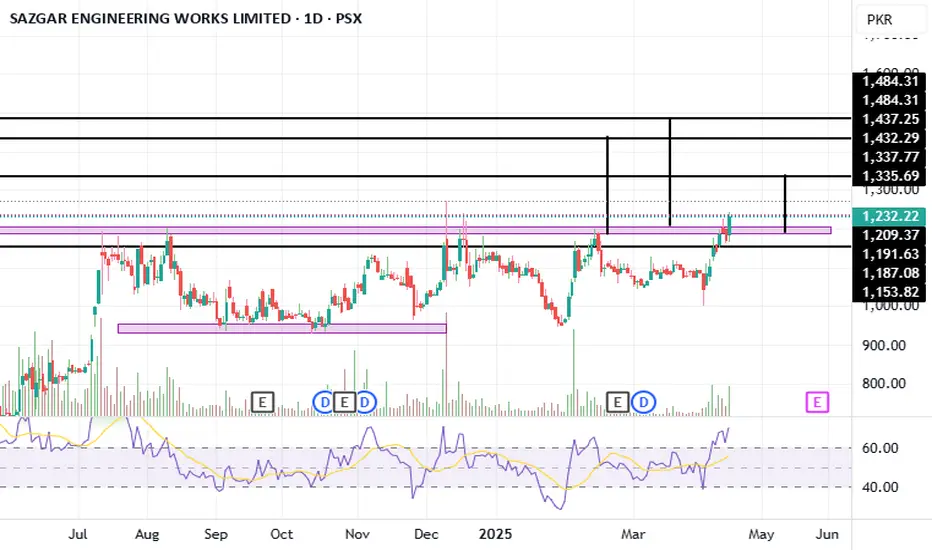
SAZEW Share StrategySazew Buying Strategy:
Key Levels:
1. Breakout level: 1232
2. Stop loss: 1150
3. Targets:
1. 1335
2. 1430
3. 1485
Strategy:
1. Buy after breakout: Enter the trade after Sazew closes above 1232.
2. Risk management: Set a stop loss at 1150.
3. Profit targets: Aim for 1335, 1430, and 1485.
Considerations:
1. Trailing stop loss: Consider using a trailing stop loss to lock in profits.
2. Sustaining above targets: If the price sustains above the final target, consider holding for further gains.
This strategy is based on the provided information. Always conduct your own research and consider consulting a financial advisor before making investment decisions.
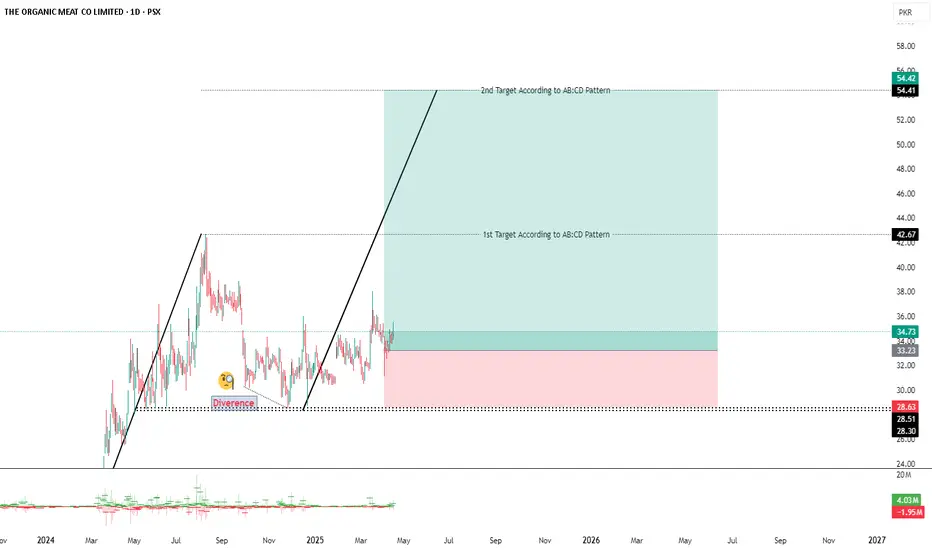
The ORGANIC MEAT CO LIMITED
1) TOMCL bounce back from gold number of fab retracement currently following AB:CD pattern on daily, weekly, & monthly time frame.
2) Showing uptrend from gold numbers of fib, we can expect uptrend continue and achieve its future targets.
3) Created divergence on daily time frame, from that divergence on daily time frame share price showing uptrend.
4) Trend line define uptrend on daily, weekly, & monthly time frame.
5) This share in past increased too much in days of Bakra Eid, so currently we expect good move in recent future.
6) Super trend also confirmed uptrend and it look will continue.
7) According Elliot wave theory, it is creating 3rd wave that means uptrend continue further
Need a patience for achieving targets and behave like a professional trader.
Target 01 (42.64) Target02 (54.41)
Stop loss (28.63)
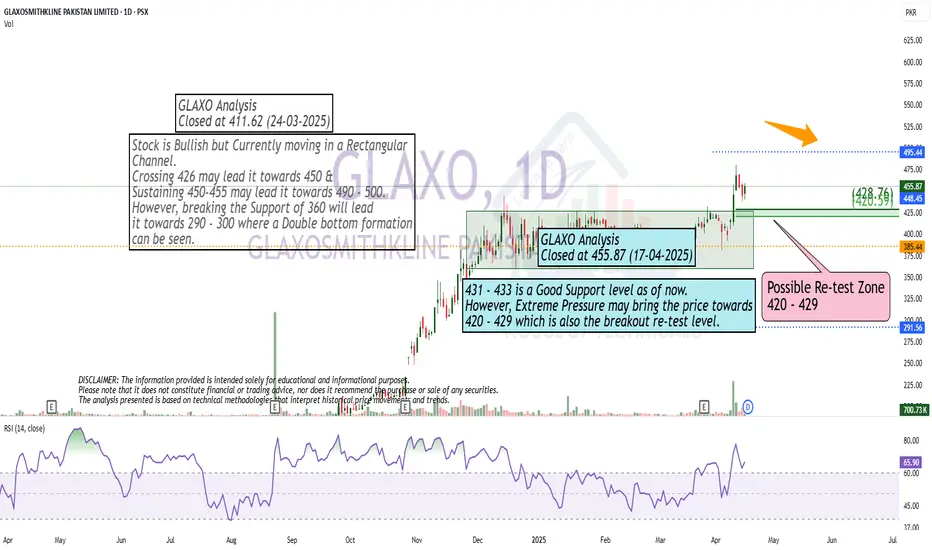
Breakout Retest Possible?431 - 433 is a Good Support level as of now.
However, Extreme Pressure may bring the price towards
420 - 429 which is also the breakout re-test level.
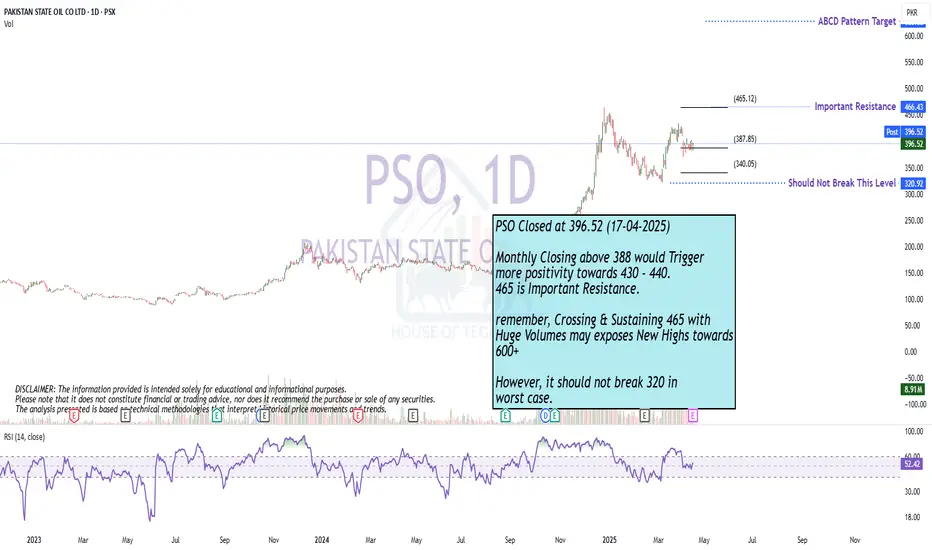
ABCD Pattern Intact
Monthly Closing above 388 would Trigger
more positivity towards 430 - 440.
465 is Important Resistance.
remember, Crossing & Sustaining 465 with
Huge Volumes may exposes New Highs towards
600+
However, it should not break 320 in
worst case.
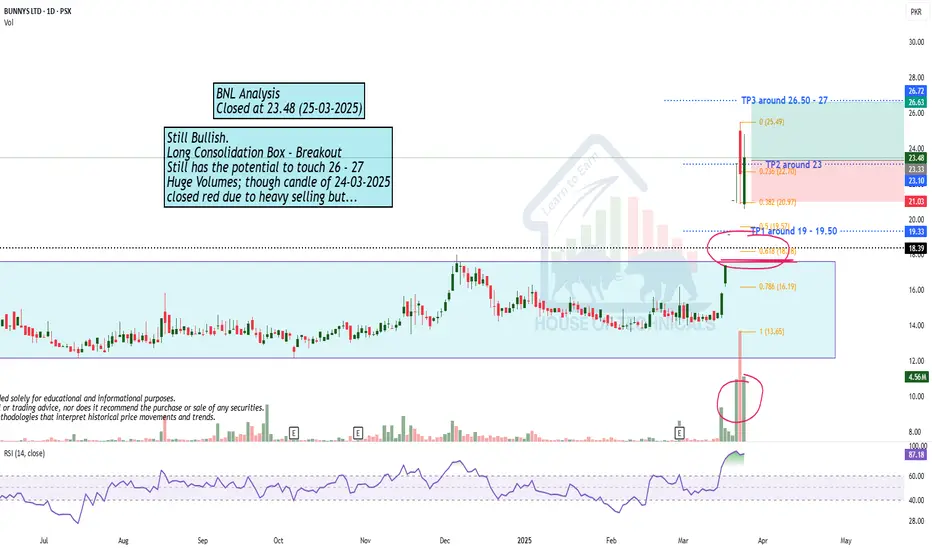
Still Bullish.Still Bullish.
Long Consolidation Box - Breakout
Still has the potential to touch 26 - 27
Huge Volumes; though candle of 24-03-2025
closed red due to heavy selling but...
Bullish momentum in ENGROH Confluences include:
1. RBS zone (Marked on Chart).
2. 78.6% fib level support
3. VSA suggests absorption of large orders at current price level
Price may test 190 to 200
