TPLP montly Bull Flag BOTPLP Bull Flag Pattern BO with target 45.51 (100%) and 50% Target 28.52.
There is very strong resistance at 20.55
But first it have to BO the resistance of 15.97.
Its current price is around 200 SMA
This is not a trade call but just an educational purpose

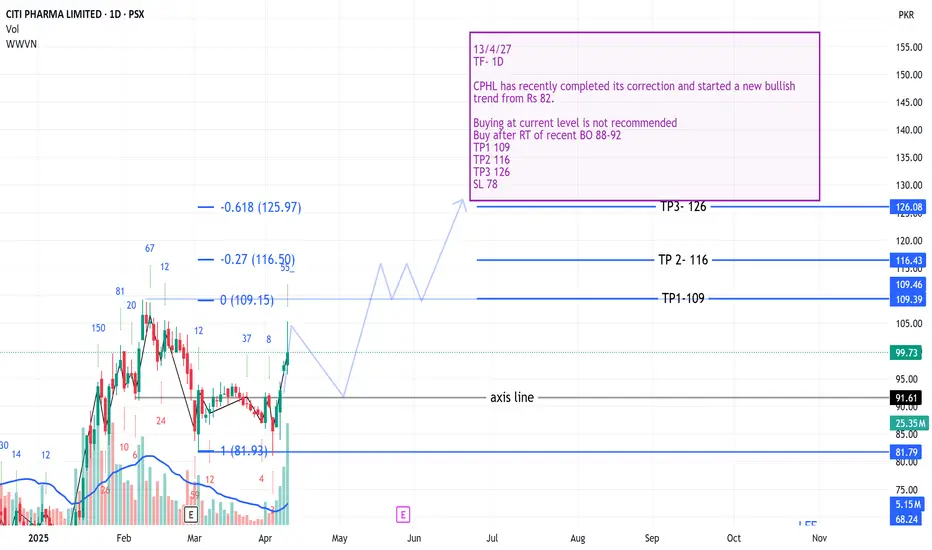
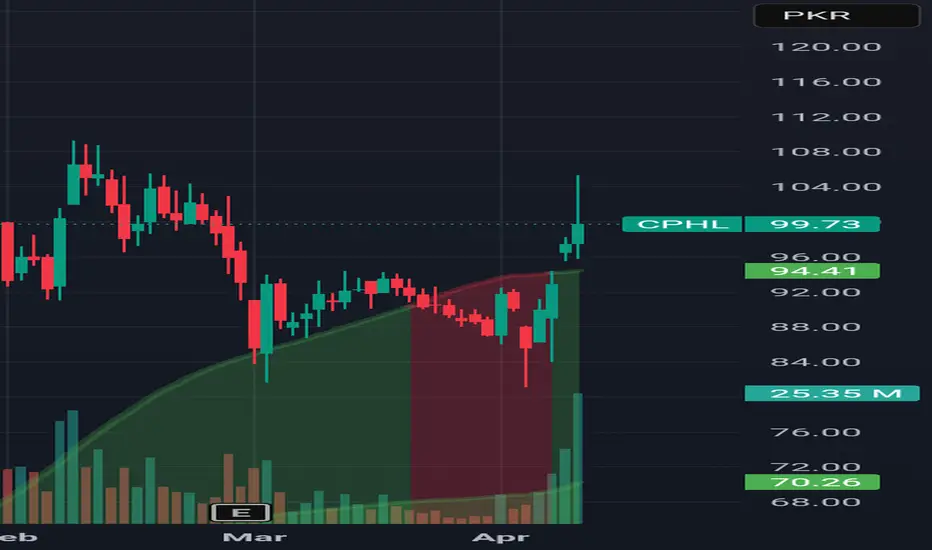
CPHL Analysis-Long Trade13/4/27
TF- 1D
CPHL has recently completed its correction and started a new bullish trend from Rs 82.
Buying at current level is not recommended
Buy after RT of recent BO 88-92
TP1 109
TP2 116
TP3 126
SL 78
Efert Analysis- Bear Trap13/4/25
TF 1W/1D
Efert was trending inside a bullish channel since Oct 23
Although it has given a breakdown from the channel but this move can convert into Spring or Bear Trap. It will be confirmed with a daily closing above 190 within next 3 days
Buy 192-199
Short term TP 229 & 248
Long term TP 310 ( Oct 25)
In Sha Allah
SL below 180

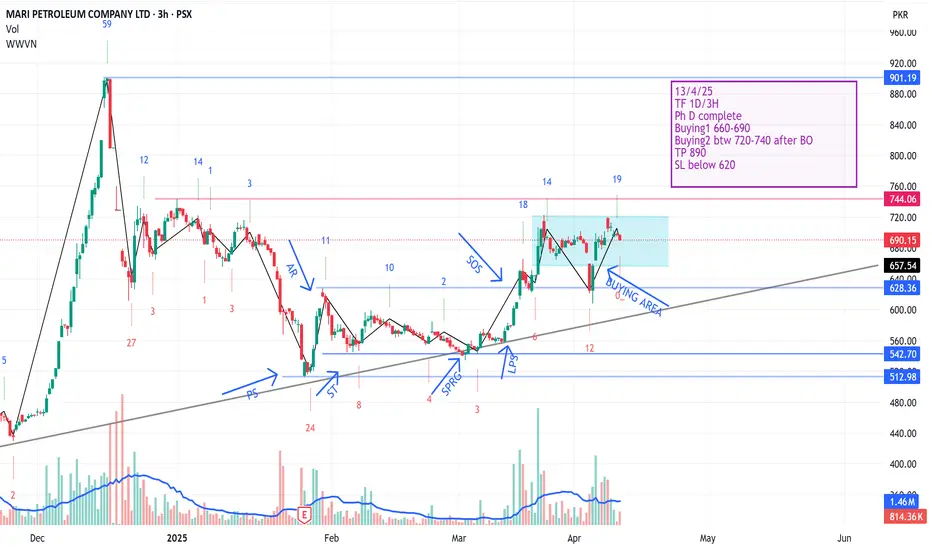
MARI Analysis- Long Trade13/4/25
TF 1D/3H
Ph D complete
Buying1 660-690
Buying2 btw 720-740 after second BO
TP 890
SL below 620
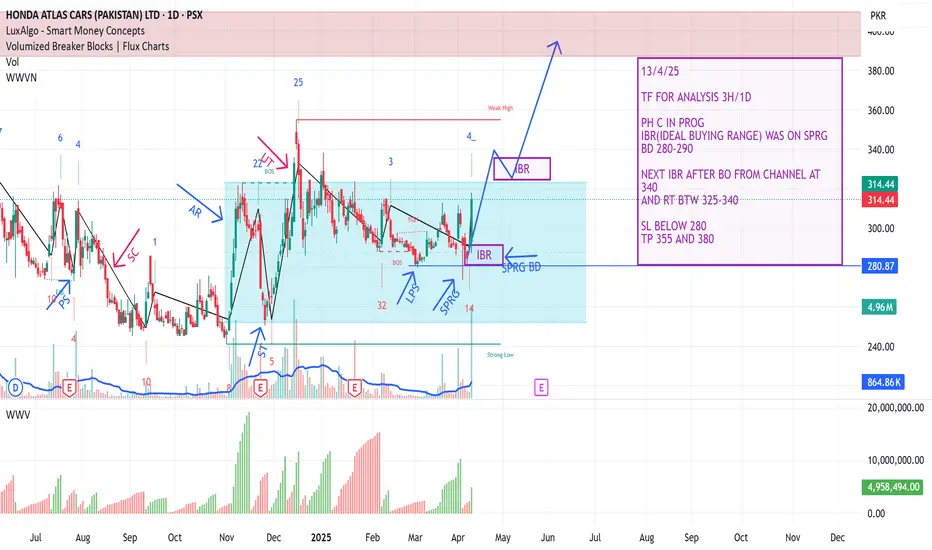
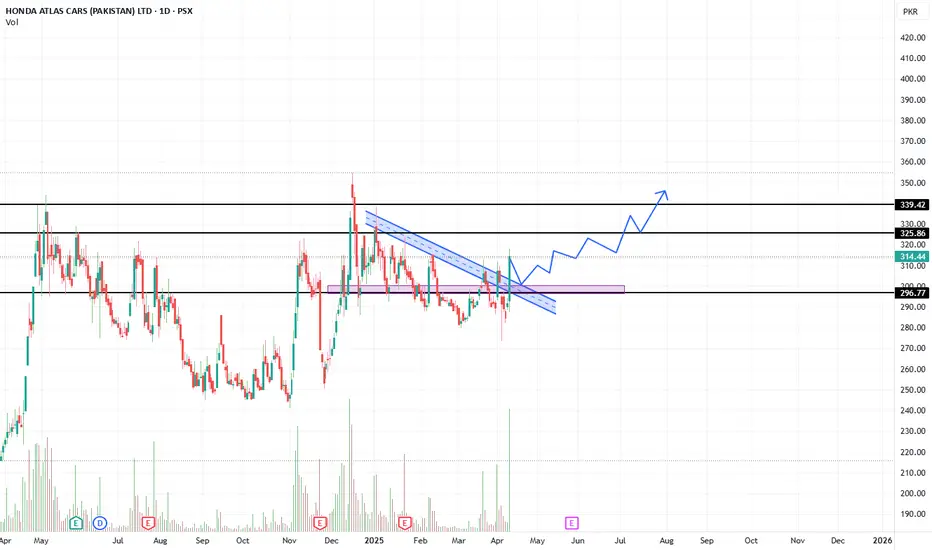
HCAR ANALYSIS- BUY CALL 13/4/2513/4/25
TF 3H/1D
PH C in prog
IBR(Ideal Buying Range) WAS ON SPRG BD 280-290
Next IBR after BO from channel at 340
and retest btw 325-340
SL below 280
TP 355 & 380
SAZEW Weekly ChartBull Flag BO at 1040, Pole Length price change 990.13 in 175 days was added to BO 1040 Result in 100% Target rate 2063 that hypothetically achieved on 28 July 2025 where as 50% Target 1568.87 have to be achieved hypothetically on 05 May 2025
This is not a Trade call. This is just for educational purpose only.

Wait for a Proper Support!Wait for some Bullish Candles to appear at Support level with Good Volumes.

Impact of Split sharesBearish Divergence on Daily basis.
Split Shares.
Important Supports:
S1 1535 - 1565
S2 1427 - 1430
S3 1360 - 1365

Wait for a Bullish Sign!Important Support Zone
166 - 184
Somewhat Bullish on Monthly TF,
But if 180 breaks,we may witness
further selling pressure.

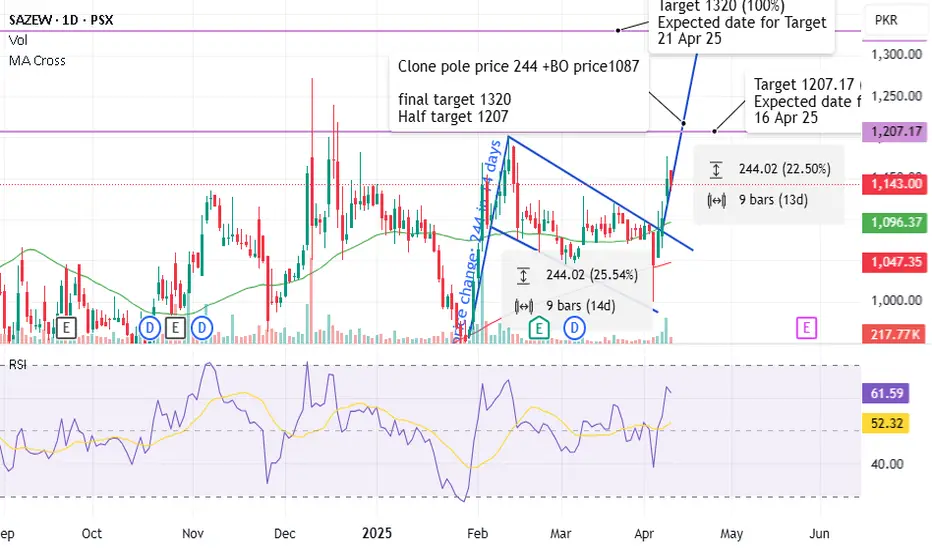
SAZEW Bull Flag Pattern Target Idea.SAZEW Uptrend starts on 28 Jan 2025 and in 14 working days go maximum. Then start downword and move up and down in a range that range BO at 1087 rate and current rate is 1141.
Flage Pole price change is 244 which was added to BO price giving target of 1320 (100%), Half of Target at 50% would be 1207 that expected to be achieved on 16 April 2025, where Final Target have to be achieved hypothetically around 21 April 2025
This is Daily Chart working and everyone have to do his own working for trade of buy or sell.
This is not for trade purpose but only for educational purpose
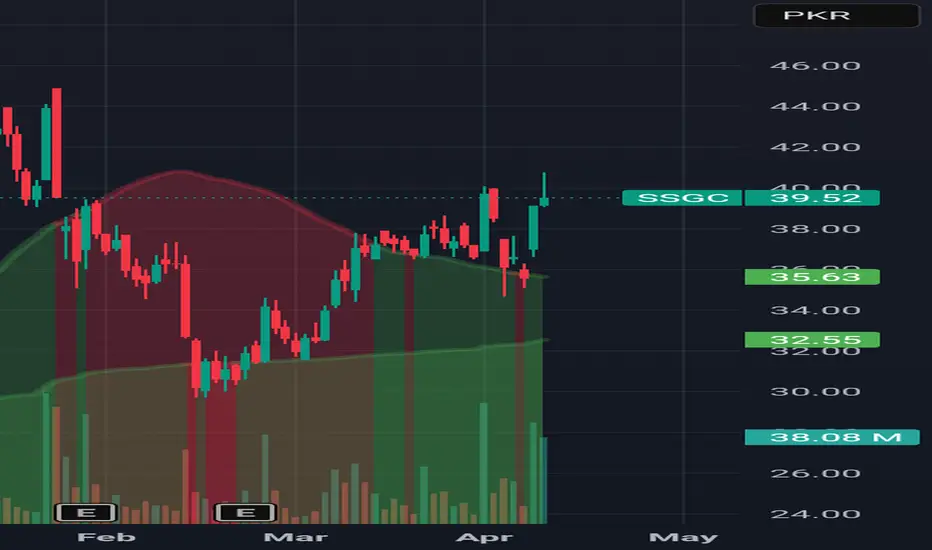
SSGC-PSX, A Good Probability Buy TradeConfluences include:
1. Support of Anchored VWAP
2. EMAs Channel
3. TL Breakout with sustained volume AFTER Breakout
4. Tendency of Price to test ATH level with a good momentum.

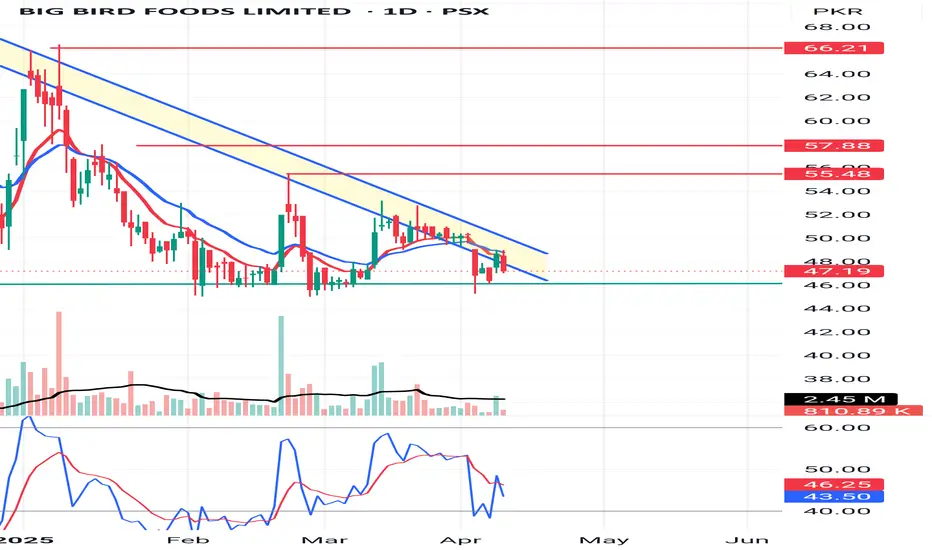
BBFL- 2x Buying Opportunity!If price breaks above TL with good volume, but trade is on the cards with 2x earning potential
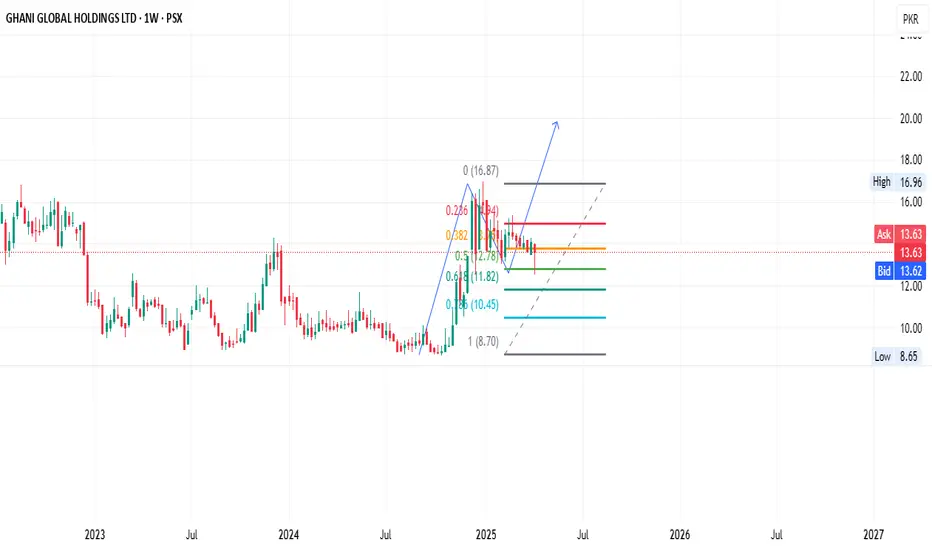
GGL Likely to Touch PKR 20.62 SoonGhani Global Holdings Limited (PSX: GGL) is displaying strong bullish signals, with rising volume and a steady uptrend pushing the price closer to key resistance levels. The stock recently rebounded from support around PKR 12.00 and has been forming higher lows on the daily chart — a classic bullish structure.
Momentum indicators like RSI remain in healthy territory, and a breakout above PKR 16.96 (the 52-week high) could trigger a rally toward PKR 20.62. With improving investor sentiment and positive fundamentals, GGL looks poised to test this level in the short to medium term.
This is not buy or sell call do your own research.
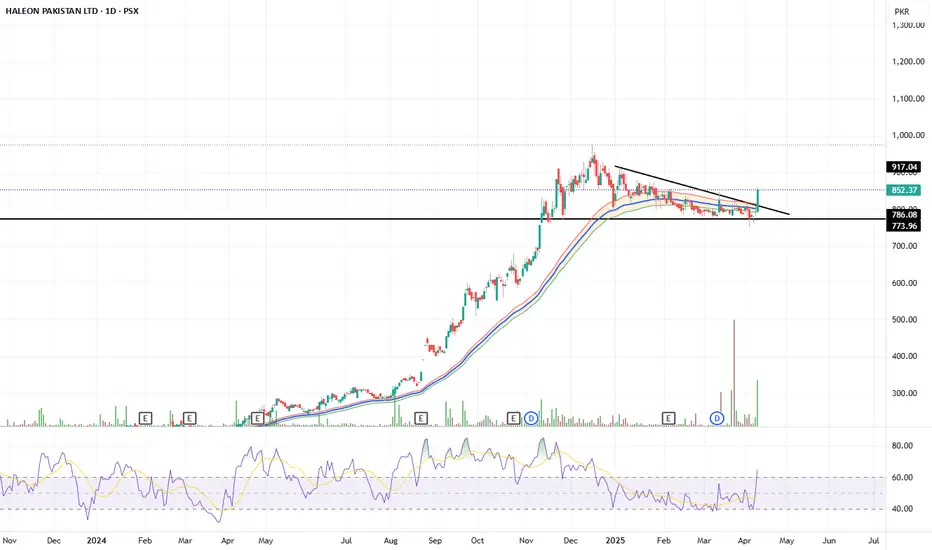
Haleon Stock Trading Strategy:Haleon Buy Strategy:
Buy around 852-800
Stop Loss: 760
Targets:
1. 900
2. 954
Plan:
1. price when come to down then buy. don't buy on high level.
2. Buy when price reaches 852-800.
3. Set stop loss at 760.
4. Aim for targets.
Reminder:
Set position size according to risk tolerance.
HCAR Stock Buying Strategy HCAR Buying Opportunity:
Key Levels:
1. Current price: 314
2. Buy zone: Below 300
3. Stop loss: 282
4. Targets: 324, 338, and final target 348
Strategy:
1. Buy on weakness: Enter the trade if the price dips below 300.
2. Risk management: Set a stop loss at 282.
3. Profit targets: Aim for 324, 338, and 348.
Considerations:
1. Market conditions: Monitor market trends and news.
2. Risk tolerance: Adjust position size according to risk appetite.
This strategy is based on the provided information. Always conduct your own research and consider consulting a financial advisor before making investment decisions.
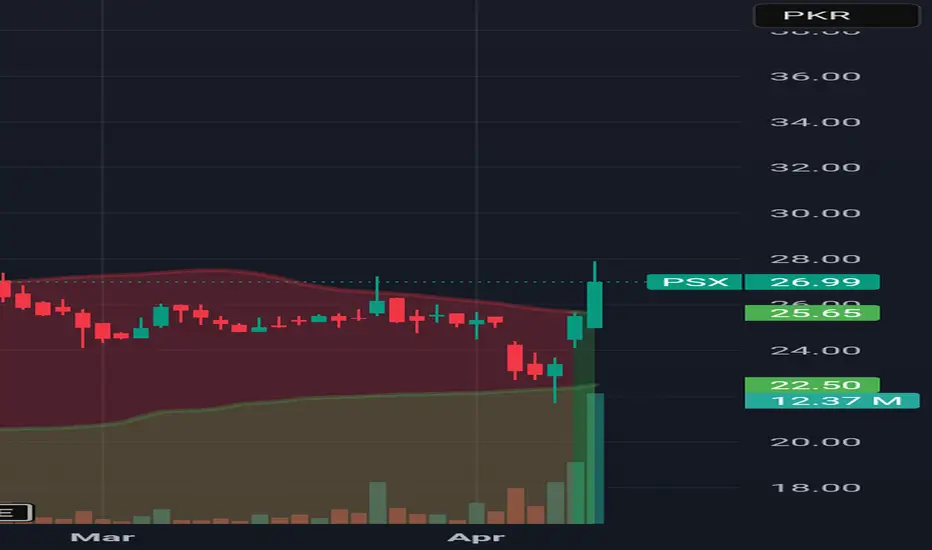
PSX Stock Trading StrategyPSX Buying Opportunity:
Key Levels:
1. Current price: 26
2. Buy zone: 24-22
3. Stop loss: 21.30
4. Targets: 29, 31, 34, and final target 36
Strategy:
1. Buy on weakness: Enter the trade if the price dips to 24-22.
2. Risk management: Set a stop loss at 21.30.
3. Profit targets: Aim for 29, 31, 34, and 36.
Considerations:
1. Market conditions: Monitor PSX trends and news.
2. Risk tolerance: Adjust position size according to risk appetite.
This strategy is based on the provided information. Always conduct your own research and consider consulting a financial advisor before making investment decisions.

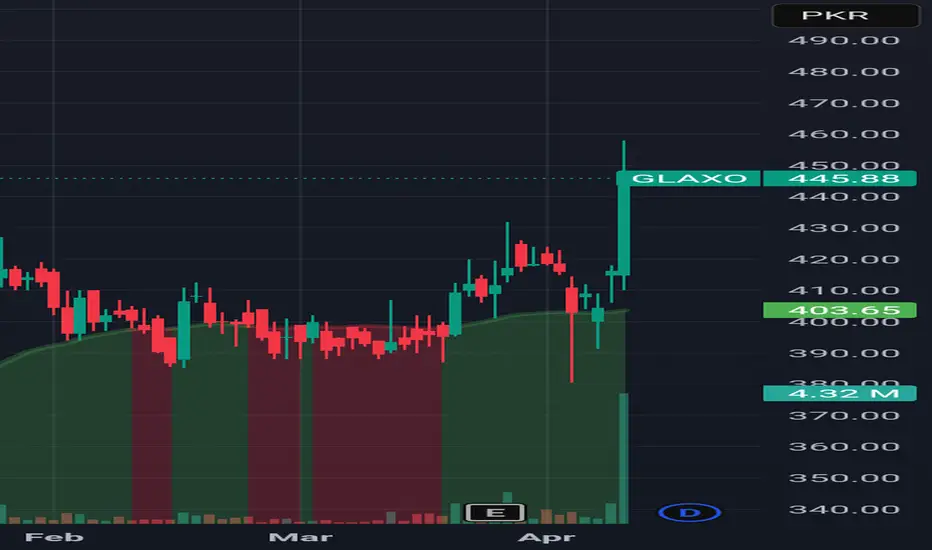
Glaxo Stock Trading StrategyGlaxo is in an uptrend. A buying opportunity arises if the stock weakens to 430-420, with:
Key Levels:
1. *Buy zone*: 430-420
2. *Stop loss*: 410
3. *Target 1*: 460
4. *Final target*: 485
Strategy:
1. *Buy on weakness*: Enter the trade if the stock price dips to 430-420.
2. *Risk management*: Set a stop loss at 410 to limit potential losses.
3. *Profit targets*: Aim for 460 and 485.
Considerations:
1. *Market conditions*: Monitor overall market trends and news.

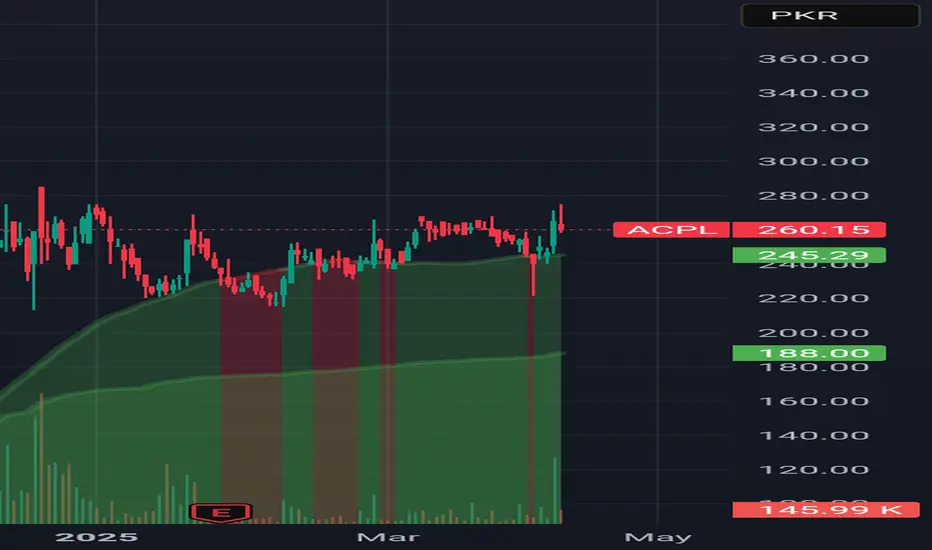
#ACPL is above green sky (strong bullish zone)#Acpl is now above green sky (Strong bullish zone). It is expected to cross 280 and 320 level.
Note: This is not a buy or sell call, trade at your own will. Use stop loss as per your strategy.
Psx (stock) is above green sky (strong bullish zone)Psx is now above green sky (Strong bullish zone). It is expected to cross 30 and 40 level.
Note: This is not a buy or sell call, trade at your own will. Use stop loss as per your strategy.
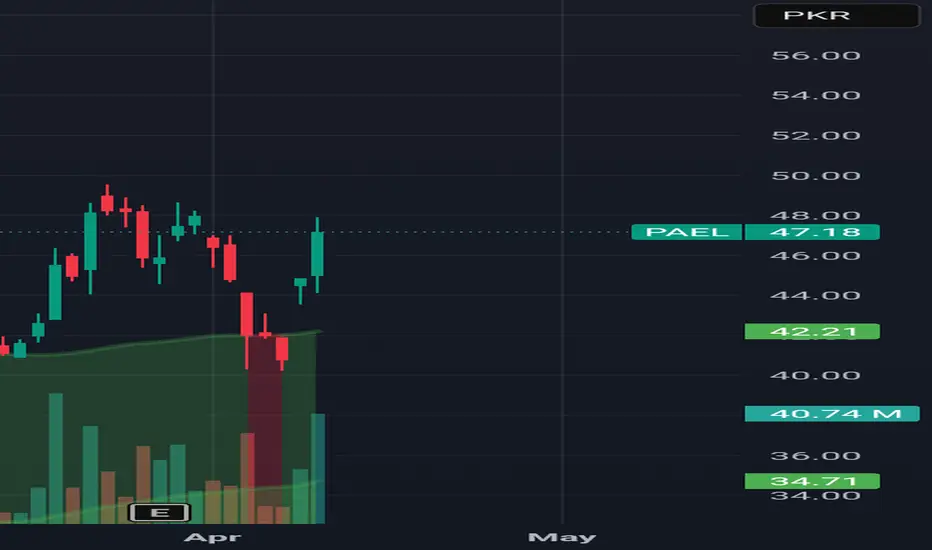
#Pael is above green sky (strong bullish zone)Hcar is now above green sky (Strong bullish zone). It is expected to cross 50 and 60 level.
Note: This is not a buy or sell call, trade at your own will. Use stop loss as per your strategy.
#Ssgc is above green sky (strong bullish zone)#Ssgc is now above green sky (Strong bullish zone). It is expected to cross 45 and 60 level.
Note: This is not a buy or sell call, trade at your own will. Use stop loss as per your strategy.
#CPHL is above green sky (strong bullish zone )#CPHL is now above green sky (Strong bullish zone). It is expected to cross 110 and 130 level.
Note: This is not a buy or sell call, trade at your own will. Use stop loss as per your strategy.
Glaxo is above green sky (strong bullish zone)Glaxo is now above green sky (Strong bullish zone). It is expected to cross 500 and 600 level.
Note: This is not a buy or sell call, trade at your own will. Use stop loss as per your strategy.