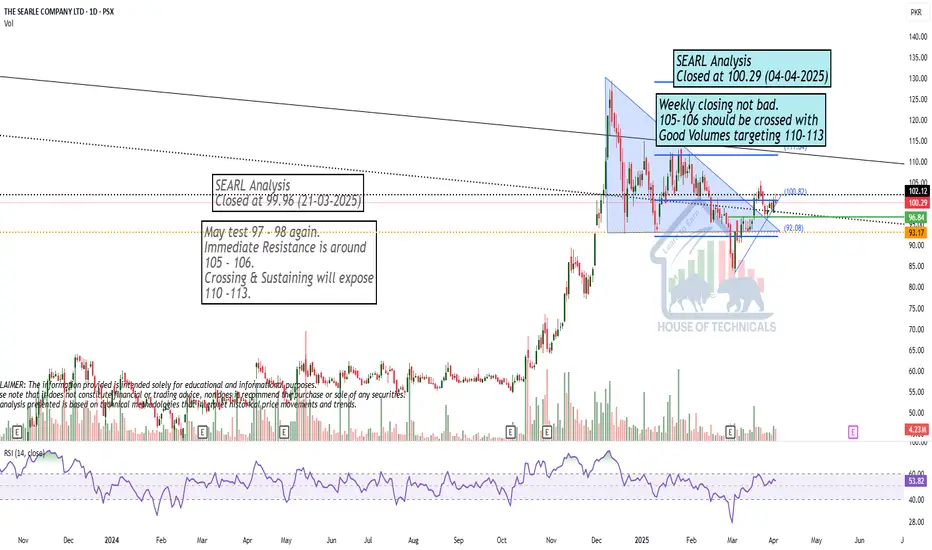
Weekly Closing not bad!Weekly closing not bad.
105-106 should be crossed with
Good Volumes targeting 110-113
Weekly Closing not Good but..Weekly Closing not Good but
the Stock is Still Bullish on Bigger
Time Frames.
Price dropped with Low Volumes.
Weekly Important Support seems to
be around 42.50 - 44.10
49-50 is an Important Resistance as
of now.

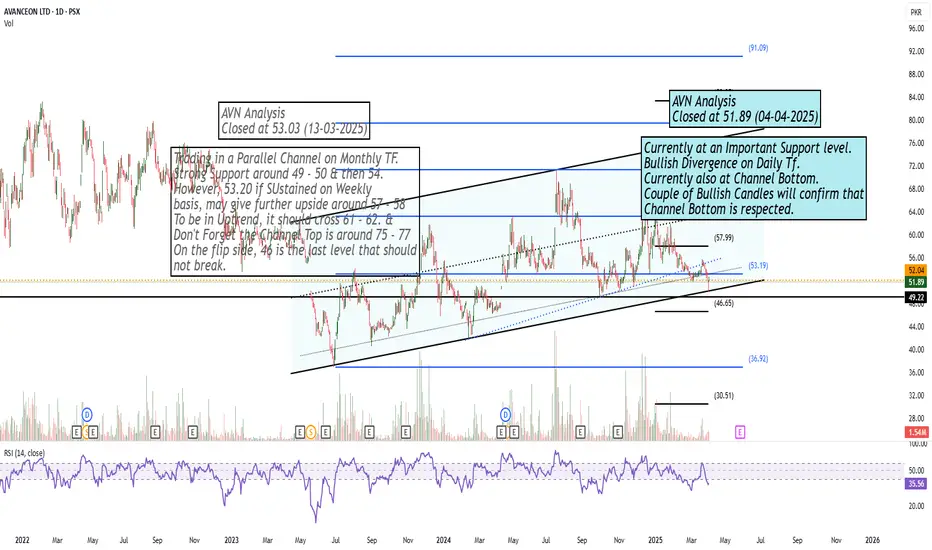
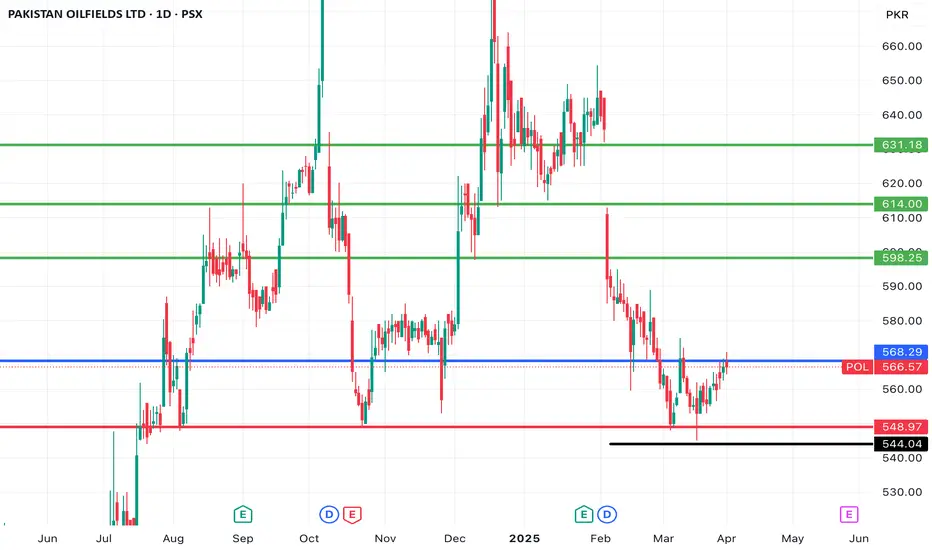
Play wisely!Currently at an Important Support level.
Bullish Divergence on Daily Tf.
Currently also at Channel Bottom.
Couple of Bullish Candles will confirm that
Channel Bottom is respected.
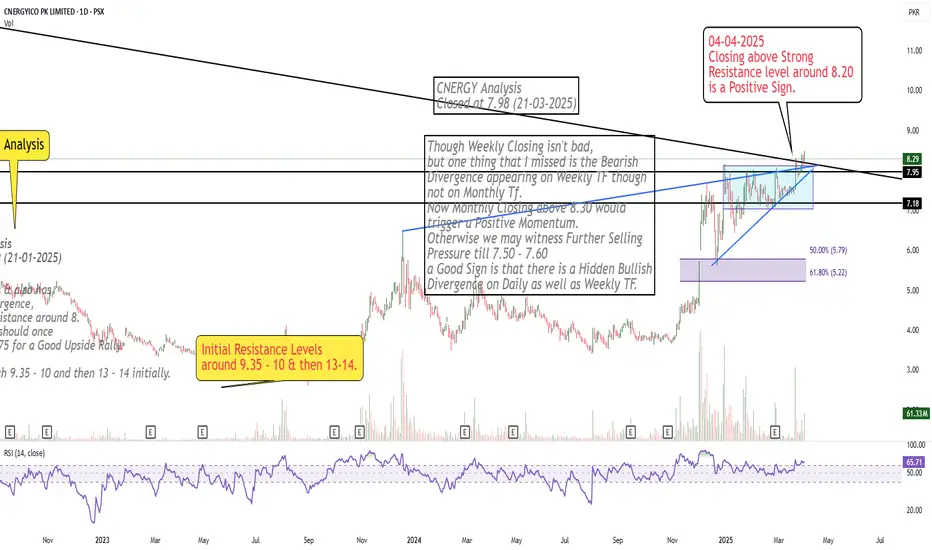
Crossed Important Resistance Area
Closing above Strong
Resistance level around 8.20
is a Positive Sign.
Haleon is in bullish zone Haleon is in bullish zone and may cross 820 and 850 level. This is not a buy sell trade call. Use stop loss.

Wavesapp is in bullish zoneWavesapp is now in bullish zone and may be it cross 12 and 13 level soon.
Note: This is not a buy sell call. Use stop poss whenever trade.


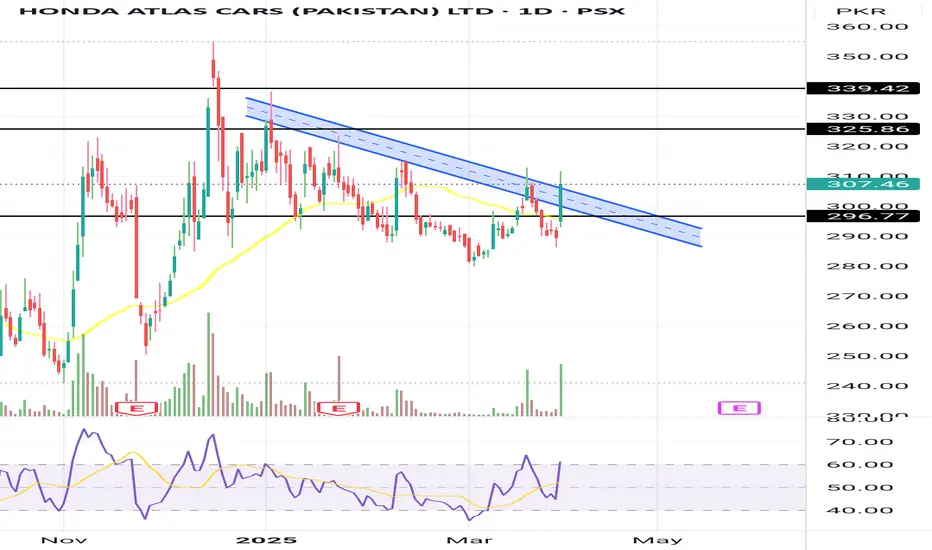
HCAR - BUYING OPPORTUNITY Buying Opportunity - HCAR
Buy Range: 297-307 (buying on weakness)
Stop Loss: 294
Target 1: 325
Target 2: 339
Further Action:
Hold if the stock sustains above 340.
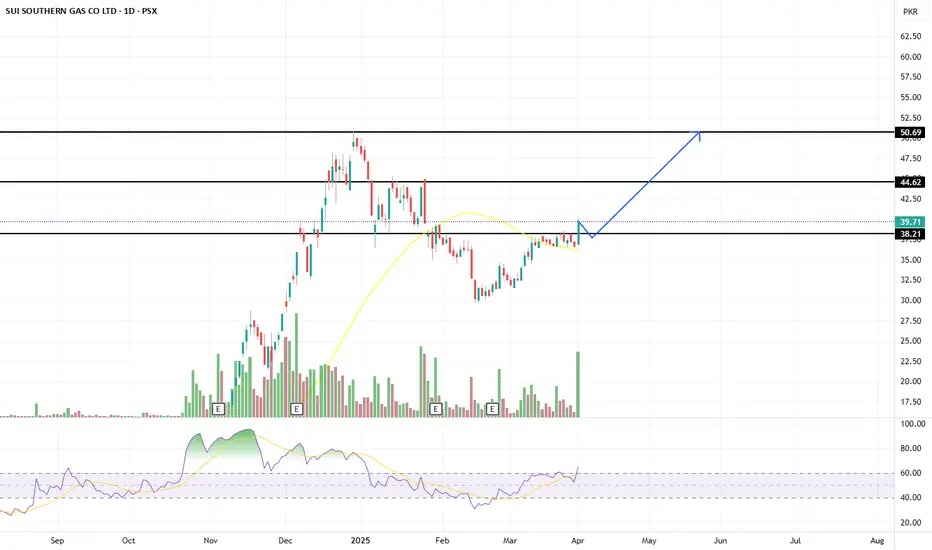
Buying Opportunity - SSGCSSGC give a buying opportunity for LONG.
buying range 39-37
Stop Loss - 36
Target 1: 44
final target 50
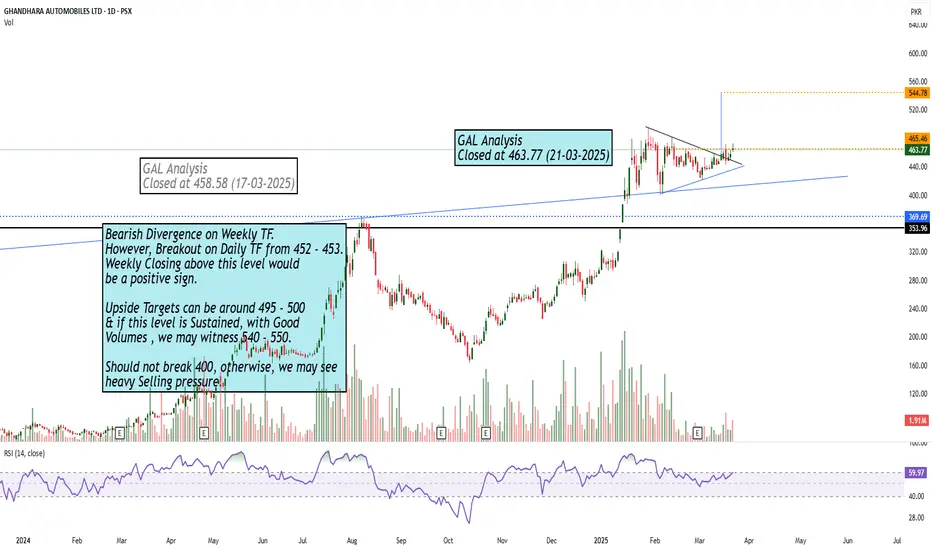
Bearish Divergence on Weekly TF but..Bearish Divergence on Weekly TF.
However, Breakout on Daily TF from 452 - 453.
Weekly Closing above this level would
be a positive sign.
Upside Targets can be around 495 - 500
& if this level is Sustained, with Good
Volumes , we may witness 540 - 550.
Should not break 400, otherwise, we may see
heavy Selling pressure.
PRL is gaining momentum for upside movePRL is rising on daily time frame, price is printing higher highs and higher lows
good chance for buying at current level with a define stop loss

Bullish on All Time Frames.Bullish on All Time Frames.
Monthly Closing above 211 - 212 would
be very positive for OGDC.
Retested the Previous Breakout Level
around 194 - 195.
Hidden Bullish Divergence on Daily Tf.
227 - 228 is the Weekly Resistance that
seems to break this time.
If this level is Sustained, we may witness
250+ initially.

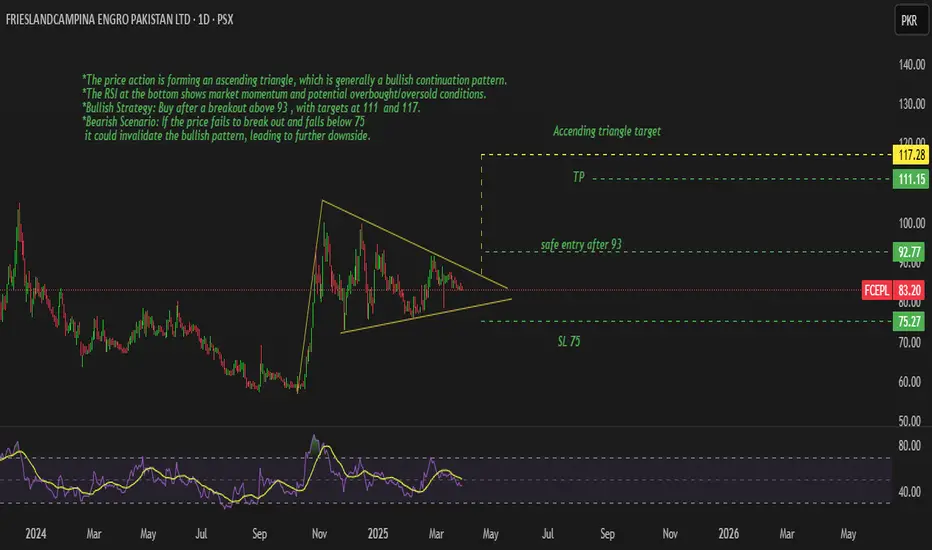
FCEPL*The price action is forming an ascending triangle, which is generally a bullish continuation pattern.
*The RSI at the bottom shows market momentum and potential overbought/oversold conditions.
*Bullish Strategy: Buy after a breakout above 93 , with targets at 111 and 117.
*Bearish Scenario: If the price fails to break out and falls below 75
it could invalidate the bullish pattern, leading to further downside.
MTL*Head & Shoulders Pattern: A potential head and shoulders pattern is visible, which is a bearish reversal structure
but still no any negative sign RSI moving in range between 30-70
*Safe Buying Zone: Marked around 615-620 , indicating a breakout level where price stability could confirm an upward move.
*Bullish Approach: Buy if price sustains above 615-620 with targets toward 640 and 680
*Bearish Approach: If the price breaks below 474.73 , it could confirm the head and shoulders breakdown, leading to a further drop.

PSO - LongSimply based on such a long consolidation of 10 years, this stock has huge potential.
If you are a value investor and looking for great returns, then this share is for you with the target of Rs 650.
Short term target for traders is Rs 500-525

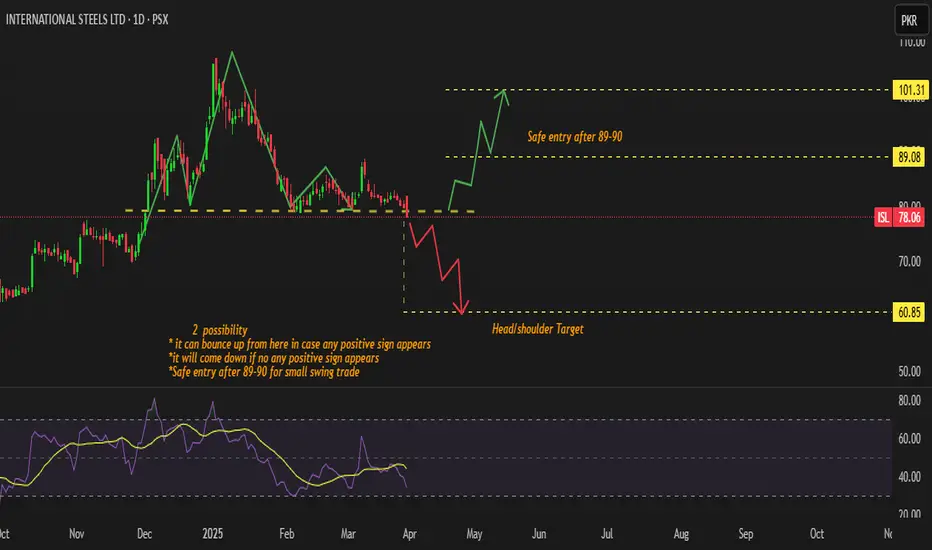
ISLCurrent Price: The stock is currently trading at 78.06
Safe Entry Point: A safe entry for a swing trade is suggested after 89-90
*Head and Shoulders Pattern:
If the price breaks below the current level and fails to show strength, it could drop further toward the Head & Shoulders target of 60.85
A downward movement (red arrow) represents this bearish scenario.
*Bullish Scenario:
If the stock shows positive signs (such as increased volume, breakout confirmation), it could bounce back up.
A breakout above 89-90 could push the price towards 101.21

Bullish on Monthly TF.Bullish on Monthly TF.
Though HL Confirmed on Bigger TF but Important
to Cross & Sustain 730 & if this level is Crossed with
Good Volumes, we may witness 770 - 775 initially.
On the flip side, 640 - 645 may act as Immediate
Support.
It should not break 608, otherwise we may witness
more Selling Pressure towards 550 - 570.
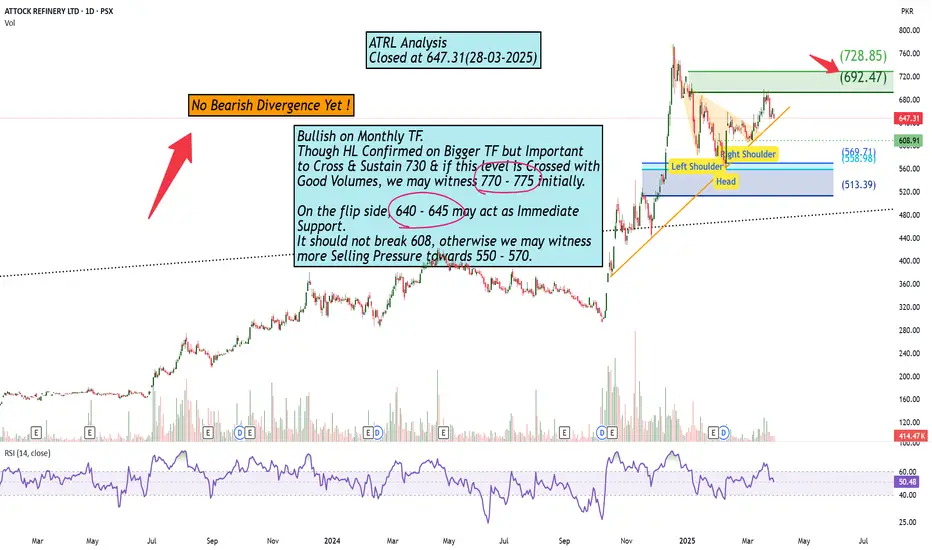
No Bearish Divergence Yet!Bullish on Monthly TF.
Though HL Confirmed on Bigger TF but Important
to Cross & Sustain 730 & if this level is Crossed with
Good Volumes, we may witness 770 - 775 initially.
On the flip side, 640 - 645 may act as Immediate
Support.
It should not break 608, otherwise we may witness
more Selling Pressure towards 550 - 570.

Play On LevelsRetested the Breakout Level around 180 - 185 &
Closed just above a Very Important fib level around
188.
But, 188 - 195 is Very Important Resistance as of now.
If 195 is Crossed with Good Volumes, 212 - 215 can be
touched initially.
Couple of Positive Weekly Candles with comparatively good
volumes may confirm HL on Monthly basis.
On the flip side, 175 - 184 is a Support Zone & also Double
Bottom around 175 - 176, so Short Term Traders may
expect a bounce from this level.
