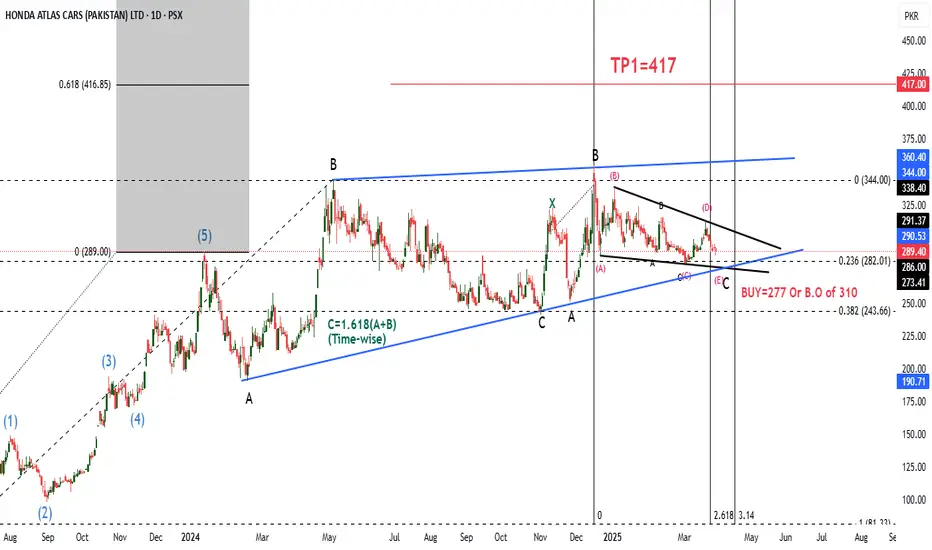
Buy HCARHCAR after completing its Elliott Wave cycle in December 2023 has gone into complex correction. First phase of correction completed with type ABC Irregular Failure following all rules both price and time-wise. Now it is forming its second phase of correction with contracting triangle. It has fulfilled its criteria for formation of e-wave. It can start its trending move any time at the levels 289-278. However, there are also chances that e-wave may go further into formation of another small triangle. In that case, this small triangle will be formed without affecting price level to the down-side. It is matter of time only that HCAR may start its upward move towards 417. BUY @ cmp is recommended.
HIN00NThe chart indicates a bullish sentiment, but confirmation is needed with a breakout above 945.
If the price holds above this level, it could move toward the 985 PKR target.

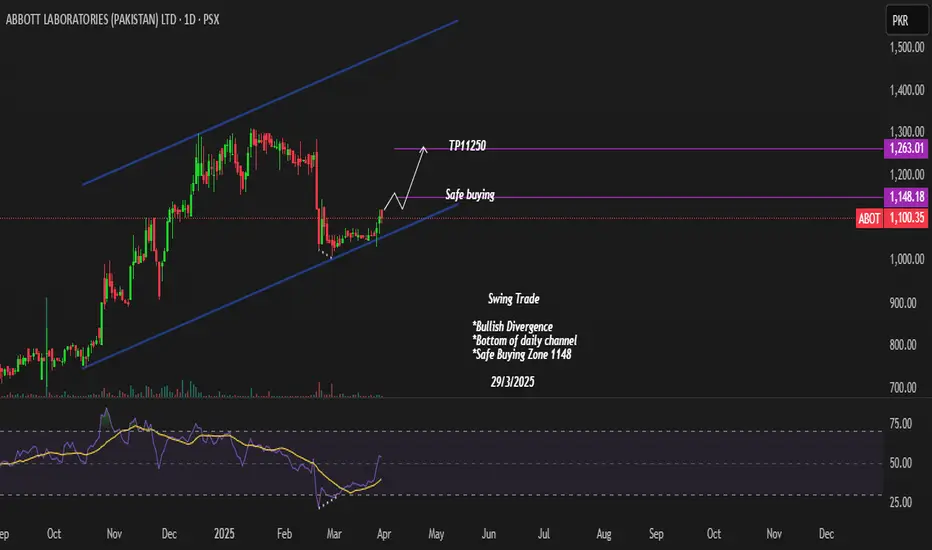
ABOTBullish Divergence:
The Relative Strength Index (RSI) at the bottom of the chart shows bullish divergence
This indicates potential upward momentum or trend reversal.
Safe Buying Zone:
The analyst suggests that buying is relatively safer near the lower boundary of the channel, where support has been confirmed.
Target Price (TP 11250):
The expected price movement is shown with an arrow, indicating a potential upward move towards the target price of 1,250 PKR.

135 - 145 Important Resistance ZoneImmediate Important Support lies around 125 - 128.
However, 135 - 145 is a Very Strong Resistance.
So Fresh Position is recommended either once
this level is crossed or at a Proper Support around 123-128
& then around 112 - 115
If it breaks 118, we may see more Selling pressure.

MLCF AS PLANNEDMLCF respected all the level and did exactly as marked. I was just going through my previous analysis and just looked at this amazing chart. thought to share with you! look at the patterns and the perfect breakout retest strategy I mostly play with.

FFL THE PERFECT SETUP REVIEW AS DEFINED FFL tested the same key levels which I find through secret price action and institutional order flows. I don't want to repeat you can just look at the chart and its beauty.

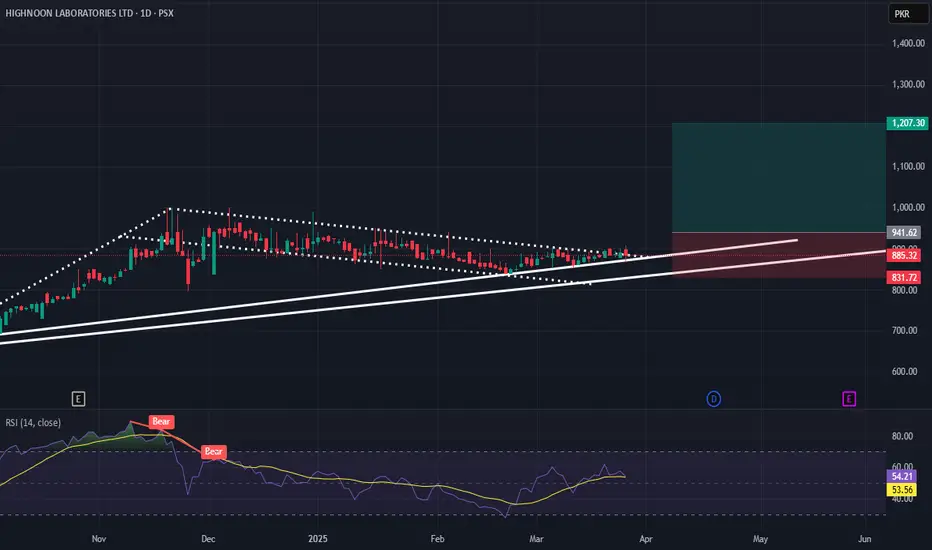
HINOON: Flag and Pole pattern on 1D TF. Potential rally likelyHINOON is in uptrend printing HHs and HLs on 1D timeframe. Recently the chart has formed a Flag and Pole pattern. It is likely that break of previous LH (941.62) shall result in another rally that may take the price upto level of 1207.30. SL is placed below lowest point of the flag (831.72).
It is pertinent to mention that previous all time high of 1,000.00 may act as a major resistance and we may need to be careful for any reversal indications at this point. However, at this point there is no apparent indication of reversal from current price level.
TPs may be broken as per following:
TP1=1051.52
TP2=1161.42
TP3=1207.30
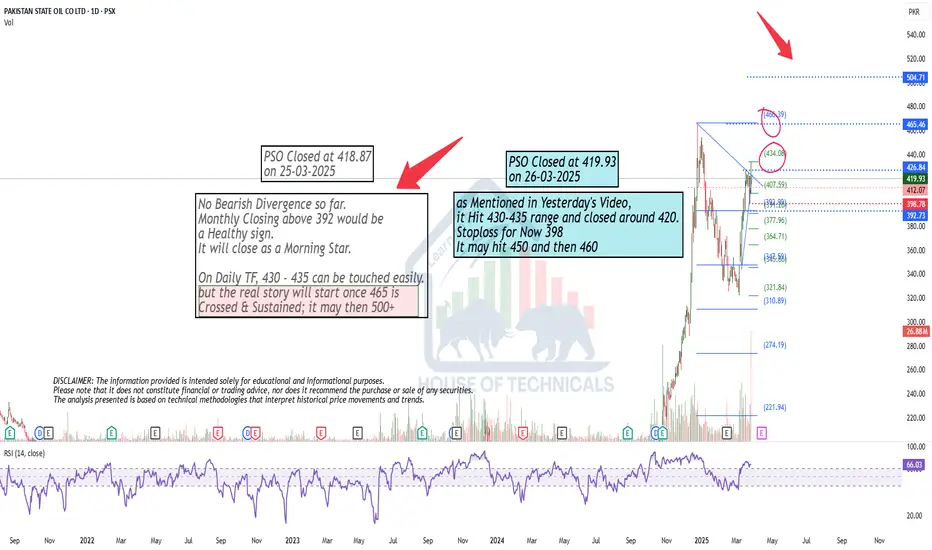
Still Good to Go..as Mentioned in Yesterday's Video,
it Hit 430-435 range and closed around 420.
Stoploss for Now 398
It may hit 450 and then 460
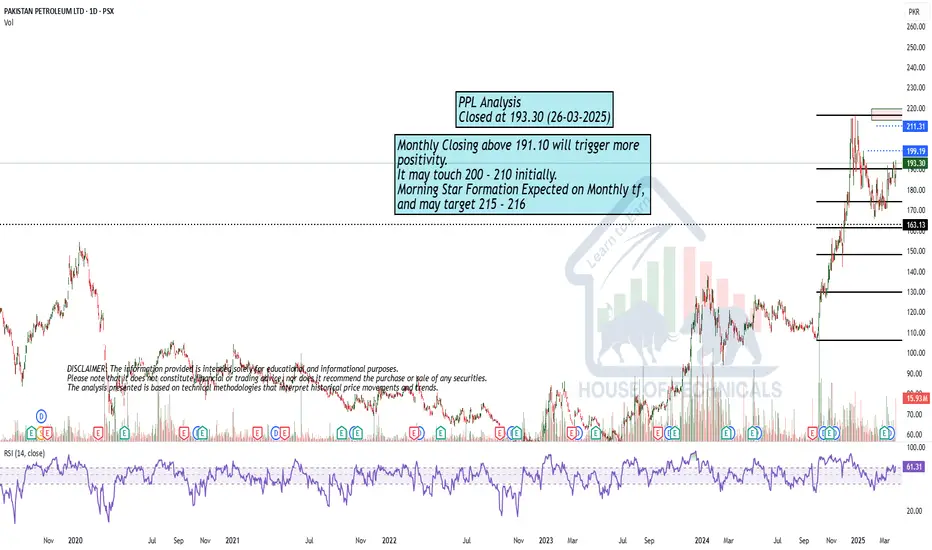
Positive Monthly Closing is ImportantMonthly Closing above 191.10 will trigger more
positivity.
It may touch 200 - 210 initially.
Morning Star Formation Expected on Monthly tf,
and may target 215 - 216
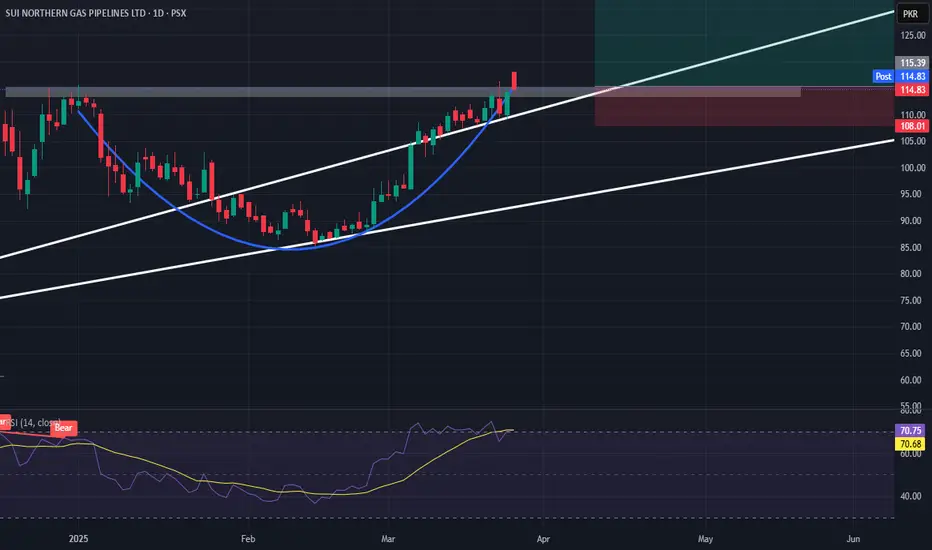
SNGP due for another rally on 1DSNGP is in uptrend and is printing HHs and HLs on 1D timeframe. Recently, between Jan & Mar 25, it has formed a cup and handle pattern indicating another rally upon breaking of resistance area 113.09-115.34. There being no negative indication on RSI, I would put my Buy Stop on break above 115.34. The potential target is 145.08. SL is placed under the handle at 108.01.
Recommended booking of TPs is:
TP1=122.67
TP2=130
TP3=137.33
TP4=145.08
Good luck.
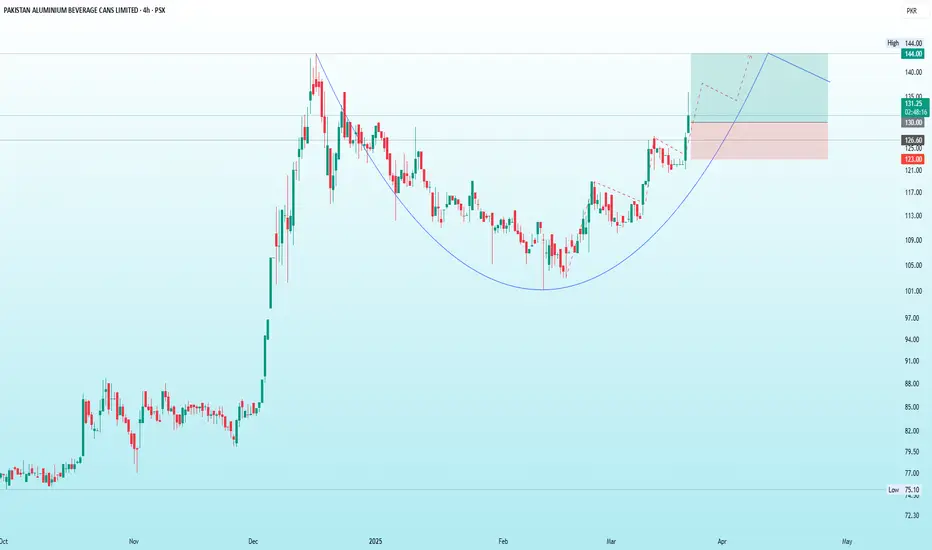
PABC | Formation of CUPThe stock displays a cup pattern on strong volume, trading confidently above both the 20 and 200-day EMAs, suggesting robust upward momentum. Previous session candle was bullish and need pull back for taking a long position near 130 level for the approach of its neck line resistance near 144. Use a stop loss at 123 to manage your risk.
SYM Technical Analysis: Potential Bullish SetupSYM (Symmetry Group Ltd) is currently in an overall bullish trend and holding above a rising trendline. The price is currently at the Fib Golden Zone. The RSI is synced with price action, which supports the bullish outlook. In addition, there's a potential hidden divergence that could signal continued upward momentum. A possible gap fill towards 11.88 might also present a good buying opportunity.
Trading Recommendations:
Buy 1 (CMP): 15.05
Buy 2: 14
Stop-Loss: Closing below 9
Take Profit 1: 21
Take Profit 2: 26
Take Profit 3: Open
Happy trading!


Play on LevelsImmediate Important Support lies around 125 - 128.
However, 135 - 145 is a Very Strong Resistance.
So Fresh Position is recommended either once
this level is crossed or at a Proper Support around 123-128
& then around 112 - 115
If it breaks 118, we may see more Selling pressure.

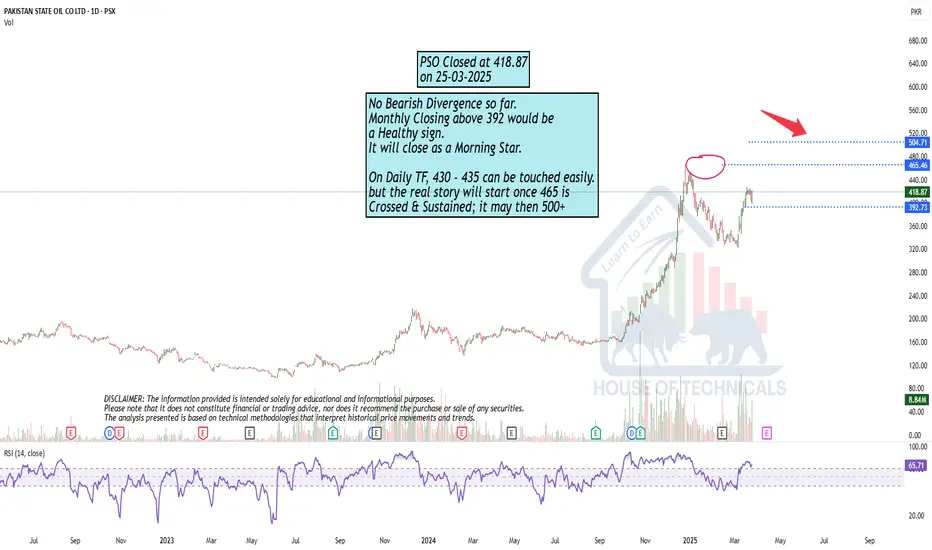
No Bearish Divergence so far.No Bearish Divergence so far.
Monthly Closing above 392 would be
a Healthy sign.
It will close as a Morning Star.
On Daily TF, 430 - 435 can be touched easily.
but the real story will start once 465 is
Crossed & Sustained; it may then 500+
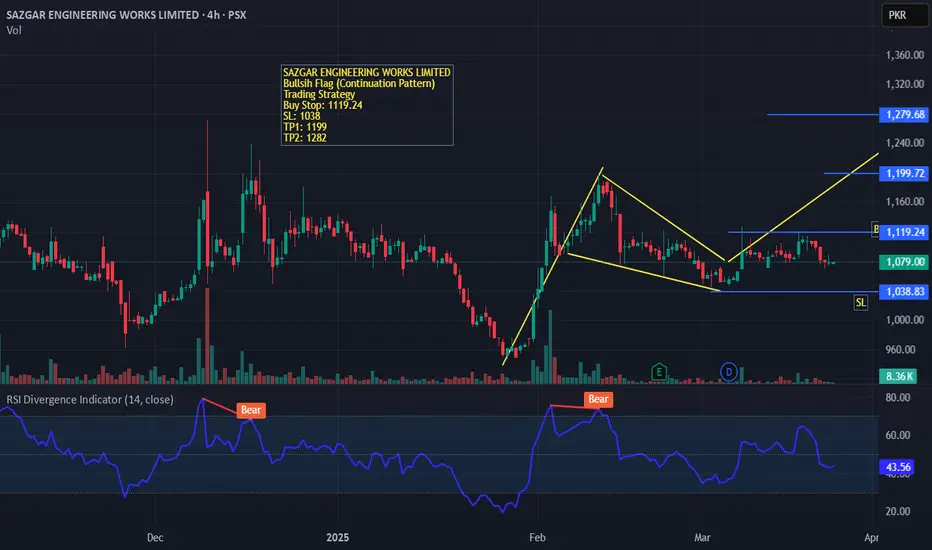
SAZGAR ENGINEERING WORKS LIMITED (4H, PSX):Sharp bullish move followed by downward sloping consolidation is showing a classic bullish flag on SAZGAR ENGINEERING WORKS.
according to the RSI value which is still lower than 50 percent, the traders and investors should wait for the breakout above 1119.24.
RSI = 43.56: Indicates weak momentum; not yet bullish. as the momentum and volumes are still low.
GTYR is BullishPrice is in a trending phase, consistently printing higher highs and higher lows, with no divergence on top and a bounce from trendline we can hope for another leg up as per Dow theory. Targets are mentioned on the chart.

NRLA bullish flag is a continuation pattern with three key components:
Flagpole – A strong price surge.
Flag – A slight downward or sideways consolidation.
Breakout – Price moves above the flag’s resistance, continuing the uptrend.

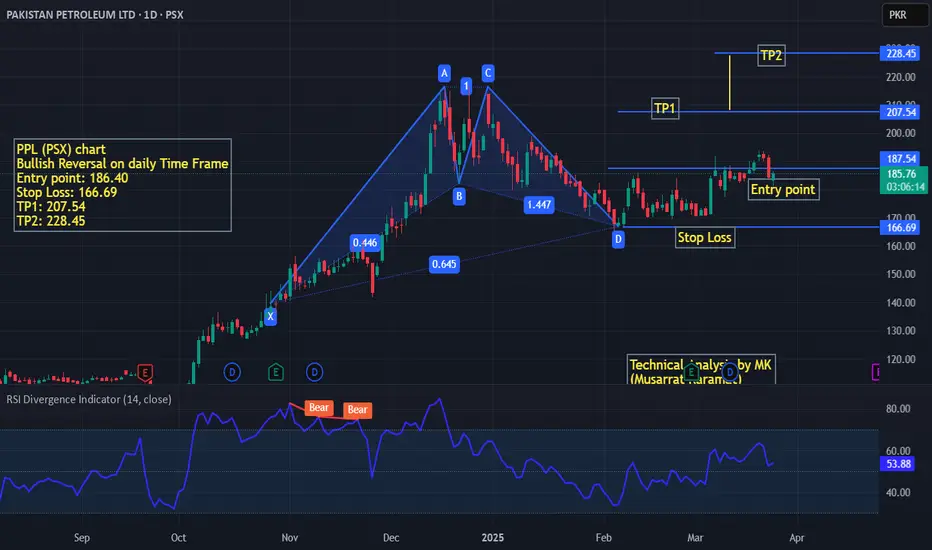
Trading Strategy; PPL (PSX) showing Bullish Reversal The PPL chart in PSX on daily time frame showing a bullish reversal Gartley Pattern.
The analysis has shown the entry point, stop loss and TP1 and TP2 levels for investors and traders working in PSX.(PAKISTAN)
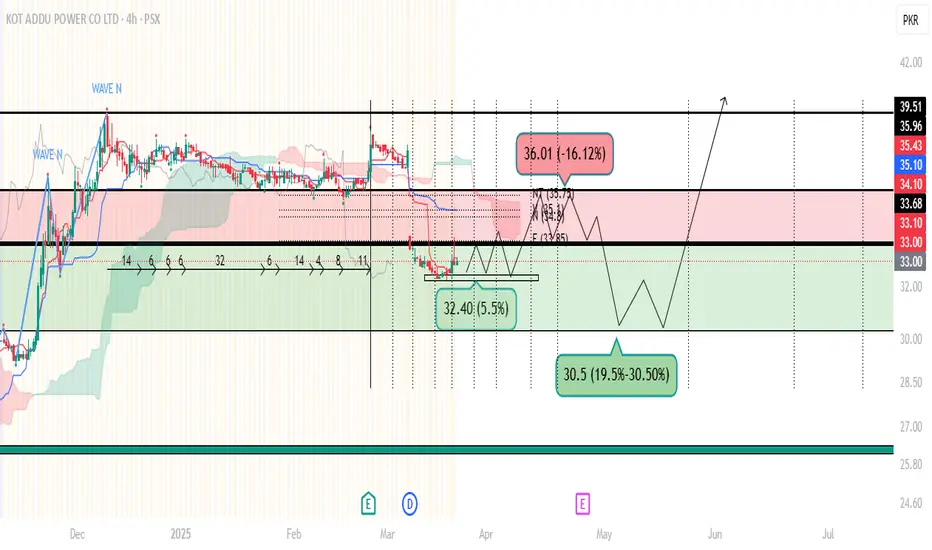
KAPCO Stock Forecast: Buy or Sell? Key Levels to WatchCurrent Price Level: The stock is trading at PKR 32.85,
Potential Trading Strategy:
If the price holds above PKR 32.40, a short-term recovery toward PKR 33.68 and 35.68 .
A break above PKR 35.96 may signal a strong uptrend toward PKR 37.99.
Caution : breaks below PKR 30.5, it may fall to the next support at PKR 27.35
Risk-Reward Calculation:
Entry Stop-Loss Target (TP1) Target (TP2) Target (TP3)
30.00 28.00 (-2.00) 34.86 (+4.86) 35.96 (+5.96) 37.99 (+7.99)
Disclaimer: The views and analysis in this article are opinions of author and are for Informational purposes only.
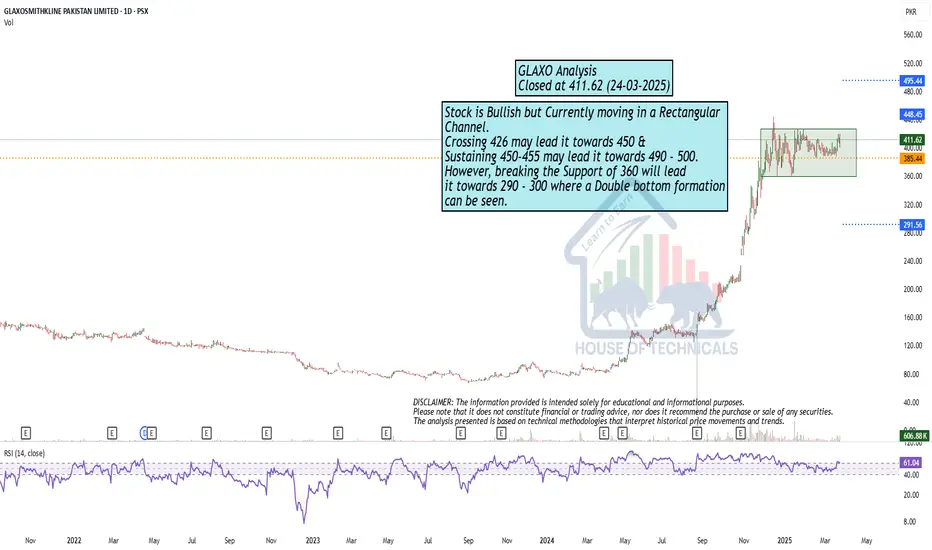
Stock is Bullish but Currently moving in a Rectangular Channel.Stock is Bullish but Currently moving in a Rectangular
Channel.
Crossing 426 may lead it towards 450 &
Sustaining 450-455 may lead it towards 490 - 500.
However, breaking the Support of 360 will lead
it towards 290 - 300 where a Double bottom formation
can be seen.
Bullish Divergence on Weekly TF.Bullish Divergence on Weekly TF.
Seems like taking Support from a Very Important
fib. level around 10.30 - 11.40
Falling Wedge Pattern on Daily TF.
10.90 Should be Sustained on Monthly Basis, otherwise
we may witness further Selling pressure till 8.
Important Resistance is around 12.30 - 12.65 as of now.
