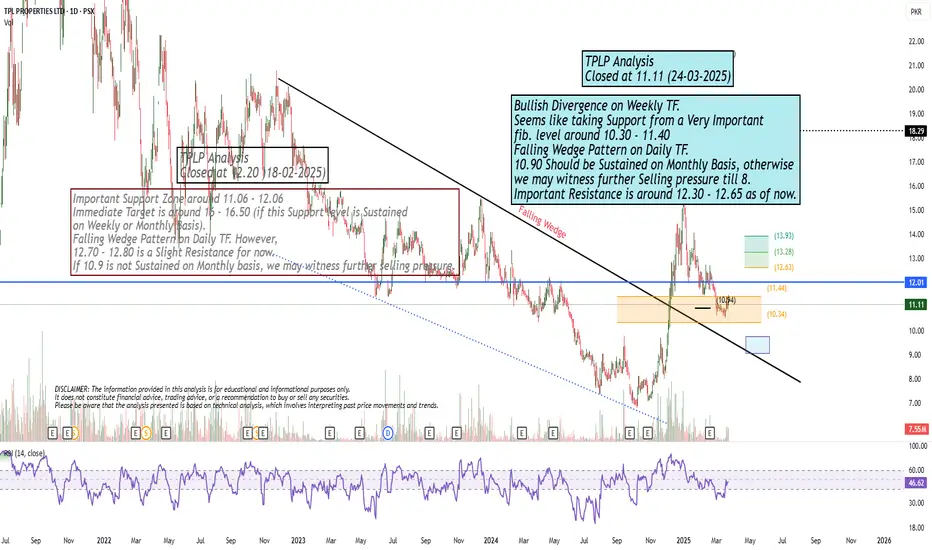
Bullish Divergence on Weekly TF.Bullish Divergence on Weekly TF.
Seems like taking Support from a Very Important
fib. level around 10.30 - 11.40
Falling Wedge Pattern on Daily TF.
10.90 Should be Sustained on Monthly Basis, otherwise
we may witness further Selling pressure till 8.
Important Resistance is around 12.30 - 12.65 as of now.
Play on LevelsBearish Divergence on Daily TF is pushing the
price down.
Currently at Make it or Break it Situation.
Immediate Weekly Support lies around current
level otherwise next support would be around 176 - 177.
Important to Sustain 189 for further Upside.

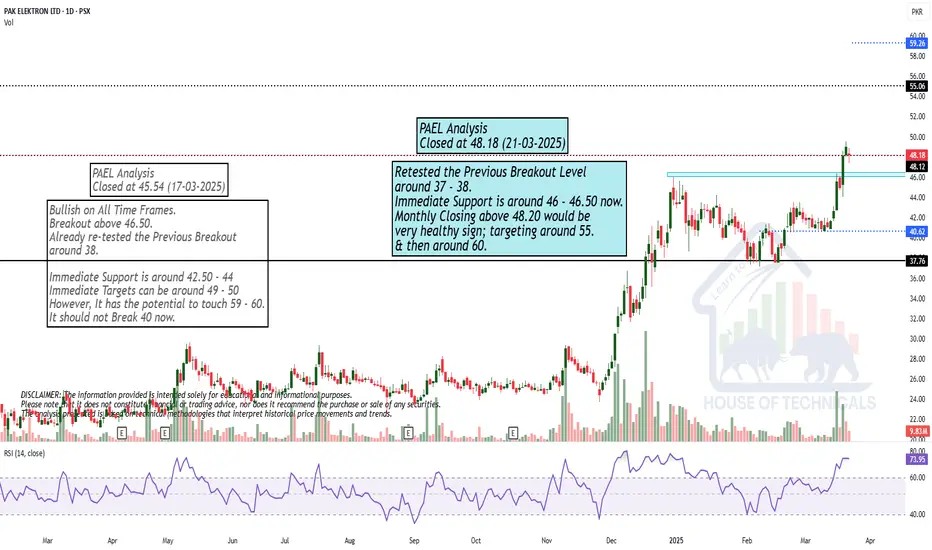
PAEL | Flag PatternThe stock displays a bullish flag pattern on strong volume, trading confidently above both the 20 and 200-day EMAs, suggesting robust upward momentum. Previous session shows a break out of the flag and price closed +3% above it. Initial resistance lies around 46 which is the formation of double top pattern from where short term rejection can be seen. However, a decisive break above the resistance level will confirm the continuation of the bullish trend and flag projection lies around 55.

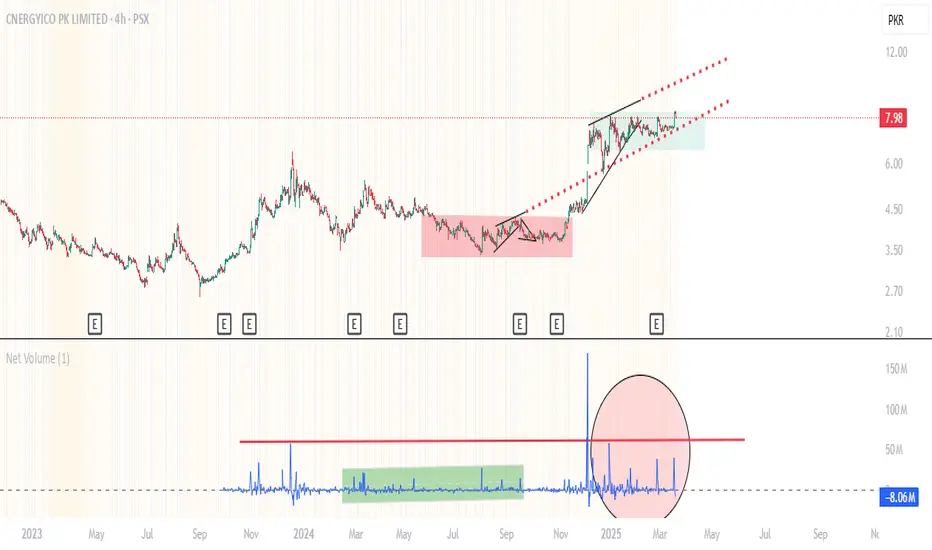
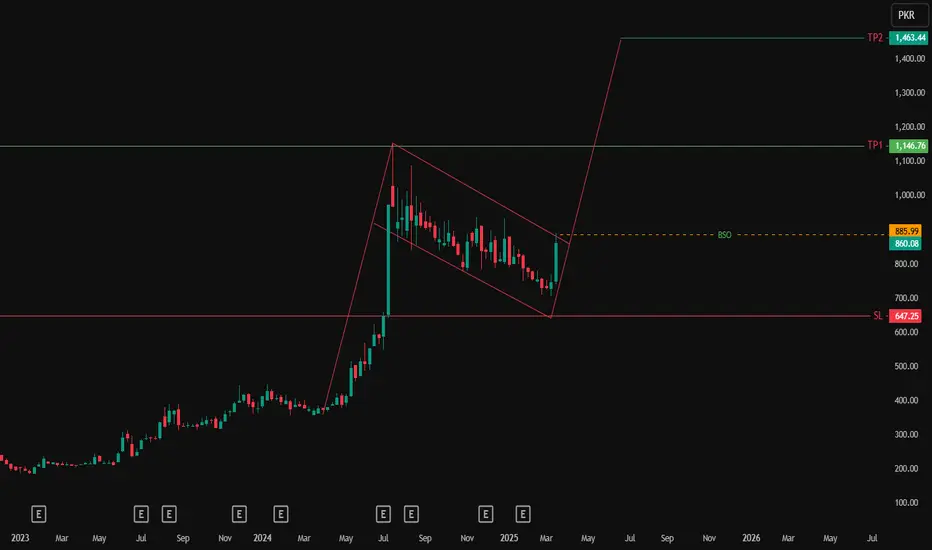
PSX- CNERGY : Breakout or Rejection? Trading Strategysignificant increase in volume is observed indicates accumulation by institutions or major market participants.
While Net volume remains negative (-8.06M), suggesting some selling pressure at higher levels.
Trading Strategy:
Short-Term Strategy
Buy on pullback when price retraces to 7.0 - 7.2 PKR, its a better risk-reward entry for Profit target: 8.7 - 9.0 PKR
Keeps Eyes on bearish divergence in volume —if price rises but volume declines, a correction may follow.
Bullish on Monthly TF but..Bullish on Monthly TF.
No Bearish Divergence on Monthly Tf.
But 40 - 40.20 is a Very Strong Resistance
that needs to Cross & Sustain with Good Volumes to
reach 45 - 46 & then 50+
We should not ignore that it has taken Support
from a Very Important Fib level around 32.40
Monthly Closing above 33.60 would be a Very Healthy sign.
So any dip towards 36.50 - 37.50 & then 34.50 - 35.50
can be a Buying Opportunity.
However, it should not break 31.80 otherwise we
may witness further Selling Pressure towards 28.50 - 28.70

Play on Levels169 - 175 can be a Good Support Area.
Better Financial Results.
Should not Break 161 even in Worst Cases.
Crossing 187 may lead it towards 200 - 203.

PSX LONG Perfectltly bounce from 0.61 if sustain above 0.5 it will hit prveoius highs so please take entry and exit as mention in tradeplan .DYOR

EXIDE LONG EXIDE Is in trending performing ABCD pattern bullish indicates upside move my anticipation is that it will hit both TPS . DYOR
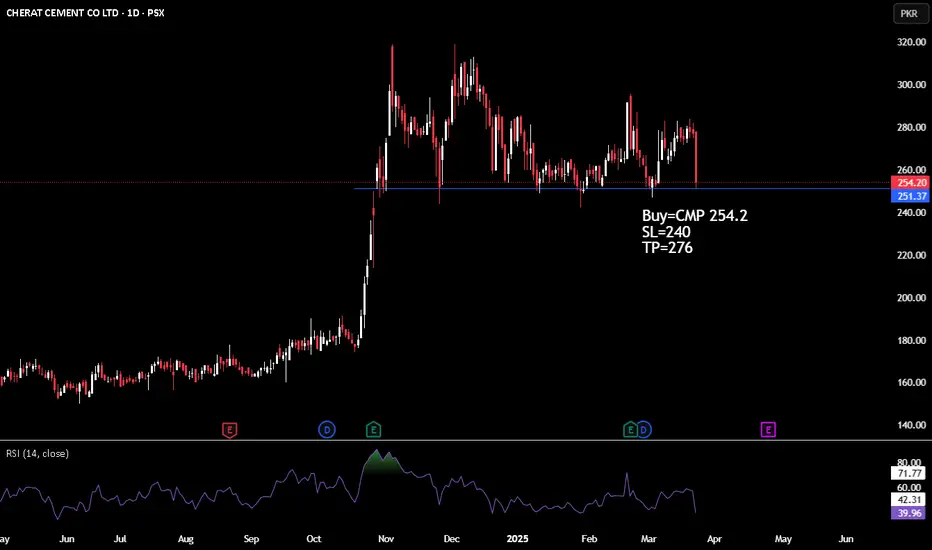
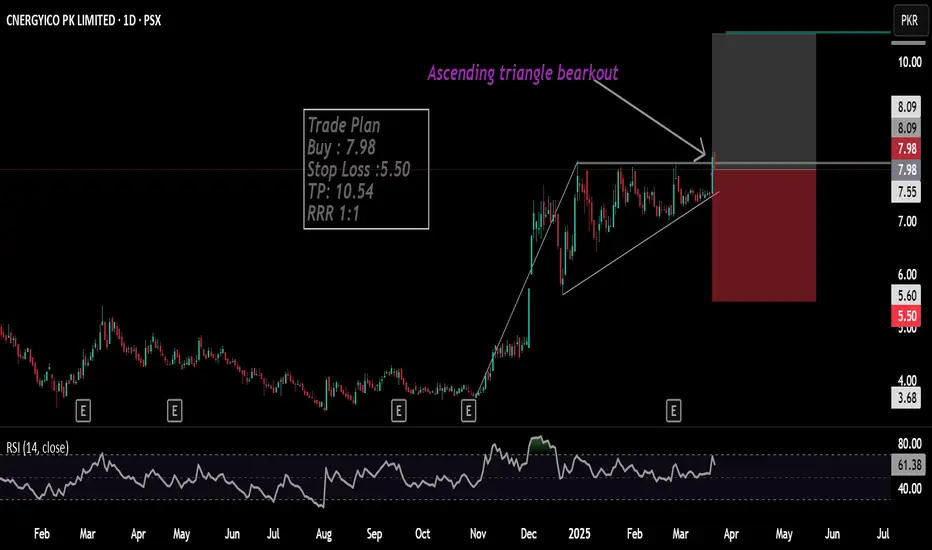
CNERGYTrend is Bulish. with Bulish Ascending triangle beark.
Trade Plan
Buy : 7.98
Stop Loss :5.50
TP: 10.54
RRR 1:1
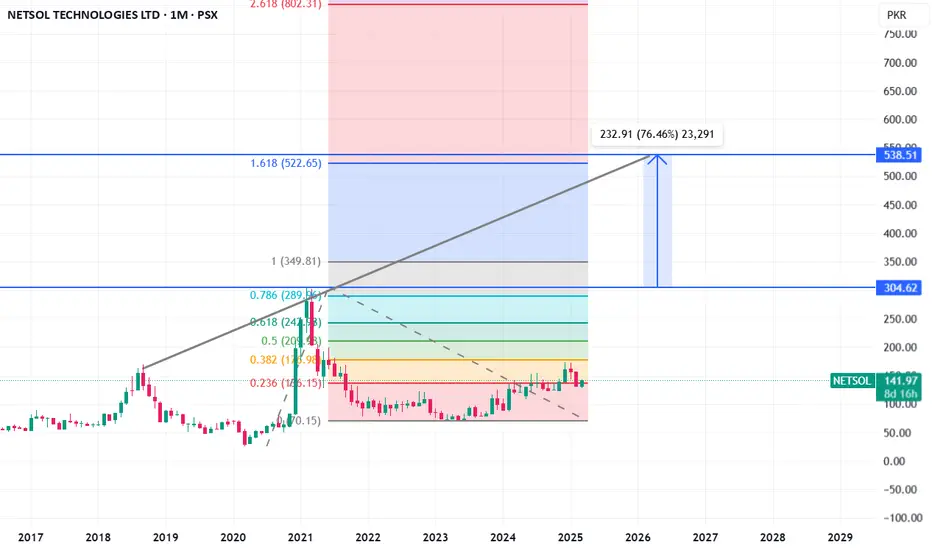
NETSOL LongIt is totally my assumption and can be wrong as well. This is not a buy / sell call.
Netsol is in accumulation phase and may touch the high and touch the trendline shown by Feb-Mar 2026.
The high it may touch will be its Fib level 1.618 i.e. 522 or best assumption can be 538 (difference of its previous high and recent low). Buyback by company is another strong indication of "Something's Cooking".
Have a blessed Ramazan and great trading experience.
Bullish on Bigger Time Frames.Bullish on Bigger Time Frames.
but Important Resistance area is around 140 - 144.
Crossing 144 with Good Volumes will expose
the levels around 170 & then 190.
132 & 125 are important Support levels as of now.

May test 97 - 98 again.May test 97 - 98 again.
Immediate Resistance is around
105 - 106.
Crossing & Sustaining will expose
110 -113.

Monthly TF:
Cup & Handle Formation on Bigger TF.
Strong Support is around 263 - 265
Monthly Closing above 312 - 313 would be
a positive trigger.
Upside Target can be around 400 - 405
once 360 - 365 is Crossed & Sustained.
Ultimate Target can be around 640 - 650
from Short to Medium Term.
However, it should not break 240 otherwise
we may expect Huge Selling Pressure.

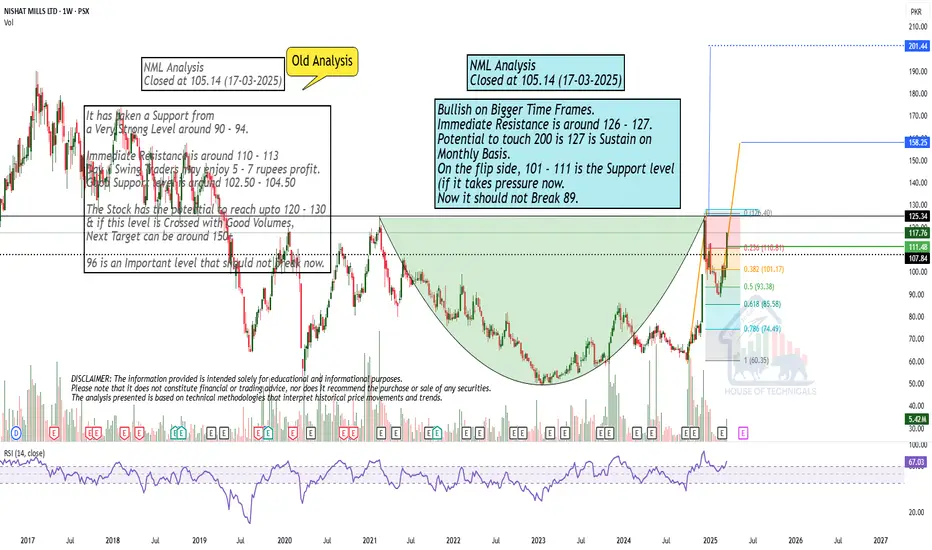
Bullish on Bigger Time Frames.Bullish on Bigger Time Frames.
Immediate Resistance is around 126 - 127.
Potential to touch 200 is 127 is Sustain on
Monthly Basis.
On the flip side, 101 - 111 is the Support level
(if it takes pressure now.
Now it should not Break 89.
Breakout ExpectedMonthly Closing above 18.40 will trigger
further upside.
Long Consolidation Breakout Expected.
Bullish on Weekly TF.
Hidden Bullish Divergence on Weekly TF.

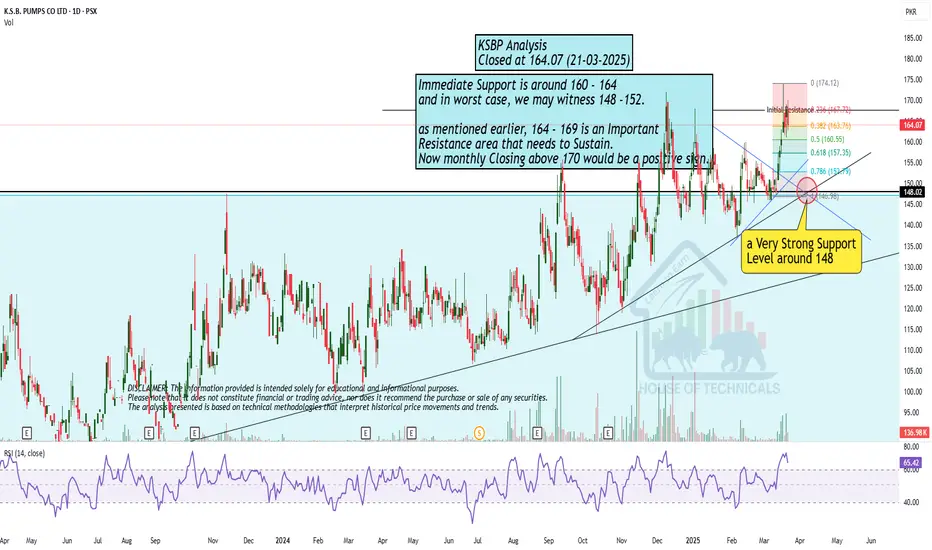
Monthly Closing above 169 - 170 is Important.Immediate Support is around 160 - 164
and in worst case, we may witness 148 -152.
as mentioned earlier, 164 - 169 is an Important
Resistance area that needs to Sustain.
Now monthly Closing above 170 would be a positive sign.
Still BullishRetested the Previous Breakout Level
around 37 - 38.
Immediate Support is around 46 - 46.50 now.
Monthly Closing above 48.20 would be
very healthy sign; targeting around 55.
& then around 60.
Play on LevelsMonthly Support is around 640 - 674.
Monthly Resistance is around 702.
Closing above this level may expose
levels around 750 - 755 & then around 780.
This time breaking 620 will bring more
Selling pressure towards 575-578.
Bullish on Weekly & Monthly TF.

Weekly Closing just at Resistance!Weekly Closing just around Resistance
level (580), so a slight pressure may be seen, unless it
Sustains 580. If this be the case, 545 - 565 can be witnessed.
Bullish on Weekly TF & a perfect
Morning Star Formation on Weekly Tf.
Also, it has retested the previous breakout level
around 520.
Now it should Cross & Sustain 605-606 to continue
its Bullish Momentum & immediate targets can be around
650 - 655.
On the safe side, 596 - 621 Zone is a Resistance zone.

Bearish Divergence has started appearing but...Bearish Divergence has started appearing
on Weekly TF but not yet on Monthly, so
a pressure might be seen around 116 - 117.
& Sustaining this level will expose 135 - 138 targets.
On the flip side, 101 - 109 may act as a Good
Support zone in case of pressure.

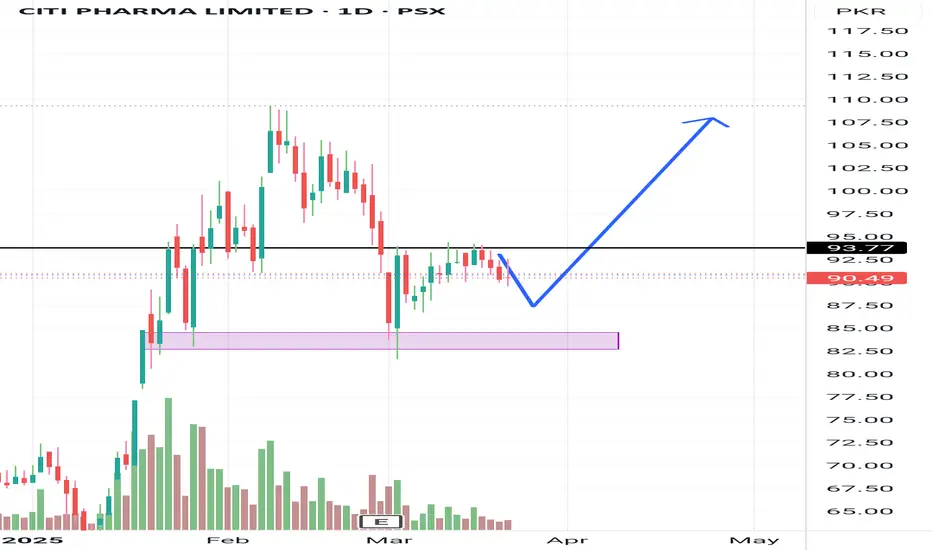
CPHL Buying setupHere is the corrected text:
"CpHL is currently trading in the buying zone. We can buy:
1. Around 87-83
2. Second buy when price crosses or closes above 93
Stop Loss: 81
Target: 108
Further hold if closes above 108."
CPHL BUYING SETUPHere is the corrected text:
"CpHL is currently trading in the buying zone. We can buy:
1. Around 87-83
2. Second buy when price crosses or closes above 93
Stop Loss: 81
Target: 108
Further hold if closes above 108."